
Objectives
Metabolic syndrome affects 20-30% of adults and is increasing in prevalence, making it a leading public health issue. Radiologists often encounter images of obese patients during routine studies and are in a unique position to address the importance of excess fat and need to be aware of the spectrum of pathologic consequences in different organ systems. In this review, the role of CT and MR imaging in assessment of patients with metabolic syndrome will be reviewed and the constellation of structural and functional changes in the major affected organ systems due to ectopic fatty deposition will be discussed.
Methods
We specifically discuss the pathophysiology of metabolic syndrome, visceral versus subcutaneous obesity, cardiac lipomatosis, nonalcoholic fatty liver disease, nonalcoholic fatty pancreas disease, and fat deposition in other organs.
Conclusion
Many of the multisystem manifestations of metabolic syndrome can be visualized on routine CT and MR images and radiologists can provide clinicians with important data regarding anatomic and pathologic distribution of fat in different organs. Perhaps the visualization of the fatty changes will provide tangible evidence to motivate patients to begin lifestyle modification.
Metabolic syndrome affects 20%–30% of adults and is increasing in prevalence, making it a leading public health issue. Radiologists often encounter images of obese patients during routine studies and are in a unique position to address the importance of excess fat and need to be aware of the spectrum of pathologic consequences in different organ systems. In this review, the role of computed tomography and magnetic resonance imaging in assessment of patients with metabolic syndrome will be reviewed and the constellation of structural and functional changes in the major affected organ systems resulting from ectopic fatty deposition will be discussed.
Metabolic syndrome affects 20%–30% of adults and is increasing in prevalence, making it a leading public health issue. Metabolic syndrome is primarily a clinical diagnosis based on the recognition of associated metabolic conditions, which in concert greatly increases cardiovascular risk and is the primary risk contributor to 25% of newly diagnosed cardiovascular disease . Although various differing clinical criteria exist, it is generally agreed that the cluster of metabolic conditions includes obesity, atherogenic dyslipidemia, hypertension, glucose intolerance, proinflammatory states, and prothrombotic states . The widely used clinical criteria from the National Cholesterol Education Program Adult Treatment Panel III (NCEP-ATPIII) requires a minimum of three of five abnormal clinical findings in reference to waist circumference, triglycerides, high-density lipoprotein cholesterol, blood pressure, and fasting glucose ( Fig 1 ). The NCEP-ATPIII criteria emphasizes waist circumference because abdominal or visceral obesity is central to and may explain the other components of the syndrome, and has also been found to be most predictive of cardiovascular risk .
 Open full size image
Figure 1
National Cholesterol Education Program Adult Treatment Panel III diagnostic criteria for metabolic syndrome emphasizing waist circumference over body mass index as more specific for visceral fat.
Get Radiology Tree app to read full this article<
Visceral versus subcutaneous fat
Get Radiology Tree app to read full this article<
Get Radiology Tree app to read full this article<
Get Radiology Tree app to read full this article<
Cardiac lipomatosis
Get Radiology Tree app to read full this article<
Get Radiology Tree app to read full this article<
Get Radiology Tree app to read full this article<
Get Radiology Tree app to read full this article<
Get Radiology Tree app to read full this article<
Get Radiology Tree app to read full this article<
Nonalcoholic fatty liver disease
Get Radiology Tree app to read full this article<
Get Radiology Tree app to read full this article<
Get Radiology Tree app to read full this article<
Get Radiology Tree app to read full this article<
Get Radiology Tree app to read full this article<
Table 1
Summary of CT Grading of Liver Steatosis
CT Protocol Steatosis Findings Noncontrast Present Hepatic attenuation less than splenic attenuation, Liver parenchyma attenuation less than 48 HU >30% Hepatic parenchyma less than hepatic vessel attenuation ˜ 30% Hepatic to splenic attenuation ratio <0.8
Hepatic to splenic attenuation difference of −10 HU Dual-energy ˜ 25% High (140 KVP) to low (80 KVP) energy hepatic attenuation difference of 10 HU With contrast Present Hepatic to splenic attenuation difference of −20 to −25 HU
CT, computed tomography; HU, Hounsfield units.
Get Radiology Tree app to read full this article<
Get Radiology Tree app to read full this article<
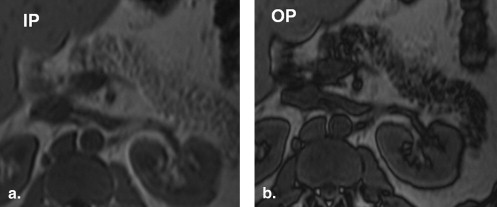
![Figure 8, Axial chemical shift imaging with in-phase (a) and out-of-phase (b) fast gradient echo images in the same patient who had computed tomography obtained in Figure 7 . In-phase hepatic to splenic ratio is 377/322 = 1.2. Out-of-phase hepatic to splenic ratio is 127/331 = 0.4. Fat signal percentage calculated by the Dixon method estimates hepatic steatosis at [(1.2 - 0.4)/2 × 1.2] × 100 = 33%.](https://storage.googleapis.com/dl.dentistrykey.com/clinical/MetabolicSyndromeandEctopicFatDeposition/6_1s20S1076633210001753.jpg)
Table 2
Quantification of Liver Steatosis using MR
MR Protocol Determination Comments Modified Dixon method (chemical shift fast gradient echo) Calculate fat signal percentage (FSP):
FSP = [(SIT1 IP - SIT1 OP/2(SIT1 IP)] 100
Calculate fat signal fraction (FSF)
FSF = (SIP - SOP)/ 2(SIP) Possible to detect hepatic fat fraction >15% Fast spin echo T2WI with and without fat saturation Calculate hepatic fat percentage (HFP)
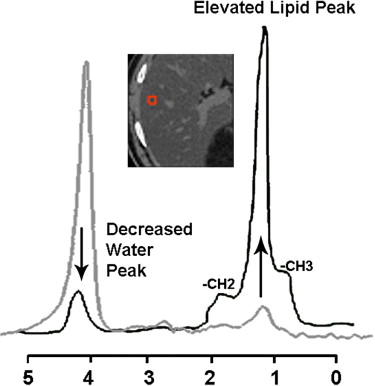
HFP = [(SIT2 NF - SIT2 FS)/SIT2 NF] 100 Less susceptible to T2 effect than modified Dixon, and may be preferred for cirrhotic patients 1 H-MR spectroscopy Total triglyceride concentration can be measured by the sum of individual lipid peak areas divided by the sum of total lipid and water resonance peak areas True single voxel measurement of fat content and most accurate
MR, magnetic resonance; SIT1 IP, ratio of hepatic to splenic signal intensity on in-phase T1WI; SIT1 OP; ratio of hepatic to splenic signal intensity on out-of-phase T1WI; SIP, net hepatic signal on in-phase images; SOP, net hepatic signal on out-of-phase images; SIT2 NF, ratio of hepatic to splenic signal intensity on non–fat-saturated T2WI; SIT2 FS, ratio of hepatic to splenic signal intensity on fat saturated T2WI.
Get Radiology Tree app to read full this article<
NAFPD
Get Radiology Tree app to read full this article<
Get Radiology Tree app to read full this article<
Get Radiology Tree app to read full this article<
Get Radiology Tree app to read full this article<
Get Radiology Tree app to read full this article<
Peripheral ectopic fat deposition in the musculoskeletal system
Get Radiology Tree app to read full this article<
Get Radiology Tree app to read full this article<
Submucosal fat deposition in the gastrointestinal tract
Get Radiology Tree app to read full this article<
Get Radiology Tree app to read full this article<
Conclusion
Get Radiology Tree app to read full this article<
References
1. Grundy S.M.: Metabolic syndrome pandemic. Arterioscler Thromb Vasc Biol 2008; 28: pp. 629-636.
2. Executive Summary of the Third Report of The National Cholesterol Education Program (NCEP) Expert Panel on Detection: Evaluation, and Treatment of High Blood Cholesterol in Adults (Adult Treatment Panel III). JAMA 2001; 285: pp. 2486-2497.
3. Eckel R.H., Grundy S.M., Zimmet P.Z.: The metabolic syndrome. Lancet 2005; 365: pp. 1415-1428.
4. Lakka H.M., Laaksonen D.E., Lakka T.A., et. al.: The metabolic syndrome and total and cardiovascular disease mortality in middle-aged men. JAMA 2002; 288: pp. 2709-2716.
5. Van Gaal L.F., Mertens I.L., De Block C.E.: Mechanisms linking obesity with cardiovascular disease. Nature 2006; 444: pp. 875-880.
6. Engeli S., Bohnke J., Feldpausch M., et. al.: Activation of the peripheral endocannabinoid system in human obesity. Diabetes 2005; 54: pp. 2838-2843.
7. Bellocchio L., Vicennati V., Cervino C., et. al.: The endocannabinoid system in the regulation of cardiometabolic risk factors. Am J Cardiol 2007; 100: pp. 7P-17P.
8. Nieves D.J., Cnop M., Retzlaff B., et. al.: The atherogenic lipoprotein profile associated with obesity and insulin resistance is largely attributable to intra-abdominal fat. Diabetes 2003; 52: pp. 172-179.
9. Lau D.C., Dhillon B., Yan H., et. al.: Adipokines: molecular links between obesity and atheroslcerosis. Am J Physiol Heart Circ Physiol 2005; 288: pp. H2031-H2041.
10. Després J.P., Lemieux I., Bergeron J., et. al.: Abdominal obesity and the metabolic syndrome: contribution to global cardiometabolic risk. Arterioscler Thromb Vasc Biol 2008; 28: pp. 1039-1049.
11. Yoshizumi T., Nakamura T., Yamane M., et. al.: Abdominal fat: standardized technique for measurement at CT. Radiology 1999; 211: pp. 283-286.
12. Taylor G.: Good fat, bad fat—does location matter?. Radiology 2007; 242: pp. 645-646.
13. Sacks H.S., Fain J.N.: Human epicardial adipose tissue: a review. Am Heart J 2007; 153: pp. 907-917.
14. Rabkin S.W.: Epicardial fat: properties, function and relationship to obesity. Obes Rev 2007; 8: pp. 253-261.
15. Iacobellis G., Assael F., Ribaudo M.C., et. al.: Epicardial fat from echocardiography: a new method for visceral adipose tissue prediction. Obes Res 2003; 11: pp. 304-310.
16. Marchington J.M., Mattacks C.A., Pond C.M.: Adipose tissue in the mammalian heart and pericardium; structure, foetal development and biochemical properties. Comp Biochem Physiol 1989; 94B: pp. 225-232.
17. Mazurek T., Zhang L., Zalewski A., et. al.: Human epicardial adipose tissue is a source of inflammatory mediators. Circulation 2003; 108: pp. 2460-2466.
18. Bharati S., Lev M.: Cardiac conduction system involvement in sudden death of obese young people. Am Heart J 1996; 129: pp. 273-281.
19. James T.N., St Martin E., Willis P.W., et. al.: Apoptosis as a possible cause of gradual development of complete heart block and fatal arrhythmias associated with absence of the AV node, sinus node, and internodal pathways. Circulation 1996; 93: pp. 1424-1438.
20. Hutter A.M., Page D.L.: Atrial arrhythmias and lipomatous hypertrophy of the cardiac interatrial septum. Am Heart J 1971; 82: pp. 16-21.
21. Kalman J.M., Olgin J.E., Karch M.R., et. al.: “Cristal tachycardias”: origin of right atrial tachycardias from the crista terminalis identified by intracardiac echocardiography. J Am Coll Cardiol 1998; 31: pp. 451-459.
22. Nakagawa H., Lazzara R., Khastgir T., et. al.: Role of the tricuspid annulus and the eustachian valve/ridge on atrial flutter: relevance to catheter ablation of the septal isthmus and a new technique for rapid identification of ablation success. Circulation 1996; 94: pp. 407-424.
23. Ariyarajah V., Asad N., Tandar A., et. al.: Interatrial block: pandemic prevalence, significance, and diagnosis. Chest 2005; 128: pp. 970-975.
24. Saremi F., Channual S., Krishnan S., et. al.: Bachmann bundle and its arterial supply: imaging with multidetector CT—implications for interatrial conduction abnormalities and arrhythmias. Radiology 2008; 248: pp. 447-457.
25. McNamara R.F., Taylor A.E., Panner B.J.: Superior vena caval obstruction by lipomatous hypertrophy of the right atrium. Clin Cardiol 1987; 10: pp. 609-610.
26. de Voogt W.G., Ruiter J.H.: Occlusion of the coronary sinus: a complication of resynchronisation therapy for severe heart failure. Europace 2006; 8: pp. 456-458.
27. Tansey D.K., Aly Z., Sheppard M.N.: Fat in the right ventricle of the normal heart. Histopathology 2005; 46: pp. 98-104.
28. Kessels K., Cramer M.J., Veldhuis B.: Epicardial adipose tissue imaged by magnetic resonance imaging: an important risk marker of cardiovascular disease. Heart 2006; 92: pp. 262.
29. Ferraro S., Perrone-Filardi P., Desiderio A., et. al.: Left ventricular systolic and diastolic function in severe obesity: a radionuclide study. Cardiology 1996; 87: pp. 347-353.
30. Wong C.Y., O’Moore-Sullivan T., Leano R., et. al.: Alterations of left ventricular myocardial characteristics associated with obesity. Circulation 2004; 1: pp. 3081-3087.
31. Raney A.R., Saremi F., Kenchaiah S., et. al.: Multidetector computed tomography shows intramyocardial fat deposition. J Cardiovasc Comput Tomogr 2008; 2: pp. 152-163.
32. McKenna W.J., Thiene G., Nava A., et. al.: Diagnosis of arrhythmogenic right ventricular dysplasia/cardiomyopathy. Task Force of the Working Group Myocardial and Pericardial Disease of the European Society of Cardiology and of the Scientific Council on Cardiomyopathies of the International Society and Federation of Cardiology. Br Heart J 1994; 71: pp. 215-218.
33. Kimura F., Sakai F., Sakomura Y., et. al.: Helical CT features of arrhythmogenic right ventricular cardiomyopathy. Radiographics 2002; 22: pp. 1111-1124.
34. Litwin S.E.: Cardiac remodeling in obesity: time for a new paradigm. JACC Cardiovasc Imaging 2010; 3: pp. 275-277.
35. van der Meer R.W., Doornbos J., Kozerke S., et. al.: Metabolic imaging of myocardial triglyceride: reproducibility of 1H-MR spectroscopy using respiratory navigator gating in volunteers. Radiology 2007; 245: pp. 251-257.
36. Kankaanpaa M., Lehto H.R., Parkka J.P., et. al.: Myocardial triglyceride content and epicardial fat mass in human obesity: relationship to left ventricular function and serum free fatty acid levels. J Clin Endocrinol Metab 2006; 91: pp. 4689-4695.
37. Mazhar S.M., Shiehmorteza M., Sirlin C.B.: Noninvasive assessment of hepatic steatosis. Clin Gastroenterol Hepatol 2009; 7: pp. 135-140.
38. Farrell G.C., Larter C.Z.: Nonalcoholic fatty liver disease: from steatosis to cirrhosis. Hepatology 2006; 43: pp. S99-S112.
39. Ryan M.C., Wilson A.M., Slavin J., et. al.: Associations between liver histology and severity of the metabolic syndrome in subjects with nonalcoholic fatty liver disease. Diabetes Care 2005; 28: pp. 1222-1224.
40. Ma X., Holalkere N.S., Kambadakone R.A., et. al.: Imaging-based quantification of hepatic fat: methods and clinical applications. RadioGraphics 2009; 29: pp. 1253-1280.
41. Adams L.A., Lymp J.F., St Sauver J., et. al.: The natural history of nonalcoholic fatty liver disease: a population-based cohort study. Gastroenterology 2005; 129: pp. 113-121.
42. Lyznicki J.M., Young D.C., Riggs J.A., et. al.: Obesity: assessment and management in primary care. Am Fam Physician 2001; 63: pp. 2185-2196.
43. Elias J., Altun E., Zacks S., et. al.: MRI findings in nonalcoholic steatohepatitis: correlation with histopathology and clinical staging. Magn Reson Imaging 2009; 27: pp. 976-987.
44. Raptopoulos V., Karellas A., Bernstein J., et. al.: Value of dual-energy CT in differentiating focal fatty infiltration of the liver from low-density masses. AJR Am J Roentgenol 1991; 157: pp. 721-725.
45. d’Assignies G : Ruel M, Khiat A, at al. Noninvasive quantitation of human liver steatosis using magnetic resonance and bioassay methods. Eur Radiol 2009; 19: pp. 2033-2040.
46. Qayyum A.: MR spectroscopy of the liver: principles and clinical applications. Radiographics 2009; 29: pp. 1653-1664.
47. Cowin G.J., Jonsson J.R., Bauer J.D., et. al.: Magnetic resonance imaging and spectroscopy for monitoring liver steatosis. J Magn Reson Imaging 2008; 28: pp. 937-945.
48. Mathur A., Marine M., Lu D., et. al.: Nonalcoholic fatty pancreas disease. HPB (Oxford) 2007; 9: pp. 312-318.
49. Lee J.S., Kim S.H., Jun D.W., et. al.: Clinical implications of fatty pancreas: correlations between fatty pancreas and metabolic syndrome. World J Gastroenterol 2009; 15: pp. 1869-1875.
50. Katz D.S., Hines J., Math K.R., et. al.: Using CT to reveal fat-containing abnormalities of the pancreas. AJR Am J Roentgenol 1999; 172: pp. 393-396.
51. Kim H.J., Byun J.H., Park S.H., et. al.: Focal fatty replacement of the pancreas: usefulness of chemical shift MRI. AJR Am J Roentgenol 2007; 188: pp. 429-432.
52. Rogers J., Stratta R.J., Lo A., et. al.: Impact of the metabolic syndrome on long-term outcomes in simultaneous kidney-pancreas transplantation. Transplant Proc 2005; 37: pp. 3549-3551.
53. Weiss R., Dufour S., Groszmann A.: Low adiponectin levels in adolescent obesity: a marker of increased intramyocellular lipid accumulation. J Clin Endocrinol Metab 2003; 88: pp. 2014-2018.