
Rationale and Objectives
The aim of this study was to design a pulse sequence that suppresses methemoglobin and is applicable in a 0.3-T permanent magnet.
Materials and Methods
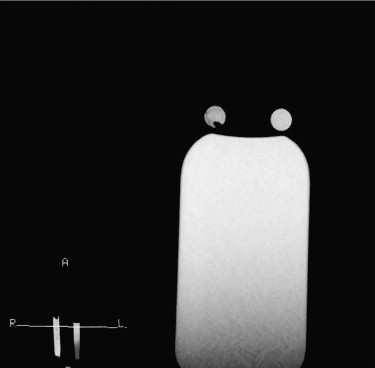
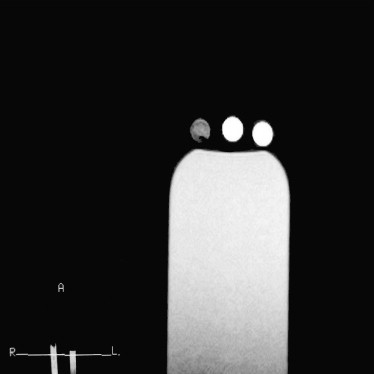
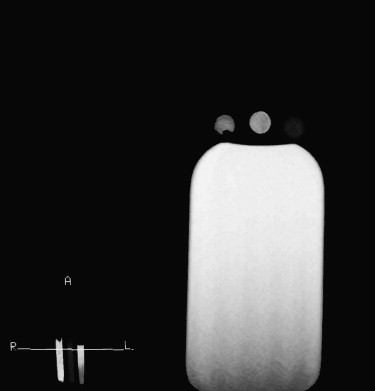
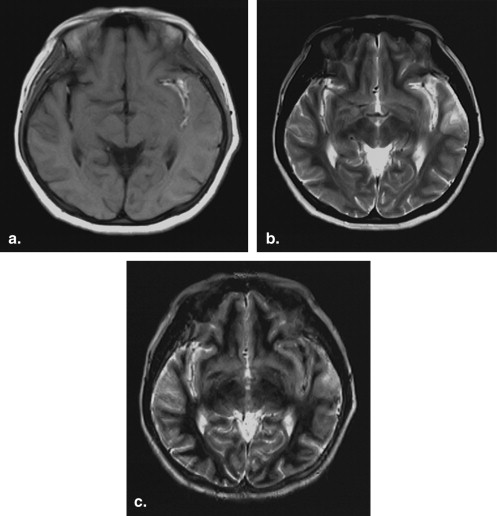
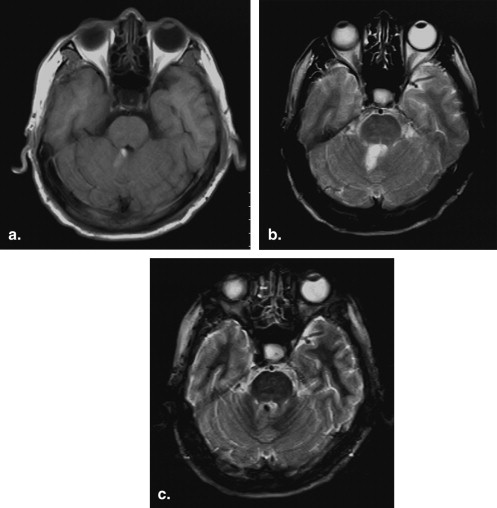
Blood samples were collected from six healthy volunteers. Magnetic resonance imaging was performed with a 0.3-T scanner until the typical signal intensities of methemoglobin were obtained. Each blood sample was then scanned using repetition times of 300, 600, 900, 1200, 1500, and 1800 ms and a constant echo time of 20 ms. All other parameters (field of view, slice thickness, matrix, and number of signal averages) were kept constant for all six sequences. Signal intensities and repetition time data were used to calculate the T1 relaxation time of extracellular methemoglobin. T1 was determined by ordinary least square regression according to the equation S = k (1 − e −repetition time/T1 ), where S is signal intensity and k is the proportional constant. A short tau inversion recovery sequence with an inversion time calculated from the T1 value of methemoglobin was used on fat, water, and methemoglobin blood samples and in 11 patients diagnosed with subacute brain hemorrhages. The inversion time was calculated as ln2 T1 (tissue), where T1 is the relaxation time of extracellular methemoglobin to be suppressed.
Results
The T1 relaxation time of extracellular methemoglobin was determined to be 231.24 ± 9.068 ms, and inversion time was calculated to be 160 ± 6.67 msec. Application of an inversion time of 160 ms showed complete suppression on extracellular methemoglobin blood samples and all of the 11 subjects.
Conclusion
A methemoglobin suppression technique using an inversion time of 160 ± 6.67 ms is applicable in a 0.3-T permanent magnet.
Magnetic resonance (MR) suppression techniques are gaining importance in imaging because they allow the perturbation of tissue contrast to enhance the signal from tissues of greater interest. Fat and water are the two tissues commonly suppressed in clinical practice. Methemoglobin suppression is not as popular as fat and water suppression, because blood products of varying ages can produce a rather confusing appearance . We are unaware of any studies in which blood (methemoglobin) was suppressed using 0.3-T magnets. We therefore undertook this study to design a pulse sequence that suppresses extracellular methemoglobin and to test it on patients with subacute hemorrhages.
Materials and methods
This was a prospective, single-institution study approved by our hospital’s institutional review board.
Get Radiology Tree app to read full this article<
Get Radiology Tree app to read full this article<
Get Radiology Tree app to read full this article<
Get Radiology Tree app to read full this article<
Get Radiology Tree app to read full this article<
Results
Get Radiology Tree app to read full this article<
Get Radiology Tree app to read full this article<
Get Radiology Tree app to read full this article<
Get Radiology Tree app to read full this article<
Get Radiology Tree app to read full this article<
Discussion
Get Radiology Tree app to read full this article<
Get Radiology Tree app to read full this article<
Get Radiology Tree app to read full this article<
Get Radiology Tree app to read full this article<
Get Radiology Tree app to read full this article<
Conclusion
Get Radiology Tree app to read full this article<
References
1. Bradley W.G., Schmidt P.G.: Effect of methemoglobin formation on the MR appearance of subarachnoid hemorrhage. Radiology 1985; 156: pp. 99-103.
2. Cohen M.D., Mcquire W., Cory D.A., et. al.: MR appearance of blood and blood products: an in vitro study. AJR Am J Roentgenol 1986; 146: pp. 1293-1297.
3. Chan J.H., Peh W.C.: Methemoglobin suppression in T2-weighted pulse sequences: an adjunctive technique in MR imaging of hemorrhagic tumors. AJR Am J Roentgenol 1999; 173: pp. 13-14.
4. Atlas S.W., Grossman R.I., Hackney D.B., et. al.: STIR MR imaging of the orbit. AJR Am J Roentgenol 1988; 151: pp. 1025-1030.
5. Koenig S.H., Brown R.D., Adams D., et. al.: Magnetic field dependence of 1/T1 of protons in tissue. Invest Radiol 1984; 19: pp. 76-81.
6. Gomori J.M., Grossman R.I., Yu-Ip C., et. al.: NMR relaxation times of blood: dependence on field strength, oxidative state, and cell integrity. J Comput Assist Tomogr 1987; 11: pp. 684-690.