
Rationale and Objectives
Micro-computed tomography (CT) is a important tool for longitudinal imaging of tumor development. The detection and monitoring of tumors in the liver in live animals using micro-CT is challenging. We evaluated the feasibility of high-resolution micro-CT enhanced with a hepatocyte-selective contrast agent for detecting liver metastases in a live murine model.
Materials and Methods
Hepatic metastases were induced in 10 BALB/C mice. Two mice each were randomly selected on days 3, 5, 7, 10, and 13 after CT26 colon adenocarcinoma cells were injected into the portal vein; micro-CT imaging was performed at 10 minutes and 4 hours after intravenous administration of a hepatocyte-selective contrast agent at a dose of 0.4 mL/mouse. The attenuation values of the normal liver and the tumors were obtained. The number of metastases was counted and their sizes were measured on the micro-CT images. Gross or histopathologic evaluation was performed for correlating the liver tumors with the micro-CT images.
Results
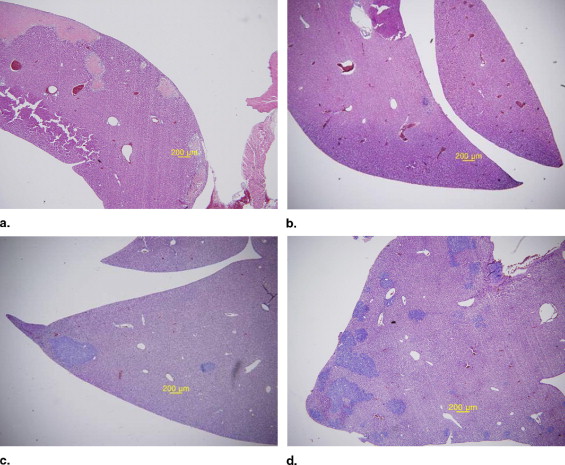
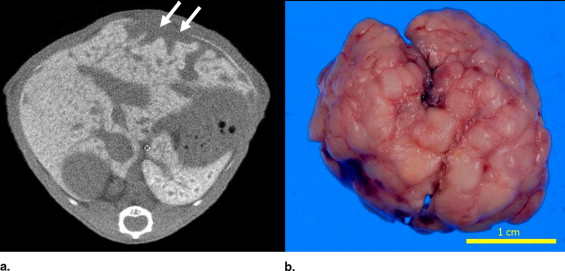
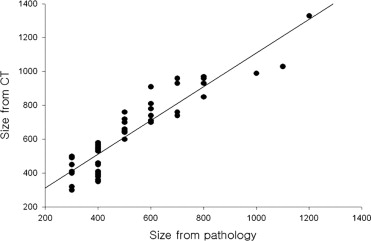
A total of 74 separate tumor sites larger than 300 μm in diameter were detected on pathologic examination of the mice that were sacrificed 7 days after cell injection. On micro-CT, 66 of 74 tumors were detected (83.8%). The smallest tumor detected on micro-CT was 300 μm. There were eight false-negative readings on micro-CT. The sizes of the individual liver metastases measured by micro-CT and on the excised specimen were highly correlated ( P < .001). The correlation between the CT scan measurement and the actual measurement was r = 0.8354 ( P < .0001).
Conclusions
High-resolution micro-CT enhanced with a hepatocyte-selective contrast agent can be a promising tool for detecting liver metastases in a live murine model.
The liver is a common site of metastases from various primary tumors, and so it is an important area of metastasis research ( ). Rodent models that mimic the development of metastatic disease in the human liver are increasingly being recognized as powerful tools for the development of anticancer drugs and for evaluating the efficacy of novel therapeutics in the preclinical setting ( ). Noninvasive longitudinal imaging of rodent models would decrease experimental variability and provide a more accurate assessment of metastatic progression and the efficacy of therapeutic interventions ( ). Several longitudinal imaging modalities are now used, including magnetic resonance imaging, x-ray computed tomography (CT), positron emission tomography, and fluorescent and bioluminescent imaging.
Micro-CT has been applied in biomedical research mainly for studying bones and lung disease, for which the natural contrast between bone and air and the surrounding soft tissues are provided ( ). Micro-CT increased the spatial resolution noninvasively and it allowed very high precision for localization of bony changes. It has been proposed by some researchers that small-animal x-ray CT is an important tool for longitudinal imaging of tumor development, for visualizing blood vessels and angiogenesis, and for following the response of tumors to preclinical therapeutic intervention ( ). However, the detection and monitoring of tumor in the liver in live animals using micro-CT is still challenging because of the poor natural contrast between the tumor and the liver parenchyma. When performing micro-CT imaging for the liver of small animals, it is not possible to use the conventional water-soluble contrast agents that are used in humans because they clear rapidly from the blood.
Get Radiology Tree app to read full this article<
Get Radiology Tree app to read full this article<
Methods and materials
Tumor Model
Get Radiology Tree app to read full this article<
Micro-CT System
Get Radiology Tree app to read full this article<
Micro-CT Imaging
Get Radiology Tree app to read full this article<
Image Analysis
Get Radiology Tree app to read full this article<
Histopathologic Correlation
Get Radiology Tree app to read full this article<
Statistical Analysis
Get Radiology Tree app to read full this article<
Results
Histopathologic Findings of the Metastatic Liver Tumors
Get Radiology Tree app to read full this article<
Get Radiology Tree app to read full this article<
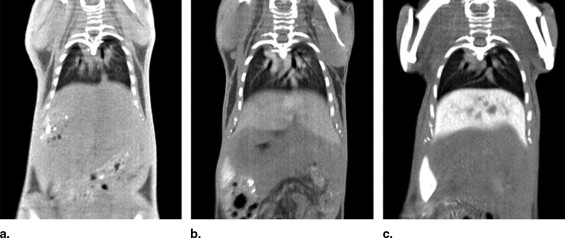
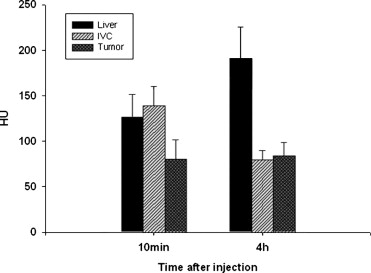
Liver Parenchyma and Tumor Attenuation on the Micro-CT Images
Get Radiology Tree app to read full this article<
Get Radiology Tree app to read full this article<
Get Radiology Tree app to read full this article<
Table 1
Mean CT Number and Standard Deviation Measured in the Livers and Tumors of the Mice
Time (h) Liver Parenchyma Mean ± SD (HU) Tumor Mean ± SD (HU) Statistical Analysis ( P value) Precontrast 77.8 ± 5.76 71.7 ± 7.73 .132062 10 min 126.3 ± 25.15 80.82 ± 21.72 .011595 4 h 191.14 ± 34.24 84.05 ± 14.28 .00021
CT: computed tomography; SD: standard deviation; HU: Hounsfield units.
Get Radiology Tree app to read full this article<
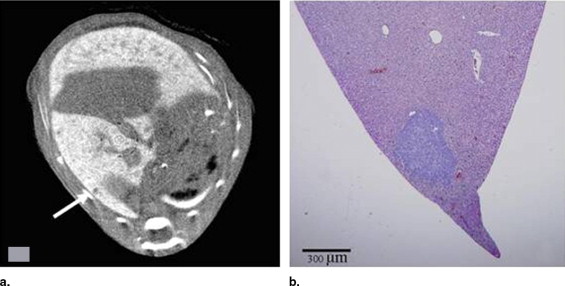
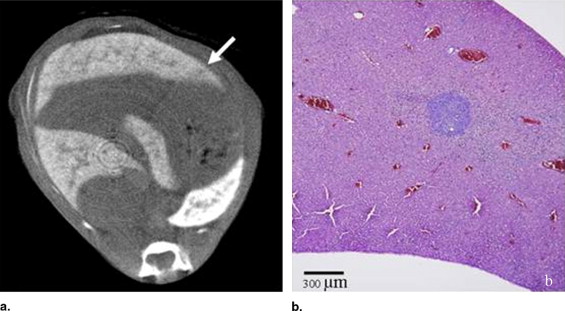
Micro-CT Images Correlated with the Histopathology
Get Radiology Tree app to read full this article<
Get Radiology Tree app to read full this article<
Get Radiology Tree app to read full this article<
Table 2
Detectability of the Experimental Liver Tumors
Tumor Size No. on Micro–CT No. on Pathology Detectability >500 μm 32 32 100% 300–500 μm 34 42 80.9% Total 66 74 83.8%
CT: computed tomography.
Get Radiology Tree app to read full this article<
Get Radiology Tree app to read full this article<
Get Radiology Tree app to read full this article<
Discussion
Get Radiology Tree app to read full this article<
Get Radiology Tree app to read full this article<
Get Radiology Tree app to read full this article<
Get Radiology Tree app to read full this article<
Get Radiology Tree app to read full this article<
Get Radiology Tree app to read full this article<
Get Radiology Tree app to read full this article<
Get Radiology Tree app to read full this article<
Get Radiology Tree app to read full this article<
References
1. Liu Y., Matsui O.: Changes of intratumoral microvessels and blood perfusion during establishment of hepatic metastases in mice. Radiology 2007; 243: pp. 386-395.
2. Gordon E.M., Liu P.X., Chen Z.H., et. al.: Inhibition of metastatic tumor growth in nude mice by portal vein infusions of matrix-targeted retroviral vectors bearing a cytocidal cyclin G1 construct. Cancer Res 2000; 60: pp. 3343-3347.
3. Suh K.W., Piantadosi S., Yazdi H.A., et. al.: Treatment of liver metastases from colon carcinoma with autologous tumor vaccine expressing granulocyte-macrophage colony-stimulating factor. J Surg Oncol 1999; 72: pp. 218-224.
4. Graham K.C., Wirtzfeld L.A., MacKenzie L.T., et. al.: Three-dimensional high-frequency ultrasound imaging for longitudinal evaluation of liver metastases in preclinical models. Cancer Res 2005; 65: pp. 5231-5237.
5. Chang C.H., Jan M.L., Fan K.H., et. al.: Longitudinal evaluation of tumor metastasis by an FDG-microPet/microCT dual-imaging modality in a lung carcinoma-bearing mouse model. Anticancer Res 2006; 26: pp. 159-166.
6. Paulus M.J., Gleason S.S., Kennel S.J., et. al.: High resolution X-ray computed tomography: an emerging tool for small animal cancer research. Neoplasia 2000; 2: pp. 62-70.
7. Li X.F., Zanzonico P., Ling C.C., et. al.: Visualization of experimental lung and bone metastases in live nude mice by X-ray micro-computed tomography. Technol Cancer Res Treat 2006; 5: pp. 147-155.
8. Marx J.: Imaging. Science 2003; 302: pp. 1880-1882.
9. Maehara N.: Experimental microcomputed tomography study of the 3D microangioarchitecture of tumors. Eur Radiol 2003; 13: pp. 1559-1565.
10. Weichert J.P., Lee F.T., Longino M.A., et. al.: Computed tomography scanning of hepatic tumors with polyiodinated triglycerides. Acad Radiol 1996; 3: pp. S229-S231.
11. Weichert J.P., Lee F.T., Chosy S.G., et. al.: Combined hepatocyte-selective and blood-pool contrast agents for the CT detection of experimental liver tumors in rabbits. Radiology 2000; 216: pp. 865-871.
12. Weichert J.P., Longino M.A., Spigarelli M.G., et. al.: Computed tomography scanning of Morris hepatomas with liver-specific polyiodinated triglycerides. Acad Radiol 1996; 3: pp. 412-417.
13. Ohta S., Lai E.W., Morris J.C., et. al.: MicroCT for high-resolution imaging of ectopic pheochromocytoma tumors in the liver of nude mice. Int J Cancer 2006; 119: pp. 2236-2241.
14. Almajdub M., Nejjari M., Poncet G., et. al.: In-vivo high-resolution X-ray microtomography for liver and spleen tumor assessment in mice. Contrast Media Mol Imaging 2007; 2: pp. 88-93.
15. Weber S.M., Peterson K.A., Durkee B., et. al.: Imaging of murine liver tumor using microCT with a hepatocyte-selective contrast agent: accuracy is dependent on adequate contrast enhancement. J Surg Res 2004; 119: pp. 41-45.
16. Ritman E.L.: Micro-computed tomography-current status and developments. Annu Rev Biomed Eng 2004; 6: pp. 185-208.
17. Cavanaugh D., Johnson E., Price R.E., et. al.: In vivo respiratory-gated micro-CT imaging in small-animal oncology models. Mol Imaging 2004; 3: pp. 55-62.
18. Taschereau R., Chow P.L., Chatziioannou A.F.: Monte carlo simulations of dose from microCT imaging procedures in a realistic mouse phantom. Med Phys 2006; 33: pp. 216-224.
19. Winkelmann C.T., Figueroa S.D., Rold T.L., et. al.: Microimaging characterization of a B16-F10 melanoma metastasis mouse model. Mol Imaging 2006; 5: pp. 105-114.