
Rationale and Objectives
The change in volume of lung nodules is being examined as a measure of response to treatment. The aim of this study was to determine the minimum detectable change in nodule volume with the use of computed tomography.
Materials and Methods
Four different layouts of synthetic nodules with different shapes but with the same size (5, 8, 9, or 10 mm) for each layout were placed within an anthropomorphic phantom and scanned with a 16-detector-row computed tomography scanner using multiple imaging parameters. Nodule volume estimates were determined using a previously developed matched-filter estimator. Analysis of volume change was then conducted as a detection problem. For each nodule size, the pooled distribution of volume estimates was shifted by a percentage c to simulate a changing nodule, while accounting for standard deviation. The value of c resulting in a prespecified area under the receiver operating characteristic curve (AUC) was deemed the minimum detectable change for that AUC value.
Results
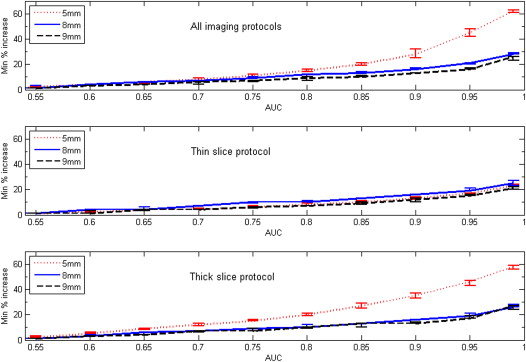
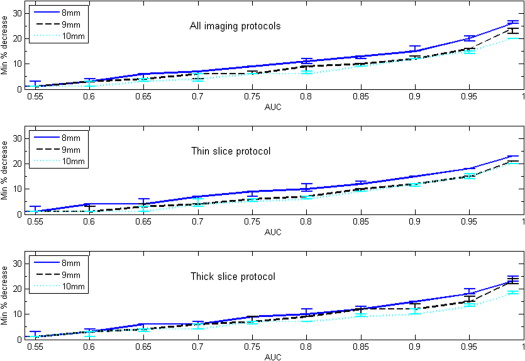
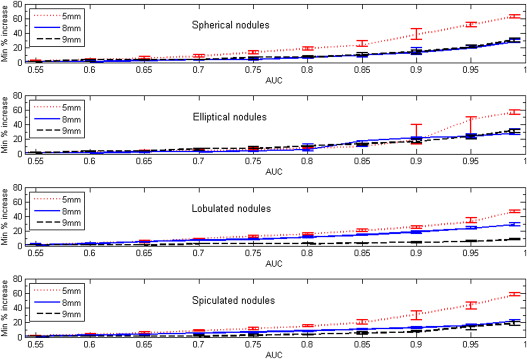
Both nodule size at baseline and choice of slice collimation protocol had an effect on the value of minimum detectable growth. For AUC = 0.95, the minimum detectable nodule growth in volume when using the thin-slice collimation protocol (16 × 0.75 mm) was 17%, 19%, and 15% for nodule sizes of 5, 8, and 9 mm, respectively.
Conclusions
Our results indicate that an approximate bound for detectable nodule growth in subcentimeter nodules may be relatively small, on the order of 20% or less in volume for a thin-slice CT acquisition protocol.
It is widely accepted in the scientific community that personalized medicine, the customization of health care with decisions and practices being tailored to the individual patient, is transforming patient care . Personalized medicine is being enabled by recently obtained genetic information as well as advances in quantitative science and emerging technologies such as nanotechnology . Quantifiable features, such as the expression of molecular or image-based biomarkers, are currently being used in many aspects of clinical practice, with still more potential uses being examined in research. The success and adoption of such biomarkers in clinical practice depend on the precision and accuracy of the techniques used to make the measurements.
As a case in point, the change in size of lung nodules as determined by computed tomography (CT) is being used as a measure of treatment response for some cancer treatments. Clinicians need to know whether a nodule’s change in size following treatment is due to the effectiveness of that treatment or simply related to measurement error. In one of the earliest attempts to incorporate quantitative data into clinical practice, Moertel and Henley recommended a 50% reduction in the product of perpendicular tumor diameters as a cut-off for determining partial response to treatment . That cut-off was based on an experiment of repeat measurements with calipers of synthetic tumor-mimicking objects placed under plastic foam, where 7.8% of the measurements of the same investigator and 6.8% of the measurements of different investigators varied by at least 50%. The 50% cut-off was the basis for the first standardized response criteria, the World Health Organization criteria , and subsequently influenced the partial response category of the Response Evaluation Criteria in Solid Tumours (RECIST) criteria, since a 50% reduction in nodule area (product of perpendicular diameters) corresponds to approximately a 30% reduction in maximum diameter for a sphere .
Get Radiology Tree app to read full this article<
Get Radiology Tree app to read full this article<
Get Radiology Tree app to read full this article<
Materials and Methods
Anthropomorphic Phantom and Synthetic Nodules
Get Radiology Tree app to read full this article<
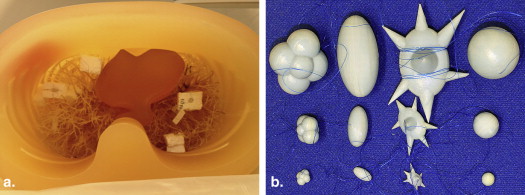
Get Radiology Tree app to read full this article<
Imaging Protocol
Get Radiology Tree app to read full this article<
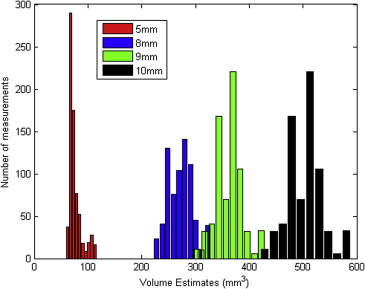
Volume Estimation
Get Radiology Tree app to read full this article<
Prediction of Minimum Detectable Change in Nodule Volume
Get Radiology Tree app to read full this article<
Get Radiology Tree app to read full this article<
pci,c=(pbi−pbi¯¯¯¯¯)∗σi,cσi+pbi¯¯¯¯∗(1+c), p
c
i
,
c
=
(
p
b
i
−
p
b
i
¯
)
∗
σ
i
,
c
σ
i
+
p
b
i
¯
∗
(
1
+
c
)
,
where pc__i,c is the change distribution by a relative change c of the baseline volume estimates of nodules with nominal diameter i , and σ__i,c is the standard deviation of pc__i,c , defined as:
σi,c=(pbi¯¯¯¯∗(1+c))∗CVi,c, σ
i
,
c
=
(
p
b
i
¯
∗
(
1
+
c
)
)
∗
C
V
i
,
c
,
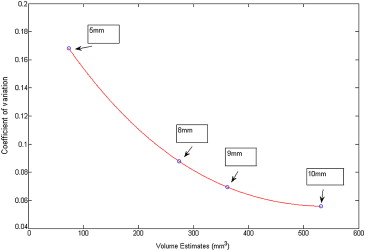
where CV__i,c is the interpolated coefficient of variation of pc__i,c at relative change c and for a baseline nominal diameter i , derived from a spline curve fitted across the coefficient of variation (standard deviation over mean) values of the four volume distributions. Figure 3 shows the interpolated coefficient of variation curve derived using pooled measurements from all imaging protocols.
Get Radiology Tree app to read full this article<
Get Radiology Tree app to read full this article<
Validation Step
Get Radiology Tree app to read full this article<
Results
Get Radiology Tree app to read full this article<
Get Radiology Tree app to read full this article<
Get Radiology Tree app to read full this article<
Get Radiology Tree app to read full this article<
Get Radiology Tree app to read full this article<
Get Radiology Tree app to read full this article<
Discussion
Get Radiology Tree app to read full this article<
Get Radiology Tree app to read full this article<
Get Radiology Tree app to read full this article<
) 1A study focusing on interreader variability and a comparison among one-, two-, and three-dimensional nodule size metrics , the QIBA 1C study focusing on interscanner variability , and the recently completed QIBA 3A study, which examined interalgorithm variability in volume estimation through a public algorithm challenge.
Get Radiology Tree app to read full this article<
Get Radiology Tree app to read full this article<
Get Radiology Tree app to read full this article<
Conclusions
Get Radiology Tree app to read full this article<
Acknowledgments
Get Radiology Tree app to read full this article<
References
1. Hamburg M.A., Collins F.S.: The path to personalized medicine. N Engl J Med 2010; 363: pp. 301-304.
2. Casciaro S., Soloperto G., Greco A., et. al.: Effectiveness of functionalized nanosystems for multimodal molecular sensing and imaging in medicine. IEEE Sens J 2013; 13: pp. 2305-2312.
3. Moertel C.G., Hanley J.A.: The effect of measuring error on the results of therapeutic trials in advanced cancer. Cancer 1976; 38: pp. 388-394.
4. Miller A.B., Hoogstraten B., Staquet M., et. al.: Reporting results of cancer treatment. Cancer 1981; 47: pp. 207-214.
5. Fojo A.T., Noonan A.: Why RECIST works and why it should stay. Cancer Res 2012; 72: pp. OF1-OF7.
6. Therasse P., Arbuck S.G., Eisenhauer E.A., et. al.: New guidelines to evaluate the response to treatment in solid tumors. J Natl Cancer Inst 2000; 92: pp. 205-216.
7. Eisenhauer E.A., Therasse P., Bogaerts J., et. al.: New response evaluation criteria in solid tumours: revised RECIST guideline (version 1.1). Eur J Cancer 2009; 45: pp. 228-247.
8. Sharma M.R., Maitland M.L., Ratain M.J.: RECIST: no longer the sharpest tool in the oncology clinical trials toolbox (Point-Counterpoint Review). Cancer Res 2012; 72: pp. 5145-5149.
9. Fojo A.T., Noonan A.: RECIST: no longer the sharpest tool in the oncology clinical trials toolbox (Point-Counterpoint Review). Cancer Res 2012; 72: pp. 5150-5151.
10. Gavrielides M.A., Kinnard L.M., Myers K.J., et. al.: Non-calcified lung nodules: volumetric assessment with thoracic CT. Radiology 2009; 251: pp. 26-37.
11. Chen B., Barnhart H., Richard S., et. al.: technique dependence of volume estimation on pulmonary nodules. Phys Med Biol 2012; 57: pp. 1335-1348.
12. Oxnard G.R., Zhao B., Sima C.S., et. al.: Variability of lung tumor measurements on repeat computed tomography scans taken within 15 minutes. J Clin Oncol 2011; 29: pp. 3114-3119.
13. Wang Y., de Bock G.H., van Klaveren R.J., et. al.: Volumetric measurement of pulmonary nodules at low-dose chest CT: effect of reconstruction setting on measurement variability. Eur Radiol 2010; 20: pp. 1180-1187.
14. Gavrielides M.A., Zeng R., Kinnard L.M., et. al.: Information-theoretic approach for analyzing bias and variance in lung nodule size estimation. IEEE Trans Med Imaging 2010; 29: pp. 1795-1807.
15. Gavrielides M.A., Zeng R., Myers K.J., et. al.: Benefit of overlapping reconstruction for improving the quantitative assessment of CT lung nodule volume. Acad Radiol 2013; 20: pp. 173-180.
16. Petrick N., Kim H.J.G., Clunie D., et. al.: Evaluation of 1D, 2D and 3D nodule size estimation by radiologists for spherical and non-spherical nodules through CT thoracic phantom imaging.Ronald M.Summers M.D.Bram van Ginneken E.SPIE Medical Imaging, 2011: Computer-Aided Diagnosis.2011.SPIEOrlando, FL: vol. 7963, p. 79630D.
17. Oda S., Awai K., Murao K., et. al.: Computer-aided volumetry of pulmonary nodules exhibiting ground-glass opacity at MDCT. AJR Am J Roentgenol 2010; 194: pp. 398-406.
18. Zhao B., Oxnard G.R., Moskowitz C.S., et. al.: A pilot study of volume measurement as a method of tumor response evaluation to aid biomarker development. Clin Cancer Res 2010; 16: pp. 4647-4653.
19. Reeves A.P., Chan A.B., Yankelevitz D.F., et. al.: On measuring the change in size of pulmonary nodules. IEEE Trans Med Imaging 2006; 25: pp. 435-450.
20. Zhao B., James L.P., Moskowitz C.S., et. al.: Evaluating variability in tumor measurements from same-day repeat CT scans of patients with non-small cell lung cancer. Radiology 2009; 252: pp. 263-272.
21. Wormanns D., Kohl G., Klotz E., et. al.: Volumetric measurements of pulmonary nodules at multi-row detector CT: in vivo reproducibility. Eur Radiol 2004; 14: pp. 86-92.
22. de Hoop B., Gietema H., van Ginneken B., et. al.: A comparison of six software packages for evaluation of solid lung nodules using semi-automated volumetry: what is the minimum increase in size to detect growth in repeated CT examinations?. Eur Radiol 2009; 19: pp. 800-808.
23. Li, Q., Zeng, R., Myers, K. J., Sahiner, B., Gavrielides, M. A., and Petrick, N. Relating fisher information to detectability of changes in nodule characteristics with CT. In Information Processing in Medical Imaging (IPMI), 2013, pp. 584-593. Publisher: Springer Berlin Heidelberg
24. Fenimore C, McNitt-Gray M, Lu J, et al. Clinician Sizing of Synthetic Nodules to Evaluate CT Interscanner Effects. Presented at the Annual meeting of the Radiological Society of North America (RSNA). Chicago, IL, Nov. 25-30, 2012.