
Rationale and Objectives
The cardiac chamber volumes and functions can be assessed manually and automatically using the current computed tomography (CT) workstation system. We aimed to evaluate the accuracy and precision and to establish the reference values for both segmentation methods using cardiac CT angiography (CTA).
Materials and Methods
A total of 134 subjects (mean age 55.3 years, 72 women) without heart disease were enrolled in the study. The cardiac four-chamber volumes, left ventricular (LV) mass, and biventricular functions were measured with manual, semiautomatic, and model-based fully automatic approaches. The accuracies of the semiautomated and fully automated approaches were validated by comparing them with manual segmentation as a reference. The precision error was determined and compared for both manual and automatic measurements.
Results
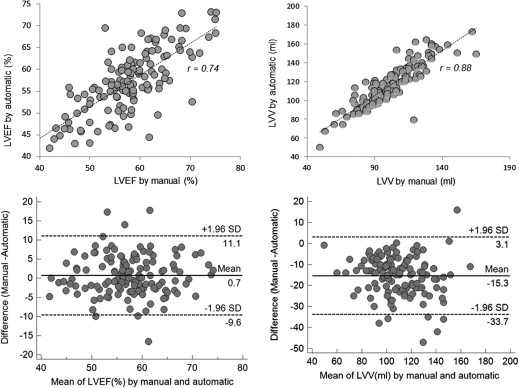
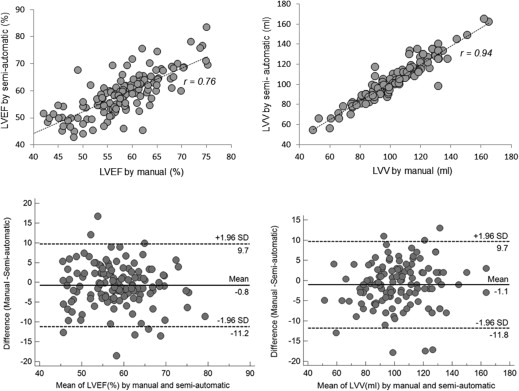
No significant difference was found between the manual and semiautomatic assessments for the assessment of all functional parameters ( P > .05). Using the manual method as a reference, the automatic approach provided a similar value in LV ejection fraction and left atrial volumes in both genders and right ventricular (RV) stroke volume in women ( P > .05), with some underestimation of RV volume ( P < .001) and overestimation of all remaining parameters ( P < .05) in both genders. In addition, a significantly higher precision with a considerable association in intermeasurement (reproducibility) was observed using the automated approach.
Conclusions
The model-based fully automatic segmentation algorithm can help with the assessment of the cardiac four-chamber volume and function. This may help in establishing reference values of functional parameters in patients who undergo cardiac CTA.
Currently, cardiac computed tomography angiography (cardiac CTA) is widely used as an effective method to detect and rule out coronary artery disease (CAD) and for the simultaneous assessment of size and function of cardiac chamber. The cardiac chamber volumes, left ventricular (LV) mass, and the biventricular systolic functions are important parameters for the diagnosis, prognosis, risk stratification, and management of patients with heart disease .
Semiautomated threshold-based segmentation techniques have been used to segment the blood pool for the assessment of the LV function . However, the complexity of heart anatomy, with suboptimal contrast within the right chambers, and a variety of other structures with different characteristics in the cardiac region pose a challenge, thereby demonstrating a need for more robust approaches for segmenting all the four chambers. These challenges have led to the development of a fully automatic model-based segmentation algorithm that has been evaluated in clinical studies , with the technical aspects described in previous works . To achieve fully automatic segmentation, detection of the heart location and extraction of the cardiac structures play a key role. Some initial studies indicated that the generalized hough transform algorithm may have the potential to detect the heart in three-dimensional (3D) space despite variations in cardiac shape, pose, and imaging protocols as well as in the presence of noise . The successive algorithms combining parametric and deformable adaptations can be used for the exact extraction of the cardiac anatomic structures . It is possible to segment whole cardiac structures accurately by the combination of both techniques described previously. Clinical studies have shown that this automatic segmentation algorithm is robust to significant morphologic, contrast, and noise variations across patients and imaging phases of R-R interval and has the potential to accurately segment the great vessels and four chambers .
Get Radiology Tree app to read full this article<
Get Radiology Tree app to read full this article<
Methods
Study Population
Get Radiology Tree app to read full this article<
Table 1
Clinical and Demographic Characteristics of Study Subjects
Characteristics Men ( n = 59) Women ( n = 72) Age (year) 54.0 ± 10.6 56.4 ± 11.1 Race Caucasian (%) 50.8 48.6 Hispanic (%) 15.2 18.1 African-American (%) 11.9 13.9 Asia (%) 13.6 9.7 Other (%) 8.5 9.7 Height (cm) 176.1 ± 11.9 159.6 ± 10.1 Weight (kg) 89.4 ± 21.4 71.1 ± 16.7 Body surface area (m 2 ) 2.1 ± 0.3 1.7 ± 0.2 Body mass index (kg/m 2 ) 28.8 ± 6.0 27.9 ± 6.1 Body mass index (BMI) BMI < 18.5 kg/m 2 (%) 0 1.4 BMI 18.5–24.9 kg/m 2 (%) 27.1 36.1 BMI 25–29.9 kg/m 2 (%) 40.7 34.7 BMI ≥ 30 kg/m 2 (%) 32.2 27.8 Chest pain 23.7 16.7 Family history of heart disease 35.6 38.9 Smoking (%) 5.0 1.4 Diabetes mellitus (%) 0 0 High cholesterol (%) 30.5 27.8 Hypertension (%) 0 0 Coronary Agatston Score 0 0 Lifestyle Sedentary (%) 8.4 8.3 Active (%) 69.2 68.1 Stress (%) 22.4 23.6 Heart rate during computed tomography angiography 56.4 ± 6.5 58.1 ± 8.1
Get Radiology Tree app to read full this article<
Multidetector Computed Tomography
Get Radiology Tree app to read full this article<
Cardiac CTA
Get Radiology Tree app to read full this article<
Data Acquisition
Get Radiology Tree app to read full this article<
Four-chamber Segmentations
Get Radiology Tree app to read full this article<
Get Radiology Tree app to read full this article<

Get Radiology Tree app to read full this article<
Get Radiology Tree app to read full this article<
Get Radiology Tree app to read full this article<
Get Radiology Tree app to read full this article<
Get Radiology Tree app to read full this article<
Get Radiology Tree app to read full this article<
Statistical Analyses
Get Radiology Tree app to read full this article<
Results
Get Radiology Tree app to read full this article<
Get Radiology Tree app to read full this article<
Get Radiology Tree app to read full this article<
Table 2
Reference Values of Four-Chamber Volumes at End Systole, Mid Diastole, and End Diastole with Manual and Automatic Methods
Men ( n = 59) Women ( n = 72) End Systole Mid Diastole End Diastole End Systole Mid Diastole End Diastole LVV manual (mL) 55.1 ± 14.0 109.0 ± 20.8 130.0 ± 22.9 46.4 ± 13.6 97.0 ± 19.1 113.8 ± 18.7 LVV automatic (mL) 63.0 ± 16.1 124.3 ± 22.7 148.9 ± 25.3 57.9 ± 15.0 111.5 ± 20.6 133.1 ± 22.0 LVV manual (mL/m 2 ) 27.2 ± 7.1 53.7 ± 10.8 64.1 ± 12.1 26.9 ± 7.8 56.2 ± 9.9 66.0 ± 9.9 LVV automatic (mL/m 2 ) 31.1 ± 8.6 61.3 ± 12.1 73.4 ± 13.5 33.8 ± 8.8 64.8 ± 11.8 77.4 ± 12.6 RVV manual (mL) 111.1 ± 28.9 167.9 ± 36.0 186.8 ± 38.1 76.9 ± 17.1 127.0 ± 26.7 142.3 ± 26.4 RVV automatic (mL) 106.1 ± 26.5 165.2 ± 36.0 185.8 ± 37.8 73.3 ± 15.8 122.1 ± 24.8 138.0 ± 25.2 RVV manual (mL/m 2 ) 54.2 ± 12.3 81.1 ± 15.1 91.4 ± 16.0 44.4 ± 8.6 73.6 ± 13.5 82.3 ± 12.4 RVV automatic (mL/m 2 ) 51.7 ± 11.1 80.7 ± 14.7 90.9 ± 15.5 42.5 ± 8.2 70.7 ± 12.4 80.0 ± 12.7 RAV manual (mL) 99.5 ± 25.4 81.2 ± 19.7 58.3 ± 17.6 89.7 ± 20.4 70.7 ± 16.1 46.6 ± 13.4 RAV automatic (mL) 106.4 ± 25.5 88.9 ± 22.8 68.7 ± 19.8 94.1 ± 22.6 73.6 ± 18.6 52.5 ± 15.6 RAV manual (mL/m 2 ) 49.1 ± 13.1 40.1 ± 10.2 28.6 ± 8.3 52.3 ± 12.6 41.3 ± 10.2 27.2 ± 8.3 RAV automatic (mL/m 2 ) 52.5 ± 13.2 43.7 ± 10.9 33.6 ± 9.0 54.8 ± 13.3 42.8 ± 10.9 30.5 ± 9.2 LAV manual, automatic (mL) 87.5 ± 17.9 73.1 ± 15.3 53.5 ± 16.0 85.8 ± 20.9 70.4 ± 18.3 52.8 ± 17.6 LAV manual, automatic (mL/m 2 ) 43.3 ± 10.3 36.1 ± 8.4 26.4 ± 8.4 50.1 ± 12.9 41.1 ± 11.2 30.9 ± 10.7
LAV, left atrial volume; LVV, left ventricular volume; RAV, right atrial volume; RVV, right ventricular volume.
Table 3
The Reference Values of Left and Right Ventricular Stroke Volume, Functions and LV Mass Using Both Manual and Automatic Assessment, and the Biases of Automatic Assessment from Manual Segmentation
n Manual Automatic Bias 95% CI_P_ value (Manual–Automatic)r value (Manual–Automatic) LVEF in men and women (%) 131 57.9 ± 7.4 57.2 ± 7.3 −0.7 −11.1, 9.6 .111 0.74 LVSV in men (mL) 59 74.9 ± 15.3 86.1 ± 17.4 11.2 −9.0, 31.4 <.001 0.81 LVSV in women (mL) 72 67.2 ± 12.3 75.3 ± 13.5 8.1 −7.7, 23.6 <.001 0.81 RVEF in men (%) 59 41.0 ± 6.3 43.4 ± 7.3 2.4 −4.3, 9.2 <.001 0.88 RVEF in women (%) 72 45.9 ± 5.3 47.2 ± 4.8 1.3 −4.9, 7.2 <.002 0.81 RVSV in men (mL) 59 75.7 ± 15.6 80.2 ± 18.4 4.5 −12.3, 21.0 <.001 0.89 RVSV in women (mL) 72 65.5 ± 13.7 64.8 ± 13.7 −0.7 −14.8, 13.6 .888 0.86 LV mass at mid diastole in men (g) 59 137.8 ± 35.1 142.6 ± 32.6 4.8 −26.4, 36.1 <.001 0.89 LV mass at mid diastole in women (g) 72 93.1 ± 18.8 97.6 ± 17.2 4.5 −23.8, 32.7 .012 0.89 LVV at mid diastole in men and women (mL) 131 102.4 ± 20.7 117.3 ± 22.4 14.9 −5.7, 35.5 <.001 0.88 RVV at mid diastole in men and women (mL) 131 145.3 ± 37.0 141.4 ± 37.1 −3.9 −21.0, 13.1 <.001 0.97 RAV at end systole in men and women (mL) 131 94.1 ± 23.2 99.6 ± 24.6 5.5 −15.4, 26.4 <.001 0.90 LAV at end systole in men and women (mL) 131 86.6 ± 19.6 85.7 ± 18.9 −0.9 −12.2, 10.4 .068 0.96
LAV, left atrial volume; LVEF, left ventricular ejection fraction; LV mass, LV myocardium; LVV, left ventricular volume; RAV, right atrial volume; RVV, right ventricular volume; SV, stroke volume.
The indexed parameters can be calculated using the body surface area (men in 2.1 and women in 1.7 m 2 ).
Table 4
Comparison of Precision Error between Manual and Automatic Segmentation in all Patients (C.V and Kappa Coefficient)
Manual C.V (%) Kappa Coefficient (95% CI) Auto C.V (%) Kappa Coefficient (95% CI) LVEF (%) 5.2 ± 2.8 0.70 (0.65–0.75) 2.1 ± 1.2 0.90 (0.88–0.93) LVSV (mL) 6.8 ± 4.5 0.72 (0.68–0.78) 3.9 ± 3.2 0.86 (0.83–0.88) LVV at end systole (mL) 8.5 ± 4.4 0.75 (0.70–0.80) 1.8 ± 1.2 0.96 (0.95–0.97) LVV at mid diastole (mL) 3.8 ± 4.2 0.72 (0.67–0.78) 2.0 ± 2.5 0.92 (0.91–0.94) LVV at end diastole (mL) 3.5 ± 4.7 0.78 (0.74–0.81) 1.9 ± 2.8 0.94 (0.93–0.95) LV mass at mid diastole (mL) 7.9 ± 8.8 0.72 (0.67–0.78) 1.8 ± 2.7 0.97 (0.96–0.99) Total LVV at mid diastole (mL) 3.1 ± 6.2 0.82 (0.78–0.86) 1.3 ± 3.9 0.94 (0.93–0.95) RVV at mid diastole (mL) 4.1 ± 5.8 0.80 (0.76–0.84) 1.6 ± 2.1 0.94 (0.93–0.95) RAV at end systole (mL) 4.8 ± 4.7 0.79 (0.77–0.81) 1.2 ± 1.2 0.98 (0.97–0.99) LAV at end systole (mL) 5.2 ± 4.3 0.78 (0.76–0.81) 1.7 ± 1.9 0.94 (0.93–0.96)
CV, cardiovascular; LAV, left atrial volume; LVEF, left ventricular ejection fraction; LV mass, LV myocardium; LVV, left ventricular volume; RAV, right atrial volume; RVV, right ventricular volume; SV, stroke volume.
Total LVV = LVV + LV mass.
Get Radiology Tree app to read full this article<
Discussion
Get Radiology Tree app to read full this article<
Get Radiology Tree app to read full this article<
Get Radiology Tree app to read full this article<
Get Radiology Tree app to read full this article<
Get Radiology Tree app to read full this article<
Get Radiology Tree app to read full this article<
Get Radiology Tree app to read full this article<
Get Radiology Tree app to read full this article<
Get Radiology Tree app to read full this article<
Get Radiology Tree app to read full this article<
Get Radiology Tree app to read full this article<
Get Radiology Tree app to read full this article<
Get Radiology Tree app to read full this article<
Get Radiology Tree app to read full this article<
Limitation
Get Radiology Tree app to read full this article<
Summary
Get Radiology Tree app to read full this article<
Get Radiology Tree app to read full this article<
Get Radiology Tree app to read full this article<
References
1. Devereux R.B., Wachtell K., Gerdts E., et. al.: Prognostic significance of left ventricular mass change during treatment of hypertension. JAMA 2004; 292: pp. 2350-2356.
2. Douglas P.S.: The left atrium: a biomarker of chronic diastolic dysfunction and cardiovascular disease risk. J Am Coll Cardiol 2003; 42: pp. 1206-1207.
3. Hammermeister K.E., DeRouen T.A., Dodge H.T.: Variables predictive of survival in patients with coronary disease. Selection by univariate and multivariate analyses from the clinical, electrocardiographic, exercise, arteriographic, and quantitative angiographic evaluations. Circulation 1979; 59: pp. 421-430.
4. Liao Y., Cooper R.S., McGee D.L., et. al.: The relative effects of left ventricular hypertrophy, coronary artery disease, and ventricular dysfunction on survival among black adults. JAMA 1995; 273: pp. 1592-1597.
5. Polak J.F., Holman B.L., Wynne J., et. al.: Right ventricular ejection fraction: an indicator of increased mortality in patients with congestive heart failure associated with coronary artery disease. J Am Coll Cardiol 1983; 2: pp. 217-224.
6. Zehender M., Kasper W., Kauder E., et. al.: Right ventricular infarction as an independent predictor of prognosis after acute inferior myocardial infarction. N Engl J Med 1993; 328: pp. 981-988.
7. Juergens K.U., Seifarth H., Range F., et. al.: Automated threshold-based 3D segmentation versus short-axis planimetry for assessment of global left ventricular function with dual-source MDCT. AJR Am J Roentgenol 2008; 190: pp. 308-314.
8. Lin F.Y., Devereux R.B., Roman M.J., et. al.: Cardiac chamber volumes, function, and mass as determined by 64-multidetector row computed tomography: mean values among healthy adults free of hypertension and obesity. JACC Cardiovasc Imaging 2008; 1: pp. 782-786.
9. Abadi S., Roguin A., Engel A., et. al.: Feasibility of automatic assessment of four-chamber cardiac function with MDCT: initial clinical application and validation. Eur J Radiol 2010; 74: pp. 175-181.
10. Coche E., Walker M.J., Zech F., et. al.: Quantitative right and left ventricular functional analysis during gated whole-chest MDCT: a feasibility study comparing automatic segmentation to semi-manual contouring. Eur J Radiol 2010; 74: pp. e138-e143.
11. Plumhans C., Keil S., Ocklenburg C., et. al.: Comparison of manual, semi- and fully automated heart segmentation for assessing global left ventricular function in multidetector computed tomography. Invest radiol 2009; 44: pp. 476-482.
12. Lehnert T., Wrzesniak A., Bernhardt D., et. al.: Fully automated right ventricular volumetry from ECG-gated coronary CT angiography data: evaluation of prototype software. Int J Cardiovasc Imaging 2013; 29: pp. 489-496.
13. Bauer R.W., Kraus B., Bernhardt D., et. al.: Computer-based automated left atrium segmentation and volumetry from ECG-gated coronary CT angiography data: comparison with manual slice segmentation and ultrasound planimetric methods. Rofo 2010; 182: pp. 1110-1117.
14. Ecabert O., Peters J., Walker M.J., et. al.: Segmentation of the heart and great vessels in CT images using a model-based adaptation framework. Med Image Anal 2011; 15: pp. 863-876.
15. Lorenz C., von Berg J.: A comprehensive shape model of the heart. Med Image Anal 2006; 10: pp. 657-670.
16. de Jonge G.J., van der Vleuten P.A., Overbosch J., et. al.: Semi-automatic measurement of left ventricular function on dual source computed tomography using five different software tools in comparison with magnetic resonance imaging. Eur J Radiol 2011; 80: pp. 755-766.
17. de Jonge G.J., van Ooijen P.M., Overbosch J., et. al.: Comparison of (semi-)automatic and manually adjusted measurements of left ventricular function in dual source computed tomography using three different software tools. Int J Cardiovasc Imaging 2011; 27: pp. 787-794.
18. Lang R.M., Bierig M., Devereux R.B., et. al.: Recommendations for chamber quantification: a report from the American Society of Echocardiography’s Guidelines and Standards Committee and the Chamber Quantification Writing Group, developed in conjunction with the European Association of Echocardiography, a branch of the European Society of Cardiology. J Am Soc Echocardiogr 2005; 18: pp. 1440-1463.
19. Mao S.S., Li D., Rosenthal D.G., et. al.: Dual-standard reference values of left ventricular volumetric parameters by multidetector CT angiography. J Cardiovasc Comput Tomogr 2013; 7: pp. 234-240.
20. Budoff M.J., Ahmadi N., Sarraf G., et. al.: Determination of left ventricular mass on cardiac computed tomographic angiography. Acad Radiol 2009; 16: pp. 726-732.
21. Gupta M., Hacioglu Y., Kadakia J., et. al.: Left ventricular volume: an optimal parameter to detect systolic dysfunction on prospectively triggered 64-multidetector row computed tomography: another step towards reducing radiation exposure. Int J Cardiovasc Imaging 2011; 27: pp. 1015-1023.
22. Mahnken A.H., Muhlenbruch G., Koos R., et. al.: Automated vs. manual assessment of left ventricular function in cardiac multidetector row computed tomography: comparison with magnetic resonance imaging. Eur Radiol 2006; 16: pp. 1416-1423.
23. Dulce M.C., Mostbeck G.H., Friese K.K., et. al.: Quantification of the left ventricular volumes and function with cine MR imaging: comparison of geometric models with three-dimensional data. Radiology 1993; 188: pp. 371-376.
24. Zeb I., Li D., Nasir K., et. al.: Computerized left ventricular regional ejection fraction analysis for detection of ischemic coronary artery disease with multidetector CT angiography. Int J Cardiovasc Imaging 2013; 29: pp. 685-692.
25. King D.L., Coffin Lel K., Maurer M.S.: Noncompressibility of myocardium during systole with freehand three-dimensional echocardiography. J Am Soc Echocardiogr 2002; 15: pp. 1503-1506.
26. Rodriguez I., Ennis D.B., Wen H.: Noninvasive measurement of myocardial tissue volume change during systolic contraction and diastolic relaxation in the canine left ventricle. Magn Reson Med 2006; 55: pp. 484-490.
27. Hudsmith L.E., Petersen S.E., Francis J.M., et. al.: Normal human left and right ventricular and left atrial dimensions using steady state free precession magnetic resonance imaging. J Cardiovasc Magn Reson 2005; 7: pp. 775-782.
28. Alfakih K., Plein S., Thiele H., et. al.: Normal human left and right ventricular dimensions for MRI as assessed by turbo gradient echo and steady-state free precession imaging sequences. J Magn Reson Imaging 2003; 17: pp. 323-329.
29. Stolzmann P., Scheffel H., Leschka S., et. al.: Reference values for quantitative left ventricular and left atrial measurements in cardiac computed tomography. Eur Radiol 2008; 18: pp. 1625-1634.
30. Tamborini G., Marsan N.A., Gripari P., et. al.: Reference values for right ventricular volumes and ejection fraction with real-time three-dimensional echocardiography: evaluation in a large series of normal subjects. J Am Soc Echocardiogr 2010; 23: pp. 109-115.
31. Puesken M., Fischbach R., Wenker M., et. al.: Global left-ventricular function assessment using dual-source multidetector CT: effect of improved temporal resolution on ventricular volume measurement. Eur Radiol 2008; 18: pp. 2087-2094.