
Rationale and Objectives
A method for the automatic detection and the visualization of erosions caused by rheumatoid arthritis is investigated. Erosion-enhanced viewing is a contribution to the computer-aided diagnosis of rheumatoid arthritis. It supports the clinician by providing the automatic marking of erosions and the visualization of any deviations from intact anatomy for a concise reviewing interface.
Materials and Methods
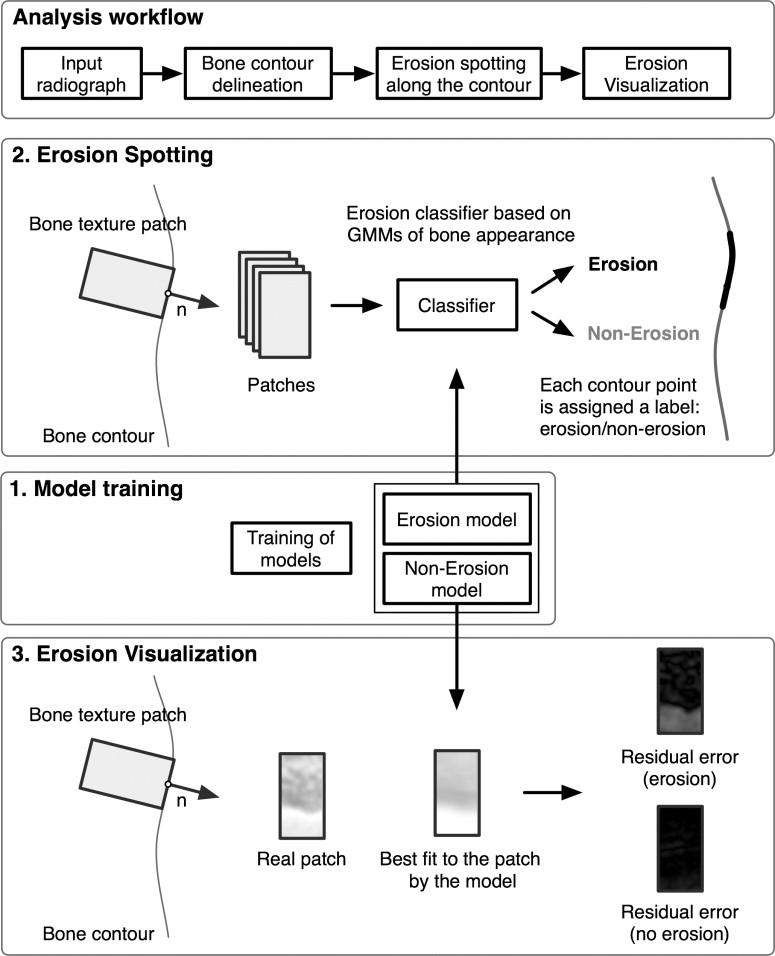
A generative appearance model is used to capture the variability of intact bone and erosions. The algorithm marks erosions on hand radiographs using this model, and visualizes these erosions with the help of the residual appearance error after fitting the model built from intact bone texture. The algorithm was evaluated on 17 hand radiographs. The standard of reference was an annotation of the erosions by a musculoskeletal radiologist.
Results
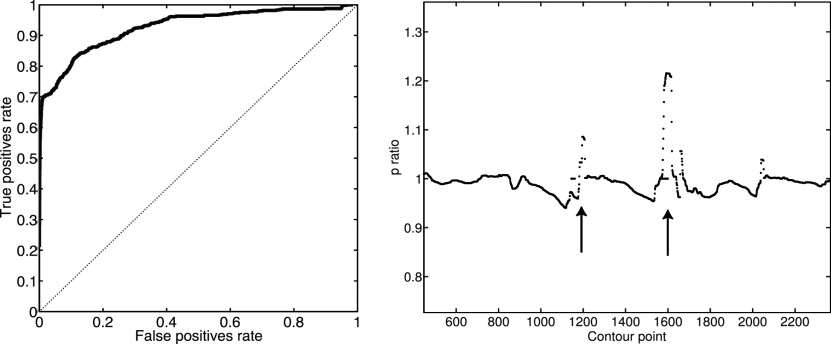
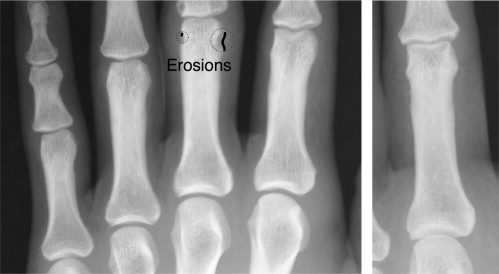
Detection results from the algorithm are reported for a set of 17 radiographs of moderately diseased hands. With a specificity of 84%, the detection of unequivocal erosions achieved a sensitivity of 85%. A receiver operating characteristic analysis yields an area under the curve of 0.92. The visualization provided a clear representation of the erosions as determined by two musculoskeletal radiologists.
Conclusion
The automatic spotting of erosions provides promising results, and the visualization of the deviation from healthy anatomy aids clinicians in the evaluation of the erosions and in the reviewing of automatic detection results.
Rheumatoid arthritis (RA) is a chronic disease that affects primarily the synovial membranes and articular structures of multiple, mainly peripheral, joints. The disease is progressive and results in pain, stiffness, and swelling of joints, which can show deformity and ankylosis. A recurring inflammation of the affected joints (ie, arthritis) leads to a degradation of cartilage and bone erosions. This affects physical function and mobility, causes substantial short-term and long-term morbidity and results in a significantly shorter life expectancy compared with that of the general population.
The key radiographic findings of RA are erosions and joint space narrowing in the wrist and metacarpophalangeal joints. Erosions and joint space narrowing are important for the differentiation and the quantification of the disease ( ). Their precise quantification is a decisive factor for the treatment with aggressive treatment strategies (eg, methotrexate) or with biologic agents, such as anti–tumor necrosis factor alpha drugs. Furthermore, the anti-inflammatory effects of different agents, which retard the radiographic progression of the disease, as determined radiographically, must be compared in clinical trials. This makes a reproducible and accurate quantification of disease progression mandatory. Radiography is used as the standard modality to monitor the long-term progression of RA. Its negligible radiation dose and the standardized acquisition procedures have made the use of the scoring of joint space narrowing and erosions as imaging biomarkers for the monitoring of the disease during treatment and in clinical trials possible.
Get Radiology Tree app to read full this article<
Get Radiology Tree app to read full this article<
Get Radiology Tree app to read full this article<
Get Radiology Tree app to read full this article<
Materials and methods
Get Radiology Tree app to read full this article<
Locating Bone Contours
Get Radiology Tree app to read full this article<
Get Radiology Tree app to read full this article<
sk=s¯+∑npj=1ajej s
k
=
s
¯
+
∑
j
=
1
n
p
a
j
e
j
is created. The modes e j are the eigenvectors of the covariance matrix sorted according to decreasing eigenvalue λ j . s¯ s
¯ is the mean shape and n p can be chosen to fulfill a given accuracy constraint. n p was chosen so that 95% of the training set variability are represented by the model. The eigenvalues λ j correspond to the variance of the data in the direction e j . It can be viewed as a mean shape of an object and a set of valid deformations that, if applied, generate new instances of shapes because the model constraint these shapes remain in the learned class of objects. The local texture information at the landmark positions is extracted in the form of gray-level profiles orthogonal to the contour. ASMs are described in detail elsewhere ( ).
Get Radiology Tree app to read full this article<
Get Radiology Tree app to read full this article<
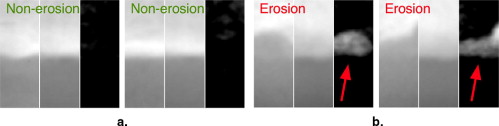
Extracting Local Bone Appearance
Get Radiology Tree app to read full this article<
Get Radiology Tree app to read full this article<
Modeling Appearance
Get Radiology Tree app to read full this article<
p(p|)=∑Nj=1αjN(p∣∣μj,Σj),andhence=(μ1,Σ1,…,μNΣN) p
(
p
|
)
=
∑
j
=
1
N
α
j
N
(
p
|
μ
j
,
Σ
j
)
,
and
hence
=
(
μ
1
,
Σ
1
,
…
,
μ
N
Σ
N
)
where p is an observed patch extracted from the bone contour as described previously. For each Gaussian distribution, μ j is the mean vector or center and Σ j is the full covariance matrix. Both define the probability density function. The ordered set of μ j and Σ j defines the GMM and will be denoted by θ . These parameters are derived from the training data by the EM algorithm ( ).
Get Radiology Tree app to read full this article<
Get Radiology Tree app to read full this article<
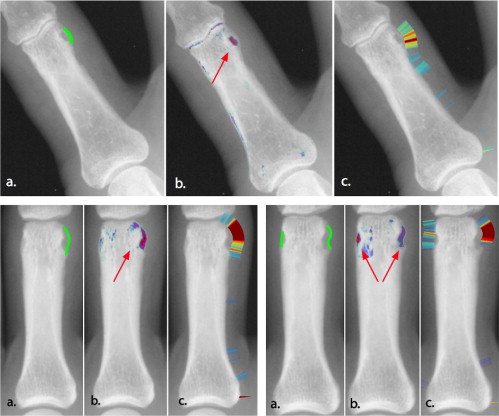
Detection of Erosions
Get Radiology Tree app to read full this article<
l(pi)={Erosion,p(ERO)p(pi|ERO)>p(NONERO)p(pi|NONERO)Non Erosion, otherwise l
(
p
i
)
=
{
Erosion
,
p
(
E
R
O
)
p
(
p
i
|
E
R
O
)
p
(
N
O
N
E
R
O
)
p
(
p
i
|
N
O
N
E
R
O
)
Non Erosion, otherwise
where l (p i ) is a label assigned to each point on the bone contour stating whether it belongs to an erosion or not. p ( θ ERO ) (where p ( θ NONERO ) + p ( θ ERO ) = 1) is the prior probability for an erosion to occur. It is estimated from the training set. The receiver operator characteristic curve in Fig 3 is reported with regard to the parameter p ( θ ERO ), i.e., p ( θ ERO ) was varied from 0 (no patch is classified as erosion) to 1 (all patches are classified as erosion). The resulting label l ( p i ) is an indicator for the presence of erosions on each bone contour point. It can be used to quantify the extent of the erosion directly. Moreover, the label is visualized in the radiograph to provide the radiologist with the possibility to verify the detected erosions.
Get Radiology Tree app to read full this article<
Visualization of Erosions
Get Radiology Tree app to read full this article<
Setup of the Evaluation
Get Radiology Tree app to read full this article<
Results
Get Radiology Tree app to read full this article<
Get Radiology Tree app to read full this article<
Discussion
Get Radiology Tree app to read full this article<
Get Radiology Tree app to read full this article<
Get Radiology Tree app to read full this article<
Conclusion
Get Radiology Tree app to read full this article<
Get Radiology Tree app to read full this article<
Get Radiology Tree app to read full this article<
References
1. Angwin A., Lloyd A., Heald G., et. al.: Radiographic hand joint space width assessed by computer is a sensitive measure of change in early rheumatoid arthritis. J Rheumatol 2004; 31: pp. 1062-1072.
2. Bresnihan B., Newmark R., Robbins S., et. al.: Effects of anakinra monotherapy on joint damage in patients with RA. J Rheumatol 2004; 31: pp. 1103-1111.
3. Bishop C.M.: Neural networks for pattern recognition.1995.Oxford University Press
4. Brejl M., Sonka M.: Object localization and border detection criteria design in edge-based image segmentation: automated learning from examples. IEEE Trans Med Imaging 2000; 19: pp. 973-985.
5. Cootes T.F., Hill A., Taylor C.J., et. al.: The use of active shape models for locating structures in medical images. Image Vis Comp 1994; 12: pp. 355-366.
6. Cootes T.F., Taylor C.: Statistical models of appearance for computer vision, technical report.2004.Department for Imaging Science and Biomedical EngineeringUniversity of Manchester, UK
7. Cootes T.F., Taylor C.J., Cooper D.H., et. al.: Training models of shape from sets of examples. Proc BMVC 1992; pp. 266-275.
8. Davies R.H., Twining C.J., Cootes T.F., et. al.: A minimum description length approach to statistical shape modeling. IEEE TMI 2002; 21: pp. 525-537.
9. Dihlmann W.: Die Gelenksilhouette, Präerosion, Erosion und ihre Kollaborateure: Die arthritischen Direktzeichen und ihre Differentialdiagnose.1995.SpringerBerlin
10. Duryea J., Grainger A.J., Hide I.G., et. al.: Fully automated software to monitor wear in prosthetic knees using fluoroscopic images. Eur Radiol 2001; 11: pp. 2184-2187.
11. Duryea J., Jiang Y., Zakharevich M., et. al.: Neural network based algorithm to quantify joint space width in joints of the hand for arthritis assessment. Med Phys 2000; 27: pp. 1185-1194.
12. Genant H.K., Jiang Y., Peterfy C., et. al.: Assessment of rheumatoid arthritis using a modified scoring method on digitized and original radiographs. Arthritis Rheum 1998; 41: pp. 1583-1590.
13. Kainberger F., Peloschek P., Langs G., et. al.: Differential diagnosis of rheumatic diseases using conventional radiography. Best Practice Res Clin Rheumatol 2004; 18: pp. 783-811.
14. Kass M., Witkin A., Terzopoulos D.: Snakes: active contour models. Int J Computer Vision 1988; 1: pp. 321-331.
15. Keystone E.C., Kavanaugh A.F., Sharp J.T., et. al.: Radiographic, clinical, and functional outcomes of treatment with adalimumab (a human anti-tumor necrosis factor monoclonal antibody) in patients with active rheumatoid arthritis receiving concomitant methotrexate therapy: a randomized, placebo-controlled, 52-week trial. Arthritis Rheum 2004; 50: pp. 1400-1411.
16. Langs G., Peloschek P., Bischof H.: driven snakes in rheumatoid arthritis assessment.2003.pp. 454-461.
17. Larsen A., Dale K., Eek M.: Radiographic evaluation of rheumatoid arthritis and related conditions by standard reference films. Acta Radiol Diagn 1977; 18: pp. 481-491.
18. Mang T, Peloschek P, Plank C, et al. Effect of computer-aided detection as a second reader in multidetector-row ct colonography. Eur Radiol March 2007 [epub ahead of print].
19. Peloschek PL, Langs G, Weber M, et al. An automatic model-based system for joint space measurements on hand radiographs—initial experience. Radiology. In press.
20. Rubin G.D., Lyo J.K., Paik D.S., et. al.: Pulmonary nodules on multi-detector row CT scans: performance comparison of radiologists and computer-aided detection. Radiology 2005; 234: pp. 274-283.
21. Sailer J., Scharitzer M., Peloschekand P., et. al.: Quantification of axial alignment of the lower extremity on conventional and digital total leg radiographs. Eur Radiol 2005; 15: pp. 170-173.
22. Schmidt J.E., Amrami K.K., Manduca A., et. al.: Semi-automated digital image analysis of joint space width in knee radiographs. Skeletal Radiol 2005; 34: pp. 639-643.
23. Sharp J.T., Gardner J.C., Bennett E.M.: Computer-based methods for measuring joint space and estimating erosion volume in the finger and wrist joints of patients with rheumatoid arthritis. Arthritis Rheum 2000; 43: pp. 1378-1386.
24. Sharp J.T., Lidsky M.D., Collins L.C., et. al.: Methods of scoring the progression of radiologic changes in rheumatoid arthritis. Arthritis Rheum 1971; 14: pp. 706-720.
25. Sharp J.T., Wolfe F., Lassere M., et. al.: Variability of precision in scoring radiographic abnormalities in rheumatoid arthritis by experienced readers. J Rheumatol 2004; 31: pp. 1062-1072.
26. van Der Heijde D., Boonen A., Boers M., et. al.: Reading radiographs in chronological order, in pairs or as single films has important implications for the discriminative power of rheumatoid arthritis clinical trials. Rheumatology 1999; 38: pp. 1213-1220.