
Rationale and Objectives
To prospectively evaluate the perceived image quality of model-based iterative reconstruction (MBIR) compared to adaptive statistical iterative reconstruction (ASIR) and filtered back-projection (FBP) in computed tomography (CT) of the kidneys and retroperitoneum.
Materials and Methods
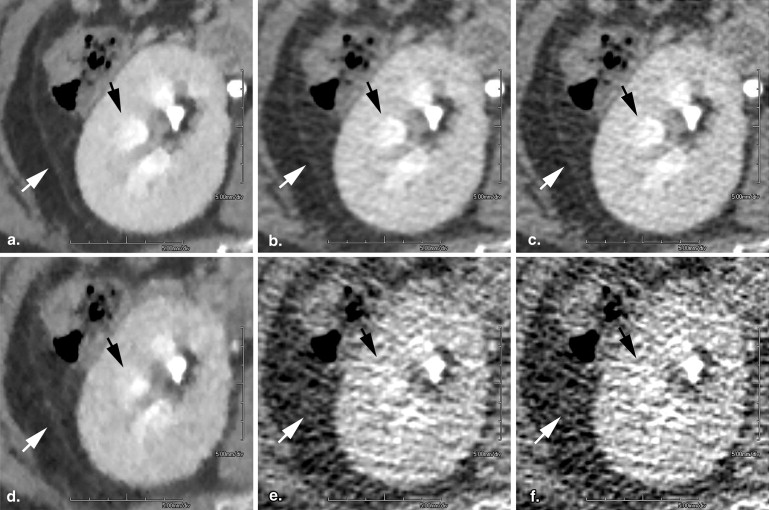
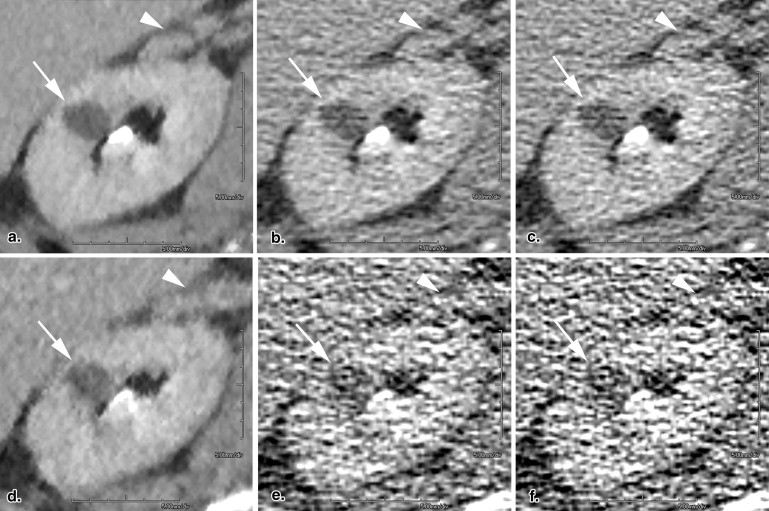
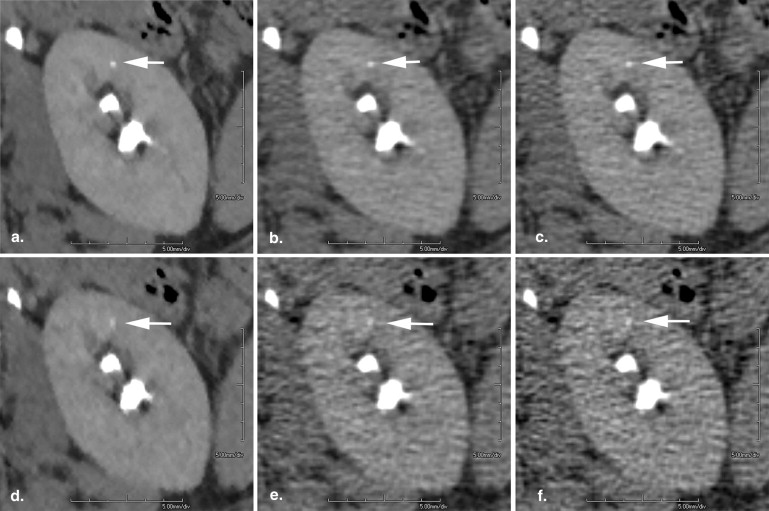
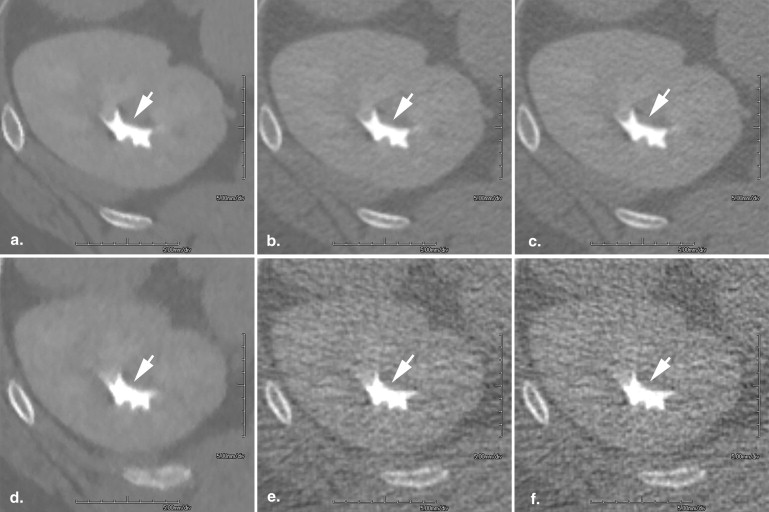
With investigational review board and Health Insurance Portability and Accountability Act compliance, 17 adults underwent 31 contrast-enhanced CT acquisitions at constant tube potential and current (range 30–300 mA). Each was reconstructed with MBIR, ASIR (50%), and FBP. Four reviewers scored each reconstruction’s perceived image quality overall and the perceived image quality of seven imaging features that were selected by the authors as being relevant to imaging in the region and pertinent to the evaluation of high-quality diagnostic CT.
Results
MBIR perceived image quality scored superior to ASIR and FBP both overall ( P < .001) and for observations of the retroperitoneal fascia (99.2%), corticomedullary differentiation (94.4%), renal hilar structures (96.8%), focal renal lesions (92.5%), and mitigation of streak artifact (100.0%; all, P < .001). MBIR achieved diagnostic overall perceived image quality with approximately half the radiation dose required by ASIR and FBP. The noise curve of MBIR was significantly lower and flatter ( P < .001).
Conclusions
Compared to ASIR and FBP, MBIR provides superior perceived image quality, both overall and for several specific imaging features, across a broad range of tube current levels, and requires approximately half the radiation dose to achieve diagnostic overall perceived image quality. Accordingly, MBIR should enable CT scanning with improved perceived image quality and/or reduced radiation exposure.
Iterative image reconstruction algorithms, such as the original algebraic reconstruction technique, (ART) were used in the early days of transmission computed tomography (CT) but were quickly superseded by much faster analytical methods such as filtered back-projection (FBP) . Significant disadvantages exist with FBP, however, including its assumption that data are exact when in reality they are not, and the operation of the FBP filter which typically amplifies noise in the projection data. Iterative techniques, in contrast, can include models of features such as noise that improve the image during each iteration. This produces much better image quality than FBP does, when the signal-to-noise ratio is low, although this occurs at the expense of substantially increased computation time .
Owing to substantial increases in computational power, iterative image reconstruction algorithms have recently re-emerged and are now available on commercial CT scanners manufactured by all major vendors . The recent literature appears to confirm the expected dose saving potential of modern implementations of iterative reconstruction algorithms ; however, the relationship between radiation dose, noise, and image quality over a broad dose range, rather than at just a pair of dose levels, is not well established.
Get Radiology Tree app to read full this article<
Materials and methods
Study Population
Get Radiology Tree app to read full this article<
Scanning Technique and Image Reconstruction
Get Radiology Tree app to read full this article<
Get Radiology Tree app to read full this article<
Table 1
Scanning Parameters and Relative Doses in 17 Patients
Number of Patients Total Scans First CT Acquisition Second CT Acquisition Tube Current (mA) Individual CTDI vol (mGy) Fraction of Total CTDI vol (%) Tube Current (mA) Individual CTDI vol (mGy) Fraction of Total CTDI vol (%) 3 3 300 14 100 — — — 3 6 270 12.6 90 30 1.4 10 3 6 255 11.9 85 45 2.1 15 2 ∗ 4 ∗ 225 10.5 75 75 3.5 25 3 6 195 9.1 65 105 4.9 35 3 6 165 7.7 55 135 6.3 45
ASIR, adaptive statistical iterative reconstruction; CT, computed tomography; FBP, filtered back-projection; MBIR, model-based iterative reconstruction; CTDI vol , volume computed tomography dose index.
Get Radiology Tree app to read full this article<
Get Radiology Tree app to read full this article<
Get Radiology Tree app to read full this article<
Image Review
Get Radiology Tree app to read full this article<
Individual imaging features
Get Radiology Tree app to read full this article<
Overall perceived image quality
Get Radiology Tree app to read full this article<
Image noise
Get Radiology Tree app to read full this article<
Statistical Analysis
Individual imaging features
Get Radiology Tree app to read full this article<
Overall perceived image quality
Get Radiology Tree app to read full this article<
![Figure 5, Graph showing nonlinear least-squares regression relating tube current (mA) and mean perceived image quality scores for reconstructions performed with MBIR, ASIR, and FBP. Curves describe a Gompertz function of the form “Image quality = b1 × exp (−exp [−b2 × {dose − b3}])”. Vertical bars correspond to + and − one standard error from the mean image quality score at each milliampere value. ASIR, adaptive statistical iterative reconstruction; FBP, filtered back-projection; MBIR, model-based iterative reconstruction.](https://storage.googleapis.com/dl.dentistrykey.com/clinical/ModelbasedIterativeReconstructionComparedtoAdaptiveStatisticalIterativeReconstructionandFilteredBackprojectioninCToftheKidneysandtheAdjacentRetroperitoneum/4_1s20S1076633214000919.jpg)
Get Radiology Tree app to read full this article<
Image noise
Get Radiology Tree app to read full this article<
Get Radiology Tree app to read full this article<
Investigational Approval
Get Radiology Tree app to read full this article<
Results
Individual Imaging Features
Get Radiology Tree app to read full this article<
Table 2
Observations of Individual Imaging Features in Which MBIR was Rated Superior to Both ASIR and FBP
Imaging Feature Percentage of Observations in Which MBIR was Rated Superior Percentage of Observations in Which MBIR was Rated Superior, Stratified by Tube Current (mA) and CTDI vol (mGy) Very Low Dose
30–105 mA
1.4–4.9 mGy Low Dose
135–225 mA
6.3–10.5 mGy Standard Dose 255–300 mA 11.9–14.0 mGy Retroperitoneal fascia 99.2% (123/124) 100.0% (44/44) 97.7% (43/44) 100.0% (36/36) Corticomedullary differentiation 94.4% (117/124) 97.7% (43/44) 93.2% (41/44) 91.7% (33/36) Hilar structures 96.8% (120/124) 100.0% (44/44) 95.5% (42/44) 94.4% (34/36) Lesions 92.5% (74/80) 100.0% (32/32) 91.7% (22/24) 83.3% (20/24)
P = .002 Mitigation of streak artifact 100.0% (124/124) 100.0% (44/44) 100.0% (44/44) 100.0% (36/36) Intrarenal collecting system 23.4% (29/124) 56.8% (25/44)
P = .451 6.8% (3/44) 2.8% (1/36) Calculi 6.3% (5/8)
P = .727 100.0% (4/4)
P = .125 25.0% (1/4)
P = .625 —
ASIR, adaptive statistical iterative reconstruction; FBP, filtered back-projection; MBIR, model-based iterative reconstruction; CTDI vol , volume computed tomography dose index.
Numerators indicate observations in which MBIR was rated superior to both ASIR and FBP; denominators indicate the total number of observations. Significance is assessed with the exact binomial test.
All P values <.001 unless otherwise indicated.
Table 3
Demographics in 17 Patients Stratified by Tube Current and CTDI vol
Stratification by Tube Current (mA) and CTDI vol (mGy) Very Low Dose
30–105 mA
1.4–4.9 mGy Low Dose
135–225 mA
6.3–10.5 mGy Standard Dose
255–300 mA
11.9–14.0 mGy Acquisitions 11 11 9 Male/female 6/5 7/4 5/4 Mean age (year) 47.7 48.6 45.8 Mean abdominal diameter (cm) ∗ 28.8 27.3 28.7
Get Radiology Tree app to read full this article<
Get Radiology Tree app to read full this article<
Get Radiology Tree app to read full this article<
Get Radiology Tree app to read full this article<
Overall Perceived Image Quality
Get Radiology Tree app to read full this article<
Imagequality=b1×exp(−exp[−b2×{mA−b3}]) Image
quality
=
b
1
×
exp
(
−
exp
[
−
b
2
×
{
mA
−
b
3
}
]
)
where b1, b2, and b3 are parameters with estimated values and 95% CIs as displayed in Table 4 . Parameters b1 and b3 were significantly different for MBIR compared to those for ASIR and FBP (both with P < .001), whereas parameter b2 did not differ significantly ( P = .132 and .650, respectively).
Table 4
Mean Overall Image Quality Score for the Kidneys and Retroperitoneum as a Function of Tube Current (mA) in Nonlinear Least-squares Regression on the Form “Image quality = b1 × exp (−exp [−b2 × {dose − b3}])”
Algorithm b1 b2 b3 RMSE Value (95% CI) Value (95% CI) Value (95% CI) MBIR 3.18 (2.93–3.43) 0.012 (0.007–0.016) 37.82 (28.97–46.67) 0.53 ASIR 2.22 (1.93–2.52) 0.015 (0.008–0.021) 84.47 (84.47–106.48) 0.46 FBP 2.23 (1.87–2.60) 0.013 (0.007–0.018) 102.08 (71.70–132.46) 0.58 MBIR versus ASIR_P_ < .001P = .132P < .001 MBIR versus FBP_P_ < .001P = .650P < .001
ASIR, adaptive statistical iterative reconstruction; CI, confidence interval; FBP, filtered back-projection; MBIR, model-based iterative reconstruction; RMSE, root-mean-square error.
Get Radiology Tree app to read full this article<
Get Radiology Tree app to read full this article<
Get Radiology Tree app to read full this article<
Table 5
Pairwise Reader Agreement (Linearly Weighted Kappa and 95% CI) for Overall Image Quality Scores of the Kidneys and Adjacent Retroperitoneum ( N = 93)
Reader Reader 1 Reader 2 Reader 3 Reader 4 Reader 1 — Reader 2 0.78 (0.69–0.86) — Reader 3 0.38 (0.28–0.48) 0.37 (0.27–0.46) — Reader 4 0.65 (0.53–0.76) 0.57 (0.44–0.69) 0.63 (0.52–0.72) —
Confidence intervals (CIs) based on 1000 bootstrap replications.
Get Radiology Tree app to read full this article<
Get Radiology Tree app to read full this article<
Table 6
Minimum Tube Current and CTDI vol Levels at Which all Readers Returned Specified Overall Image Quality Scores
Algorithm Overall Image Quality Score 1 = Minimally Diagnostic
Tube Current (CTDI vol ) 2 = Diagnostic
Tube Current (CTDI vol ) 3 = Superior
Tube Current (CTDI vol ) ASIR 135 mA (6.3 mGy) 270 mA (12.6 mGy) Not achieved FBP 135 mA (6.3 mGy) 270 mA (12.6 mGy) Not achieved MBIR 75 mA (3.5 mGy) 135 mA (6.3 mGy) 270 mA (112.6 mGy)
ASIR, adaptive statistical iterative reconstruction; FBP, filtered back-projection; MBIR, model-based iterative reconstruction; CTDI vol , volume computed tomography dose index.
Get Radiology Tree app to read full this article<
Image Noise
Get Radiology Tree app to read full this article<
Noise=b0×(mA)ˆb1 Noise
=
b
0
×
(
mA
)
ˆ
b
1
where b0 and b1 are parameters whose estimated values and 95% CIs are shown in Table 7 . Both parameters b0 and b1 differed significantly between MBIR and ASIR and between MBIR and FBP (b0: P = .011 and .006, respectively; b1: P < .001 in both cases). Image noise for ASIR and FBP rose with decreasing milliamperes at a rate proportional to nearly the traditionally expected rate of (mA) −0.5 as evidenced by their b1 values of −0.53 and −0.51, respectively. In contrast, noise for MBIR rose with decreasing milliamperes at a much slower rate, with b1 = −0.22.
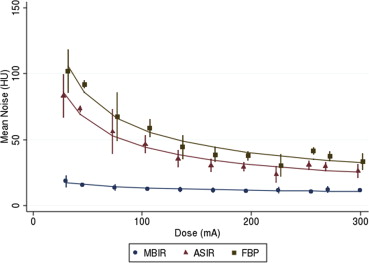
Table 7
Noise as a Function of Tube Current (mA) in Nonlinear Least-squares Regression on the Form “Noise = b0 x (mA)bˆ1”
Algorithm b0 b1 RMSE Value (95% CI) Value (95% CI) MBIR 36.69 (12.96–60.43) −0.22 (−0.34 to −0.10) 3.05 ASIR 529.31 (127.56–931.27) −0.53 (−0.69 to −0.38) 10.98 FBP 609.30 (229.33–989.26) −0.51 (−0.65 to −0.38) 12.20 MBIR versus ASIR_P_ = .011P < .001 MBIR versus FBP_P_ = .002P < .001
ASIR, adaptive statistical iterative reconstruction; CI, confidence interval; FBP, filtered back-projection; MBIR, model-based iterative reconstruction; RMSE, root-mean-square error.
Get Radiology Tree app to read full this article<
Discussion
Get Radiology Tree app to read full this article<
Get Radiology Tree app to read full this article<
Get Radiology Tree app to read full this article<
Get Radiology Tree app to read full this article<
Get Radiology Tree app to read full this article<
Get Radiology Tree app to read full this article<
Get Radiology Tree app to read full this article<
Get Radiology Tree app to read full this article<
Get Radiology Tree app to read full this article<
Get Radiology Tree app to read full this article<
Acknowledgments
Get Radiology Tree app to read full this article<
References
1. Ambrose J., Hounsfield G.: Computerized transverse axial tomography. Br J Radiol 1973; 46: pp. 148-149.
2. Hounsfield G.N.: Computerized transverse axial scanning (tomography). Part 1. Description of system. Br J Radiol 1973; 46: pp. 1016-1022.
3. Shepp L.A., Logan B.F.: The fourier reconstruciton of a head section. IEEE Trans Nucl Sci 1974; NS21: pp. 21-24.
4. Thibault J.-B., Sauer K.D., Bouman C.A., et. al.: A three-dimensional statistical approach to improved image quality for multislice helical CT. Medical Physics 2007; 34: pp. 4526.
5. Rockmore A.J., Macovski A.: A maximum likelihood approach to transmission image reconstruction from projections. IEEE Transactions 1977; 24: pp. 1929-1935.
6. Fleischmann D., Boas F.E.: Computed tomography—old ideas and new technology. Eur Radiol 2011; 21: pp. 510-517.
7. Leipsic J., Nguyen G., Brown J., et. al.: A prospective evaluation of dose reduction and image quality in chest CT using adaptive statistical iterative reconstruction. AJR Am J Roentgenol 2010; 195: pp. 1095-1099.
8. Marin D., Nelson R.C., Schindera S.T., et. al.: Low-tube-voltage, high-tube-current multidetector abdominal CT: improved image quality and decreased radiation dose with adaptive statistical iterative reconstruction algorithm—initial clinical experience. Radiology 2010; 254: pp. 145-153.
9. Prakash P., Kalra M.K., Digumarthy S.R., et. al.: Radiation dose reduction with chest computed tomography using adaptive statistical iterative reconstruction technique: initial experience. J Comput Assist Tomogr 2010; 34: pp. 40-45.
10. Sagara Y., Hara A.K., Pavlicek W., et. al.: Comparison of low-dose CT with adaptive statistical iterative reconstruction and routine-dose CT with filtered back projection in 53 patients. AJR Am J Roentgenol 2010; 195: pp. 713-719.
11. Korn A., Fenchel M., Bender B., et. al.: Iterative reconstruction in head CT: image quality of routine and low-dose protocols in comparison with standard filtered back-projection. AJNR Am J Neuroradiol 2012; 33: pp. 218-224.
12. May M.S., Wust W., Brand M., et. al.: Dose reduction in abdominal computed tomography intraindividual comparison of image quality of full-dose standard and half-dose iterative reconstructions with dual-source computed tomography. Investigative Radiology 2011; 46: pp. 465-470.
13. Pontana F., Duhamel A., Pagniez J., et. al.: Chest computed tomography using iterative reconstruction vs filtered back projection (Part 2): image quality of low-dose CT examinations in 80 patients. Eur Radiol 2011; 21: pp. 636-643.
14. Singh S., Kalra M.K., Hsieh J., et. al.: Abdominal CT: comparison of adaptive statistical iterative and filtered back projection reconstruction techniques. Radiology 2010; 257: pp. 373-383.
15. Sodickson A.: Strategies for reducing radiation exposure in multi-detector row CT. Radiol Clin North Am 2012; 50: pp. 1-14.
16. Yadava G, Kulkarni S, Rodriguez Colon Z, Thibault J, Hsieh J. TU-A-201B-03: Dose reduction and image quality benefits using model based iterative reconstruction (MBIR) technique for computed tomography. City: American Association of Physicists in Medicine; 2010; 3372.
17. Silva A.C., Lawder H.J., Hara A., et. al.: Innovations in CT dose reduction strategy: application of the adaptive statistical iterative reconstruction algorithm. AJR Am J Roentgenol 2010; 194: pp. 191-199.
18. McNitt-Gray M.F.: AAPM/RSNA physics tutorial for residents: topics in CT. Radiation dose in CT. Radiographics 2002; 22: pp. 1541-1553.
19. Zellner A.: An efficient method of estimating seemingly unrelated regressions and tests for aggregation bias. Journal of the American Statistical Association 1962; 57: pp. 348-368.
20. Brenner D.J.: Slowing the increase in the population dose resulting from CT scans. Radiation Research 2010; 174: pp. 809-815.
21. Brenner D.J., Hall E.J.: Computed tomography—an increasing source of radiation exposure. New Engl J Med 2007; 357: pp. 2277-2284.
22. Hall E.J., Brenner D.J.: Cancer risks from diagnostic radiology. Br J Radiol 2008; 81: pp. 362-378.
23. Hu X.H., Ding X.F., Zhang F.F.: Radiation dose of non-enhanced chest CT can be reduced 40% by using iterative reconstruction in image space. Clinical Radiology 2011; 66: pp. 1023-1029.
24. Huda W., Schoepf U.J., Abro J.A., et. al.: Radiation-related cancer risks in a clinical patient population undergoing cardiac CT. AJR Am J Roentgenol 2011; 196: pp. W159-W165.
25. Mahesh M.: NCRP report number 160: its significance to medical imaging. J Am Coll of Radiology 2009; 6: pp. 890-892.
26. Stein E.G., Haramati L.B., Bellin E., et. al.: Radiation exposure from medical imaging in patients with chronic and recurrent conditions. J Am Coll Radiol 2010; 7: pp. 351-359.