
Rationale and Objectives
Dynamic positron emission tomographic imaging of the radiotracer 2-deoxy-2-[ 18 F]fluoro- d -glucose ( 18 F-FDG) is increasingly used to assess metabolic activity of lung inflammatory cells. To analyze the kinetics of 18 F-FDG in brain and tumor tissues, the Sokoloff model has been typically used. In the lungs, however, a high blood-to-parenchymal volume ratio and 18 F-FDG distribution in edematous injured tissue could require a modified model to properly describe 18 F-FDG kinetics.
Materials and Methods
We developed and validated a new model of lung 18 F-FDG kinetics that includes an extravascular/noncellular compartment in addition to blood and 18 F-FDG precursor pools for phosphorylation. Parameters obtained from this model were compared with those obtained using the Sokoloff model. We analyzed dynamic PET data from 15 sheep with smoke or ventilator-induced lung injury.
Results
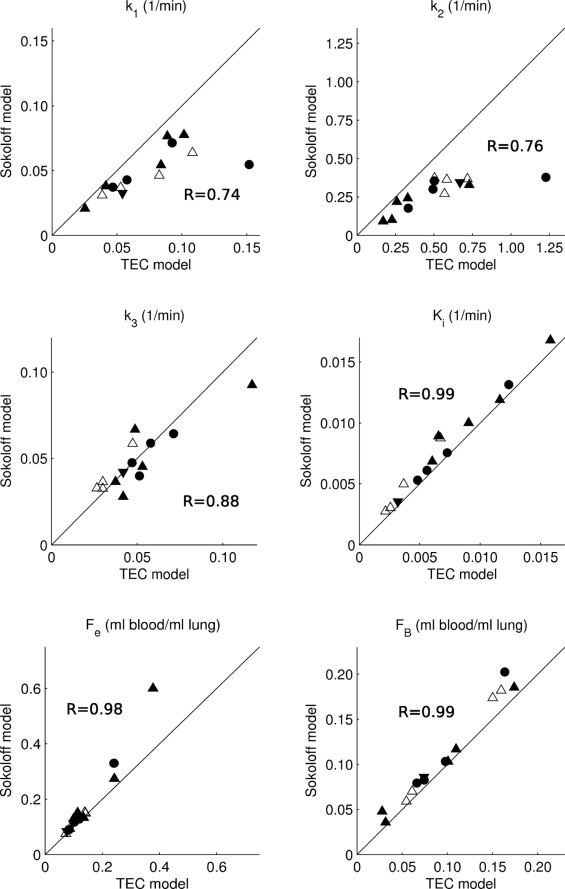
In the majority of injured lungs, the new model provided better fit to the data than the Sokoloff model. Rate of pulmonary 18 F-FDG net uptake and distribution volume in the precursor pool for phosphorylation correlated between the two models ( R 2 = 0.98, 0.78), but were overestimated with the Sokoloff model by 17% ( P < .05) and 16% ( P < .0005) compared to the new one. The range of the extravascular/noncellular 18 F-FDG distribution volumes was up to 13% and 49% of lung tissue volume in smoke- and ventilator-induced lung injury, respectively.
Conclusion
The lung-specific model predicted 18 F-FDG kinetics during acute lung injury more accurately than the Sokoloff model and may provide new insights in the pathophysiology of lung injury.
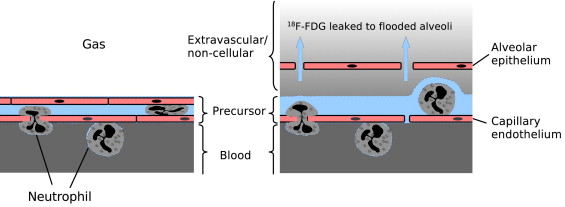
In basic science and clinical investigation of lung pathology, there is a growing interest in new pulmonary imaging techniques ( ). Recently, positron emission tomographic (PET) imaging of the glucose analog 2-deoxy-2-[ 18 F]fluoro- d -glucose ( 18 F-FDG), a standard tool in oncology, is increasingly used to assess metabolic activity of pulmonary inflammatory cells ( ). Such measurement is based on the fact that 18 F-FDG is phosphorylated and trapped in activated pulmonary neutrophils in proportion to the cells’ glucose uptake, which is much higher than that of lung parenchyma. There is, however, no consensus about a standard method to quantitatively analyze 18 F-FDG kinetics in the inflamed lung. Some investigators ( ) calculated a lung net uptake rate of 18 F-FDG ( K i ) using the Patlak method ( ) and normalized K i by the initial tracer distribution volume ( ) or by the tissue fraction ( ) to account for regional differences in lung density. Other investigators ( ) considered tracer kinetic modeling with Sokoloff’s three-compartment model ( ) as the gold standard for analyzing lung 18 F-FDG kinetics. Compared to the Patlak method, compartmental modeling has the advantage that it provides rate constants for tracer transfer among the model compartments, quantifying individual steps in the glucose metabolic pathway. However, the Sokoloff model was developed and validated for 18 F-FDG kinetics in solid tissues such as brain, tumors, and myocardium ( ). An assumption of this model is that all extravascular 18 F-FDG in the region of interest is the precursor pool for hexokinase-catalyzed phosphorylation to 18 F-FDG-6-phosphate ( 18 F-FDG-6-P). This assumption, however, could be inaccurate for acutely injured lungs where large pools of edematous tissue may be functionally far away from neutrophils that trap 18 F-FDG. In these conditions, it could be necessary to model pulmonary tracer kinetics by a compartment model specifically designed to reflect lung 18 F-FDG kinetics during acute lung injury (ALI). Also, previous investigators ( ) have used iterative nonlinear curve fitting to determine the individual rate constants of the Sokoloff model. This technique entails initialization of the parameter vector ( ), which may lead to incorrect solutions when the initial guess is not appropriate ( ). This may be problematic for modeling pulmonary 18 F-FDG, because little is known about typical values of the model parameters.
Here, we formulate a model of lung 18 F-FDG kinetics that includes an extravascular/noncellular compartment in addition to blood and parenchyma, representing a pool of 18 F-FDG that is not a direct precursor for phosphorylation. We analyze previously obtained experimental PET imaging data from sheep with smoke inhalation ( ) or ventilator-induced ALI ( ) and compare the Sokoloff model against the new lung-specific model in their ability to characterize the pulmonary 18 F-FDG kinetics. Also, we utilize a generalized linear least squares (GLSQ) method ( ) to identify the models’ parameters instead of the iterative nonlinear curve fitting typically used for this purpose.
Methods
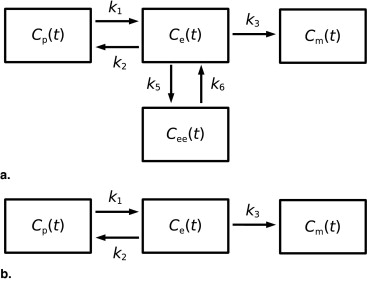
Model of Lung 18 F-FDG Kinetics During Acute Lung Injury: Two Equilibrating Compartment (TEC) Model
Get Radiology Tree app to read full this article<
CROI(t)=FBCp(t)+Ce(t)+Cee(t)+Cm(t) C
ROI
(
t
)
=
F
B
C
p
(
t
)
+
C
e
(
t
)
+
C
ee
(
t
)
+
C
m
(
t
)
Get Radiology Tree app to read full this article<
Get Radiology Tree app to read full this article<
Get Radiology Tree app to read full this article<
C…ROI(t)=a1C¨ROI(t)+a2C˙ROI(t)+a3C…p(t)+…………a4C¨p(t)+a5C˙p(t)+a6Cp(t) C
⃛
ROI
(
t
)
=
a
1
C
¨
ROI
(
t
)
+
a
2
C
˙
ROI
(
t
)
+
a
3
C
⃛
p
(
t
)
+
…
…
…
…
a
4
C
¨
p
(
t
)
+
a
5
C
˙
p
(
t
)
+
a
6
C
p
(
t
)
with the coefficients a 1 = −( k 2 + k 3 + k 5 + k 6 ), a 2 = − k 6 ( k 2 + k 3 ), a 3 = F B , a 4 = ( k 2 + k 3 + k 5 + k 6 ) F B + k 1 , a 5 = k 1 ( k 3 + k 5 + k 6 ) + F B k 6 ( k 2 + k 3 ), and a 6 = k 1 k 3 k 6 . Once these coefficients were identified by GLSQ, the parameters of the lung-specific model were computed according to:
FB=a3,k1=a4+a1a3, F
B
=
a
3
,
k
1
=
a
4
+
a
1
a
3
,
k2=−a5+a2a3a4+a1a3−a1, k
2
=
−
a
5
+
a
2
a
3
a
4
+
a
1
a
3
−
a
1
,
k3=−k2a6a6+k1a2, k
3
=
−
k
2
a
6
a
6
+
k
1
a
2
,
k6=−a6+k1a2k1k2, k
6
=
−
a
6
+
k
1
a
2
k
1
k
2
,
and k5=−(k2+k3+k6+a1) k
5
=
−
(
k
2
+
k
3
+
k
6
+
a
1
) . Under the assumption of steady-state conditions, the 18 F-FDG distribution volume of the precursor compartment as a fraction of lung volume ( F e ), can be derived as
Fe=k1k2+k3 F
e
=
k
1
k
2
+
k
3
which is effectively the same equation as the one used to derive F e from the rate constants of the Sokoloff model ( ). The corresponding fractional 18 F-FDG distribution volume of the extravascular/noncellular compartment ( F ee ) is given by
Fee=k5k6k1k2+k3. F
e
e
=
k
5
k
6
k
1
k
2
+
k
3
.
Get Radiology Tree app to read full this article<
Get Radiology Tree app to read full this article<
Ki=Fek3=k1k3k2+k3 K
i
=
F
e
k
3
=
k
1
k
3
k
2
+
k
3
where the right side is identical to the corresponding equation used for the Sokoloff model ( ).
Get Radiology Tree app to read full this article<
Sokoloff Model
Get Radiology Tree app to read full this article<
Model Selection
Get Radiology Tree app to read full this article<
AIC=N1n(Σi=1Ne2(ti))+2n AIC
=
N
1
n
(
Σ
i
=
1
N
e
2
(
t
i
)
)
+
2
n
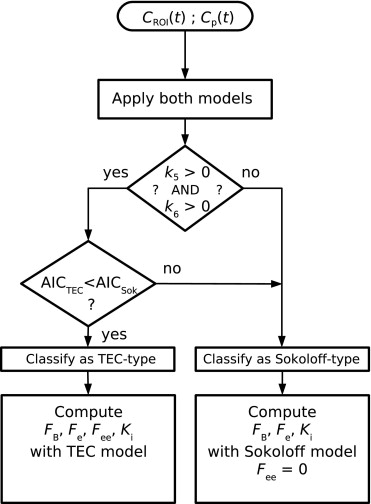
where N was the number of PET image frames, and 2 n a penalty factor accounting for the number of model parameters, n (i.e., n = 4 for the Sokoloff model, and n = 6 for the TEC model). The model with the smallest AIC was considered best to fit the data ( ).
Get Radiology Tree app to read full this article<
Get Radiology Tree app to read full this article<
Experimental Data
Get Radiology Tree app to read full this article<
Get Radiology Tree app to read full this article<
Get Radiology Tree app to read full this article<
Get Radiology Tree app to read full this article<
Statistical Analysis
Get Radiology Tree app to read full this article<
Results
Get Radiology Tree app to read full this article<
Table 1
Number of Exposed and Contralateral (Protected) Lungs With TEC-Type 18 F-FDG Kinetics
Exposed Lung Protected Lung Smoke 4/5 0/5 NEEP 5/6 4/6 PEEP 1/4 0/4
NEEP, negative end-expiratory pressure; PEEP, positive end-expiratory pressure.
Table 2
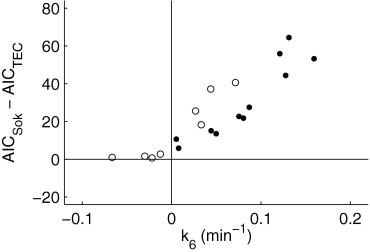
Mean, Standard Deviation, and Range of Model Parameters k 5 and k 6
k 5 (1/min)k 6 (1/min) Mean ± Standard Deviation Range Mean ± Standard Deviation Range ALI-type tracer kinetics 0.0444 ± 0.0221 ⁎ 0.0219 to 0.0917 ± 0.0757 ± 0.0452 ⁎ 0.0079 to 0.1595 Sokoloff-type tracer kinetics −0.2080 ± 0.9521 −3.4685 to 0.4087 −0.4968 ± 1.3378 −4.4665 to 1.4575
Get Radiology Tree app to read full this article<
Get Radiology Tree app to read full this article<
Get Radiology Tree app to read full this article<
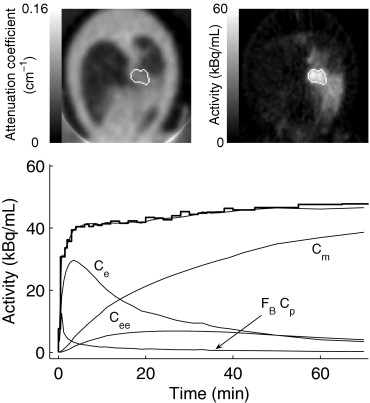
![Figure 4, Comparison of curve fits achieved with the two different models for Sokoloff-type (a and b) and acute lung injury-type (c and d) lung 18 F-FDG kinetics. (a) Curve fit obtained with the Sokoloff model for Sokoloff-type lung 18 F-FDG kinetics. The heavy line is the PET-acquired tissue time-activity curve [ C ROI ( t )]. C model is calculated as the sum of model-derived time-activity curves from the individual model compartments. (b) Curve fit obtained with the TEC model applied to the same 18 F-FDG kinetics as in (a). (c and d) Curve fits obtained for lung 18 F-FDG kinetics exhibiting TEC-type behavior in a lung with smoke inhalation exposure. (c) Curve fit obtained with Sokoloff model. (d) , Curve fit obtained with TEC model applied to the same lung 18 F-FDG kinetics as in (c).](https://storage.googleapis.com/dl.dentistrykey.com/clinical/ModelingPulmonaryKineticsof2Deoxy218FfluorodglucoseDuringAcuteLungInjury/3_1s20S107663320800007X.jpg)
Get Radiology Tree app to read full this article<
Get Radiology Tree app to read full this article<
Get Radiology Tree app to read full this article<
Get Radiology Tree app to read full this article<
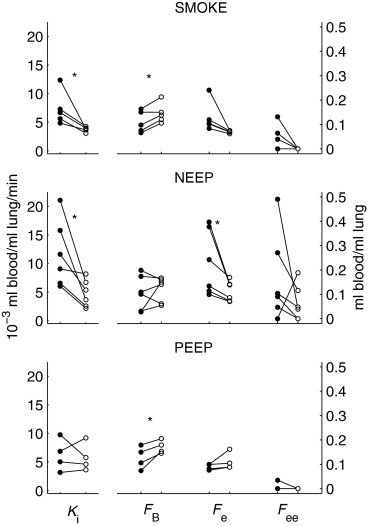
Table 3
Percentile Values of ANOVA Test of Exposure and Type of Exposure Effects on Model-Derived Parameters
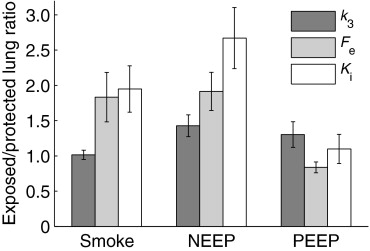
Source_K_ i F e Uncorrected_F_ ee K i F e Bonferroni Correction_F_ ee Exposure to injurious stimulus 0.0031 0.0284 0.0818 0.0094 0.0852 0.2454 Type of exposure 0.1642 0.0429 0.0261 0.4925 0.1288 0.0783 Exposure x type of exposure 0.1282 0.1293 0.5516 0.3847 0.3880 1.6547
Get Radiology Tree app to read full this article<
Get Radiology Tree app to read full this article<
Get Radiology Tree app to read full this article<
Discussion
Get Radiology Tree app to read full this article<
Get Radiology Tree app to read full this article<
Get Radiology Tree app to read full this article<
Get Radiology Tree app to read full this article<
Get Radiology Tree app to read full this article<
Get Radiology Tree app to read full this article<
Get Radiology Tree app to read full this article<
Get Radiology Tree app to read full this article<
Get Radiology Tree app to read full this article<
Get Radiology Tree app to read full this article<
Get Radiology Tree app to read full this article<
Get Radiology Tree app to read full this article<
Conclusion
Get Radiology Tree app to read full this article<
Get Radiology Tree app to read full this article<
Appendix
Get Radiology Tree app to read full this article<
q˙p⇒e(t)=k1VROICp(t) q
˙
p
⇒
e
(
t
)
=
k
1
V
ROI
C
p
(
t
)
where V ROI is the volume of the region of interest (ROI), and the constant k 1 describes the rate of facilitated 18 F-FDG transport from blood to tissue per unit of organ volume ( ). Alternatively, in the lung, V ROI can contain significant amounts of blood and alveolar gas, and a parenchyma-specific 18 F-FDG blood-to-tissue transfer rate ( k 1 *) can be computed as k 1 \* = k 1 /(1 − F B − F gas ), where F B and F gas are the fractional volumes of blood and alveolar gas. With the rate constants k 2 , k 3 , k 5 , and k 6 describing, respectively, the rate of 18 F-FDG diffusion from tissue to blood, the rate of hexokinase-catalyzed phosphorylation to 18 F-FDG-6-P, and the transport rates of 18 F-FDG from the precursor compartment into the extravascular/noncellular compartment and back, we obtain for tracer dynamics of the precursor compartment
q˙e(t)=k1VROICp(t)−(k2+k3)qe(t)−k5qe(t)+k6qee(t)=k1VROICp(t)−(k2+k3+k5)qe(t)+k6qee(t) q
˙
e
(
t
)
=
k
1
V
ROI
C
p
(
t
)
−
(
k
2
+
k
3
)
q
e
(
t
)
−
k
5
q
e
(
t
)
+
k
6
q
ee
(
t
)
=
k
1
V
ROI
C
p
(
t
)
−
(
k
2
+
k
3
+
k
5
)
q
e
(
t
)
+
k
6
q
ee
(
t
)
where q e ( t ) and q ee ( t ) are the decay-corrected quantities of tracer in the precursor and the extravascular/noncellular compartments. The transfer of 18 F-FDG between the precursor compartment and the extravascular/noncellular compartment is modeled as passive diffusion, where the gradient in tracer concentrations is the driving force of mass transfer. The permeability ( p ) of the barrier between the precursor and extravascular/noncellular compartment is given as the product of diffusion surface area and permeability coefficient. Assuming the initial conditions q e ( t ) = 0, t <0, one obtains the following differential equation for tracer dynamics in the extravascular/noncellular compartment
q˙ee(t)=pVeqe(t)−pVeeqee(t)=k5qe(t)−k6qee(t) q
˙
ee
(
t
)
=
p
V
e
q
e
(
t
)
−
p
V
ee
q
ee
(
t
)
=
k
5
q
e
(
t
)
−
k
6
q
ee
(
t
)
where V e and V ee are the absolute distribution volumes of the precursor compartment and extravascular/noncellular compartment. Finally, for the tracer quantity in the metabolite compartment ( q m ( t )) we obtain
q˙m(t)=k3qe(t). q
˙
m
(
t
)
=
k
3
q
e
(
t
)
.
Normalizing Equations A2, A3, and A4 by V ROI to reflect changes in ROI activity concentration gives
C˙e(t)=k1Cp(t)−(k2+k3+k5)Ce(t)+k6Cee(t) C
˙
e
(
t
)
=
k
1
C
p
(
t
)
−
(
k
2
+
k
3
+
k
5
)
C
e
(
t
)
+
k
6
C
ee
(
t
)
C˙ee(t)=k5Ce(t)−k6Cee(t) C
˙
ee
(
t
)
=
k
5
C
e
(
t
)
−
k
6
C
ee
(
t
)
C˙m(t)=k3Ce(t). C
˙
m
(
t
)
=
k
3
C
e
(
t
)
.
Get Radiology Tree app to read full this article<
Get Radiology Tree app to read full this article<
sCe(s)=k1Cp(s)−(k2+k3+k5)Ce(s)+k6Cee(s) s
C
e
(
s
)
=
k
1
C
p
(
s
)
−
(
k
2
+
k
3
+
k
5
)
C
e
(
s
)
+
k
6
C
ee
(
s
)
sCee(s)=k5Ce(s)−k6Cee(s) s
C
e
e
(
s
)
=
k
5
C
e
(
s
)
−
k
6
C
e
e
(
s
)
sCm(s)=k3Ce(s). s
C
m
(
s
)
=
k
3
C
e
(
s
)
.
Get Radiology Tree app to read full this article<
Get Radiology Tree app to read full this article<
s3CROI(s)=a1s2CROI(s)+a2sCROI(s)+a3s3Cp(s)+…………a4s2Cp(s)+a5sCp(s)+a6Cp(s) s
3
C
ROI
(
s
)
=
a
1
s
2
C
ROI
(
s
)
+
a
2
s
C
ROI
(
s
)
+
a
3
s
3
C
p
(
s
)
+
…
…
…
…
a
4
s
2
C
p
(
s
)
+
a
5
s
C
p
(
s
)
+
a
6
C
p
(
s
)
the inverse Laplace transform of which gives the differential equation of the system (Eq. 2 ).
Get Radiology Tree app to read full this article<
Get Radiology Tree app to read full this article<
References
1. Permutt S.: Current status of functional pulmonary imaging. Acad Radiol 2005; 12: pp. 1359-1361.
2. Hoffman E.A., van Beek E.: Hyperpolarized media MR imaging—Expanding the boundaries?. Acad Radiol 2006; 13: pp. 929-931.
3. Simon B.A.: Regional ventilation and lung mechanics using x-ray CT. Acad Radiol 2005; 12: pp. 1414-1422.
4. Musch G., Venegas J.G., Bellani G., et. al.: Regional gas exchange and cellular metabolic activity in ventilator-induced lung injury. Anesthesiology 2007; 106: pp. 723-735.
5. Schroeder T., Vidal Melo M.F., Musch G., Harris R.S., Venegas J.G., Winkler T.: Image-derived input function for assessment of 18F-FDG uptake by the inflamed lung. J Nucl Med 2007; 48:
6. Schroeder T., Vidal Melo M.F., Musch G., Harris R.S., Winkler T., Venegas J.G.: PET imaging of regional 18F-FDG uptake and lung function following cigarette smoke inhalation. J Nucl Med 2007; 48: pp. 413-419.
7. Jones H.A., Clark R.J., Rhodes C.G., Schofield J.B., Krausz T., Haslett C.: In vivo measurement of neutrophil activity in experimental lung inflammation. Am J Respir Crit Care Med 1994; 149: pp. 1635-1639.
8. Jones H.A., Sriskandan S., Peters A.M., Pride N.B., Krausz T., Boobis A.R., Haslett C.: Dissociation of neutrophil emigration and metabolic activity in lobar pneumonia and bronchiectasis. Eur Respir J 1997; 10: pp. 795-803.
9. Chen D.L., Schuster D.P.: Positron emission tomography with [18F]fluorodeoxyglucose to evaluate neutrophil kinetics during acute lung injury. Am J Physiol Lung Cell Mol Physiol 2004; 286: pp. L834-L840.
10. Chen D.L., Mintun M.A., Schuster D.P.: Comparison of methods to quantitate 18F-FDG uptake with PET during experimental acute lung injury. J Nucl Med 2004; 45: pp. 1583-1590.
11. Zhou Z., Kozlowski J., Goodrich A.L., Markman N., Chen D.L., Schuster D.P.: Molecular imaging of lung glucose uptake after endotoxin in mice. Am J Physiol Lung Cell Mol Physiol 2005; 289: pp. L760-L768.
12. Jones H.A., Marino P.S., Shakur B.H., Morrell N.W.: In vivo assessment of lung inflammatory cell activity in patients with COPD and asthma. Eur Respir J 2003; 21: pp. 567-573.
13. Patlak C.S., Blasberg R.G., Fenstermacher J.D.: Graphical evaluation of blood-to-brain transfer constants from multiple-time uptake data. J Cereb Blood Flow Metab 1983; 3: pp. 1-7.
14. Patlak C.S., Blasberg R.G.: Graphical evaluation of blood-to-brain transfer constants from multiple-time uptake data. J Cereb Blood Flow Metab 1985; 5: pp. 584-590.
15. Sokoloff L., Reivich M., Kennedy C., et. al.: The [14C]deoxyglucose method for the measurement of local cerebral glucose utilization: Theory, procedure, and normal values in the conscious and anesthetized albino rat. J Neurochem 1977; 28: pp. 897-916.
16. Phelps M.E., Huang S.C., Hoffman E.J., Selin C., Sokoloff L., Kuhl D.E.: Tomographic measurement of local cerebral glucose metabolic rate in humans with (F-18)2-fluoro-2-deoxy-D-glucose: Validation of method. Ann Neurol 1979; 6: pp. 371-388.
17. Hawkins R.A., Phelps M.E., Huang S.C.: Effects of temporal sampling, glucose metabolic rates, and disruptions of the blood-brain barrier on the FDG model with and without a vascular compartment: Studies in human brain tumors with PET. J Cereb Blood Flow Metab 1986; 6: pp. 170-183.
18. Herrero P., Sharp T.L., Dence C., Haraden B.M., Gropler R.J.: Comparison of 1-(11)C-glucose and (18)F-FDG for quantifying myocardial glucose use with PET. J Nucl Med 2002; 43: pp. 1530-1541.
19. Landaw E.M., DiStefano J.J.: Multiexponential, multicompartmental, and noncompartmental modeling. Am J Physiol 1984; 246: pp. R665-R677.
20. Carson R.E.: Tracer kinetic modeling in PET.Valk P.E.Bailey D.L.Townsend D.W.Maisey M.N.2003.Springer VerlagNew York:pp. 147-179.
21. Cai W., Feng D., Fulton R., Siu W.C.: Generalized linear least squares algorithms for modeling glucose metabolism in the human brain with corrections for vascular effects. Comput Methods Programs Biomed 2002; 68: pp. 1-14.
22. Feng D., Huang S.C., Wang Z., Ho D.: An unbiased parametric imaging algorithm for nonuniformly sampled biomedical system parameter estimation. IEEE Trans Med Imag 1996; 15: pp. 512-518.
23. Vidal Melo M.F., Layfield D., Harris R.S., et. al.: Quantification of regional ventilation-perfusion ratios with PET. J Nucl Med 2003; 44: pp. 1982-1991.
24. Dos Santos C.C., Slutsky A.S.: The contribution of biophysical lung injury to the development of biotrauma. Annu Rev Physiol 2006; 68: pp. 585-618.
25. Garfinkel D., Fegley K.A.: Fitting physiological models to data. Am J Physiol 1984; 246: pp. R641-R650.
26. Jones H.A., Schofield J.B., Krausz T., Boobis A.R., Haslett C.: Pulmonary fibrosis correlates with duration of tissue neutrophil activation. Am J Respir Crit Care Med 1998; 158: pp. 620-628.
27. Chen D.L., Rosenbluth D.B., Mintun M.A., Schuster D.P.: FDG-PET imaging of pulmonary inflammation in healthy volunteers after airway instillation of endotoxin. J Appl Physiol 2006; 100: pp. 1602-1609.
28. Basadre J.O., Sugi K., Traber D.L., Traber L.D., Niehaus G.D., Herndon D.N.: The effect of leukocyte depletion on smoke inhalation injury in sheep. Surgery 1988; 104: pp. 208-215.
29. Frank J.A., Matthay M.A.: Science review: Mechanisms of ventilator-induced injury. Crit Care 2003; 7: pp. 233-241.
30. Tremblay L.N., Slutsky A.S.: Ventilator-induced lung injury: From the bench to the bedside. Intensive Care Med 2006; 32: pp. 24-33.
31. Rennen H.J., Boerman O.C., Oyen W.J., Corstens F.H.: Imaging infection/inflammation in the new millennium. Eur J Nucl Med 2001; 28: pp. 241-252.
32. Pou N.A., Roselli R.J., Parker R.E., Clanton J.A., Harris T.R.: Measurement of lung fluid volumes and albumin exclusion in sheep. J Appl Physiol 1989; 67: pp. 1323-1330.
33. Hellewell P.G., Henson P.M., Downey G.P., Worthen G.S.: Control of local blood flow in pulmonary inflammation: Role for neutrophils, PAF, and thromboxane. J Appl Physiol 1991; 70: pp. 1184-1193.
34. Gattinoni L., Caironi P., Valenza F., Carlesso E.: The role of CT-scan studies for the diagnosis and therapy of acute respiratory distress syndrome. Clin Chest Med 2006; 27: pp. 559-570.
35. Schuster D.P., Mintun M.A., Green M.A., Ter Pogossian M.M.: Regional lung water and hematocrit determined by positron emission tomography. J Appl Physiol 1985; 59: pp. 860-868.
36. Crone C.: Facilitated transfer of glucose from blood into brain tissue. J Physiol 1965; 181: pp. 103-113.