
Rationale and Objectives
We sought to identify and describe the characteristics of molecular imaging (MI) programs in the United States and to determine the factors considered critical for their future.
Materials and Methods
In a cross-sectional study, a validated survey was sent to members of the Society of Chairmen in Academic Radiology Departments (SCARD) in the United States, and 26 variables were studied.
Results
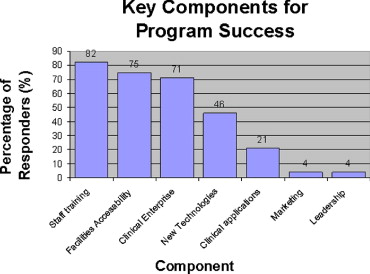
The response rate was 40.3%; 67.9% of the departments surveyed have an MI program. The main focus of 47.4% of departments is oncology. The number of radiologists working for the department was the only variable found to be significantly positively correlated with (1) number of researchers in the MI program, (2) number of MI modalities available, (3) total number of grants, and (4) having ongoing MI clinical trials. These four variables plus the number of federal grants and the space used by MI programs were independent of the geographical region, hospital size (number of beds), and department size (number of radiological examinations per year). All the MI programs received grants during 2005. Only 16.1% have no alliances with industry. Among all the departments, 82% identified staff training and recruitment as the keys for success; 78.57% considered oncology the most important future application of MI and cancer management the hospital service most affected by MI.
Conclusion
MI programs are starting to be more widespread throughout the United States, and the trend is for more academic radiology departments to become engaged in MI activities; their development is independent of department characteristics. Radiology departments strongly agreed about the key components for success of MI initiatives and the areas that will be most affected by MI applications.
The American College of Radiology (ACR) definition of molecular imaging (MI) as “the spatially localized and/or temporally resolved sensing of molecular cellular processes in vivo” reveals the enormous potential of MI as a means to diagnose and monitor disease ( ). The potential of MI is starting to be fulfilled, with its identification by the National Institute of Biomedical Imaging and Bioengineering (NIBIB) as a field that will address critical biomedical research and health care needs in the next 5 years ( ). The entire imaging field is at a crossroads, with molecularly targeted imaging agents expected to expand and revolutionize conventional imaging methods ( ).
MI studies have revealed important biological processes related primarily to cancer and cardiovascular and neurological diseases ( ) that will allow their pathogenesis to be studied in intact microenvironments of living systems ( ). In cancer, emerging genomic and proteomic technologies can transform clinical management and lead the way to personalized care ( ). The management of cardiovascular diseases has benefited from the revelation of new aspects of atherosclerosis and will continue as MI is used to detect clinical atheroma ( ). Neurology has received some assistance from MI based on magnetic resonance (MR) and positron emission tomography (PET) for the diagnosis and management of Alzheimer’s and Parkinson’s diseases ( ). Other applications such as monocrystalline iron oxide nanocompound (MION) MR-based techniques and near-infrared optical tomography have not found their way into clinical applications, rendering them attractive for research but irrelevant to general radiologists and raising expectations of which MI technologies will be incorporated into daily clinical practices and how.
Get Radiology Tree app to read full this article<
Materials and methods
Survey
Get Radiology Tree app to read full this article<
Get Radiology Tree app to read full this article<
Get Radiology Tree app to read full this article<
Statistical Methods
Get Radiology Tree app to read full this article<
Get Radiology Tree app to read full this article<
Get Radiology Tree app to read full this article<
Get Radiology Tree app to read full this article<
Results
Get Radiology Tree app to read full this article<
General Characteristics
Get Radiology Tree app to read full this article<
Table 1
Sample Demographics
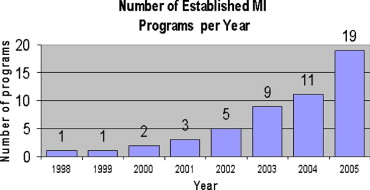
Variable Respondents (n) MI program 19 No MI program 9 Total 28 Region (n) Northeast 9 Midwest 8 Southwest 4 South 4 Pacific 3 Total 28 Hospital size (No. of beds) <200 1 200−500 5 >500 22 Total 28 Radiological exams (n) <200,000 4 200,000−400,000 11 >400,000 13 Total 28 MI year of foundation 1998 1 1999 1 2000 2 2001 3 2002 5 2003 9 2004 11 2005 19 Main focus (No. of programs) Oncology 9 Neuroscience 3 Technology 3 Cardiovascular 3 Contrast/tracer 1 Total 19
Get Radiology Tree app to read full this article<
Molecular Imaging Programs
Get Radiology Tree app to read full this article<
Get Radiology Tree app to read full this article<
Get Radiology Tree app to read full this article<
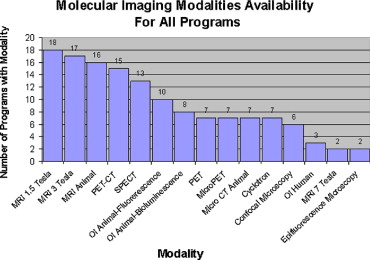
Human Resources and Modalities
Get Radiology Tree app to read full this article<
Get Radiology Tree app to read full this article<
Get Radiology Tree app to read full this article<
Get Radiology Tree app to read full this article<
Get Radiology Tree app to read full this article<
Funding and Activities
Get Radiology Tree app to read full this article<
Get Radiology Tree app to read full this article<
Get Radiology Tree app to read full this article<
Perspectives on the Future of Molecular Imaging
Get Radiology Tree app to read full this article<
Get Radiology Tree app to read full this article<
Get Radiology Tree app to read full this article<
Regression Analysis
Get Radiology Tree app to read full this article<
Get Radiology Tree app to read full this article<
Discussion
Get Radiology Tree app to read full this article<
Get Radiology Tree app to read full this article<
Get Radiology Tree app to read full this article<
Get Radiology Tree app to read full this article<
Get Radiology Tree app to read full this article<
Get Radiology Tree app to read full this article<
Get Radiology Tree app to read full this article<
Get Radiology Tree app to read full this article<
Get Radiology Tree app to read full this article<
Get Radiology Tree app to read full this article<
Get Radiology Tree app to read full this article<
Get Radiology Tree app to read full this article<
Appendix 1
Get Radiology Tree app to read full this article<
References
1. Miller J.C., Thrall J.H.: Clinical molecular imaging. J Am Coll Radiol 2004; 1: pp. 4-23.
2. National Institute of Biomedical Imaging and Bioengineering. What is the single highest priority research focus area that the NIBIB can support to address critical biomedical research of health care needs in approximately the next five years? Available at www.nibib.nih.gov . Accessed June 2006.
3. Weissleder R.: Molecular imaging in cancer. Science 2006; 312: pp. 1168-1171.
4. Jaffer F.A., Libby P., Weissleder R.: Molecular and cellular imaging of atherosclerosis: Emerging applications. J Am Coll Cardiol 2006; 47: pp. 1328-1338.
5. Ono M., Kawashima H., Nonaka A., et. al.: Novel benzofuran derivates for PET imaging of beta-amyloid plaques in Alzheimer’s disease brains. J Med Chem 2006; 49: pp. 2725-2730.
6. Weissleder R.: Molecular imaging: Exploring the next frontier. Radiology 1999; 212: pp. 609-614.
7. Fujita M., et. al.: Widespread decrease of nicotinic acetylcholine receptors in Parkinson’s disease. Ann Neurol 2006; 59: pp. 174-177.
8. National Cancer Institute. Molecular imaging for cancer. Available at www.cancer.gov . Accessed June 2006.
9. National Institute of Biomedical Imaging and Bioengineering. NIBIB FY 2006 funding strategy. Available at www.nibib.nih.gov Accessed June 2006.
10. Pomper M.G.: Molecular imaging: An overview. Acad Radiol 2001; 8: pp. 1141-1153.
11. General Electric Healthcare. News and Events. Available at www.gehealthcare.com Accessed June 2006.
12. Siemens. Siemens Highlights Complete Molecular Imaging Solutions for Cardiology, Oncology and Neurology at SNM 2006. News release. Available at www.siemens.com . Accessed July 2006.
13. Phillips Electronics. Phillips and Molecular Imaging. Available at www.phillips.com . Accessed July 2006.
14. Society of Chairmen in Academic Radiology Departments. Available at www.scardonline.org . Accessed June 2006.
15. Surveymonkey.com. Available at www.surveymonkey.com . Accessed June 2006.
16. Hoffman J.M., Menkens A.E.: Molecular imaging in cancer: Future directions and goals of the National Cancer Institute. Acad Radiol 2000; 7: pp. 905-907.
17. National Cancer Institute. Planning grants: In vivo cellular and molecular imaging centers (pre-ICMICs)Release date March 30, 1999. Available at http://imaging.cancer.gov/researchfunding/past/CA-01-010 . Accessed June 2006.
18. National Cancer Institute. In vivo cellular and molecular imaging centers (ICMICs)NCI initiatives. Release date March 30, 1999. Available at http://deainfo.nci.nih.gov/concepts/ICMICs.htm . Accessed June 2006.
19. Academy of Radiology Research. 2005 NIH Grants and Awards Ranking. Available at www.acadrad.org . Accessed October 2006.
20. Matchar DB, et al. Use of positron emission tomography and other neuroimaging techniques in the diagnosis and management of Alzheimer’s disease and dementia. Prepared for the Agency for Healthcare Research and Quality Contract No.290-97-0014, Task Order 7. Available at www.cms.hhs.gov . Accessed October 2006.
21. McMahon P.M., Araki A.A., Neumann P.J., Harris G.J., Gazelle G.S.: Cost-effectiveness of functional imaging test in the diagnosis of Alzheimer disease. Radiology 2000; 217: pp. 58-68.