
Rationale and Objectives
Neoadjuvant systemic therapy (NST) is the standard treatment for locally advanced breast cancer and a common option for primary operable disease. It is important to develop standardized imaging techniques that can monitor and quantify response to NST enabling treatment tailored to each individual patient, and facilitating surgical planning. Here we present a high spatial resolution, parametric method based on dynamic contrast-enhanced (DCE) magnetic resonance imaging (MRI), which evaluates breast cancer response to NST.
Materials and Methods
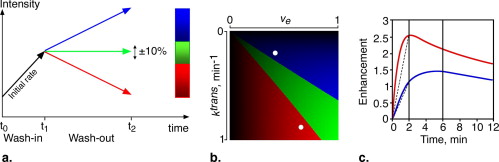
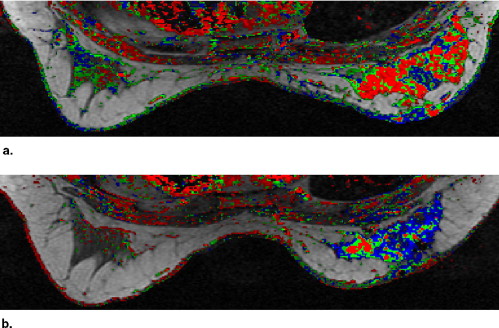
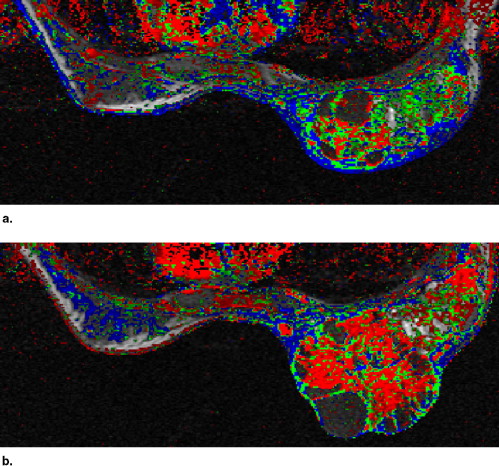
DCE-MRI examinations were performed twice on 17 breast cancer patients, before and after treatment. Seven sets of axial breast images were sequentially recorded at 1.5 Tesla applying a three-dimensional, gradient echo at a spatial resolution ∼2 × 1.2 × 0.6 mm 3 and temporal resolution ∼2 minutes, using gadopentate dimeglumine (0.1 mmol/kg wt). Image analysis was based on a color-coded scheme related to physiologic perfusion parameters.
Results
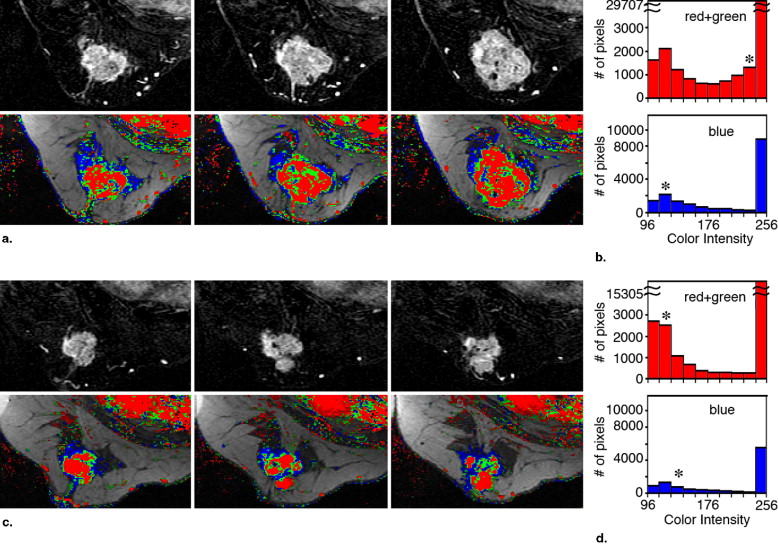
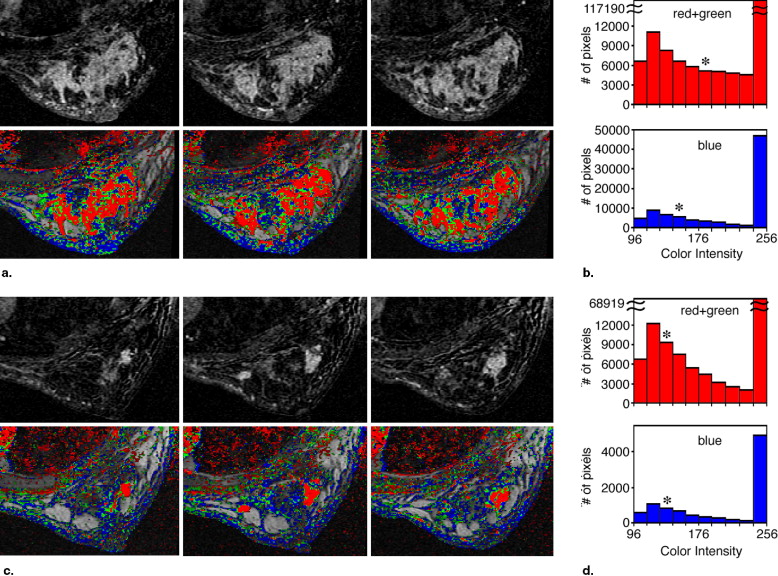
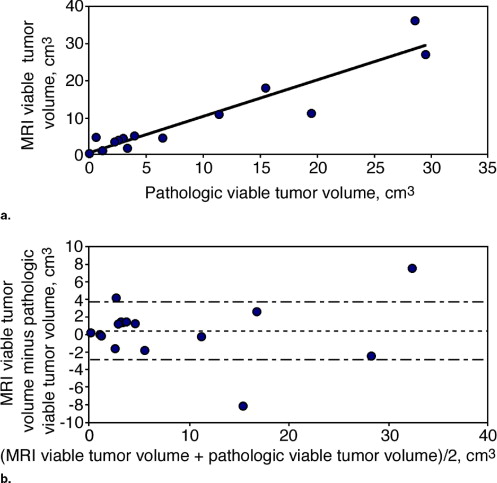
A high Pearson correlation coefficient of 0.96 ( P < .0001) was found between the histopathologic estimation of viable neoplastic tissue volume and the segmented volume of all the pixels demonstrating fast and steady state washout after NST (colored in light red and green). Segmentation of these pixels before and after NST indicated response in terms of reduced tumor volume and a parallel decrease in enhancement rate which reflects diminished transcapillary transfer of the contrast agent.
Conclusions
The use of a parametric MRI technique provided a means to standardize segmentation and quantify changes in the perfusion of breast neoplastic tissue in response to NST. Whether this technique can serve to predict breast cancer recurrence and survival rates requires further clinical testing.
Neoadjuvant systemic therapy (NST) is the standard treatment for locally advanced breast cancer and a common option for primary operable disease. It is mainly designed to reduce tumor size, thereby improving surgical outcomes; to evaluate response to systemic therapy; and to obtain long-term, disease-free survival ( ). To achieve these goals, it is necessary to develop standardized imaging techniques that can noninvasively monitor the response of breast tumors to NST and quantify changes in their size and spread, as well as track specific biologic and physiologic markers of malignancy. Such imaging techniques could be useful in the early stages of treatment, to help predict response to chemotherapy, to enable treatment tailored to each individual patient, and to facilitate surgical planning at later treatment stages.
Magnetic resonance imaging (MRI), an important adjuvant tool for the detection and characterization of breast cancer ( ) has also been used to monitor the effects of NST ( ). Specifically, contrast-enhanced MRI provides a means to delineate the architectural and dynamic features of breast tumors and determine their size ( ). In recent years, several groups have examined whether contrast-enhanced MRI is accurate enough to evaluate residual tumor size after NST, and compared their results with final histopathologic assessment of mastectomy specimens ( ) and with data from other imaging methods such as mammography and sonography.
Get Radiology Tree app to read full this article<
Get Radiology Tree app to read full this article<
Materials and methods
Patients, Treatment, and Timing of MRI
Get Radiology Tree app to read full this article<
Get Radiology Tree app to read full this article<
Histologic Evaluation
Get Radiology Tree app to read full this article<
MRI
Get Radiology Tree app to read full this article<
Image Analysis
Get Radiology Tree app to read full this article<
Get Radiology Tree app to read full this article<
Get Radiology Tree app to read full this article<
Get Radiology Tree app to read full this article<
Get Radiology Tree app to read full this article<
Statistical Evaluation
Get Radiology Tree app to read full this article<
Results
Get Radiology Tree app to read full this article<
Table 1
Data from Mastectomy Specimens, Lymph Node Status, and Follow up
Case No. Stage NST No. Cycle Final Morphologic Distribution Residual Pathologic Volume † (cm 3 ) % Viable Neoplastic Cells † % Fibrosis † % Necrosis † Response Lymph Node Involved Recurrence-free Survival, Months 1 III 3 Localized NA NA NA NA PR 0 45 2 III 3 Localized 1.2 4 95 1 PR 5 22 ‡ 3 II 4 Localized 4.6 59 25 16 PR 0 33 4 III 3 Diffused 5.5 22 75 3 PR 0 44 5 III 3 Localized 43.3 15 80 5 PR 6 39 6 III 3 Localized 5.3 47 50 3 PR 0 50 7 III 3 Localized 27.9 70 25 5 PR 3 9 ‡ 8 II 3 Localized 6.5 62 34 4 SD 0 50 9 II 2 Diffused 2.8 47 50 3 SD 0 54 10 III 3 Diffused 14.7 76 20 4 SD 5 38 11 II 3 Localized 2.5 25 62 13 SD 0 44 12 III 4 Diffused 47.6 62 33 5 SD 22 6 ‡ 13 III 2 Localized 4.4 78 20 2 SD 0 44 14 ⁎ II 2 Diffused 46.1 5 75 20 SD 0 38 15 III 3 Diffused 60.9 47 20 33 SD 0 12 ‡ 16 III 3 Diffused 3.2 94 5 1 SD 2 53 17 II 3 Diffused 155 10 50 40 SD 1 48
NST: neoadjuvant systemic therapy; NA: not available; PR: partial response; SD: stable disease (defined using Response Evaluation Criteria in Solid Tumors).
Get Radiology Tree app to read full this article<
Get Radiology Tree app to read full this article<
Get Radiology Tree app to read full this article<
Get Radiology Tree app to read full this article<
Get Radiology Tree app to read full this article<
Get Radiology Tree app to read full this article<
Get Radiology Tree app to read full this article<
Get Radiology Tree app to read full this article<
Table 2
Evaluation of the Segmentation and Intensity of the Regions Colored Red and Green in the Parametric Images Obtained Pre- and Post-NST
Case No. Volume of Red + Green Pixels, cm 3 Median Color Intensity of Red + Green Pixels Pretreatment Posttreatment Change (%) Pretreatment Posttreatment Change (%) 1 17.8 0.1 −99 140 116 −17 2 2.5 0.2 −92 160 120 −25 3 39.9 4.0 −90 213 122 −43 4 8.1 1.0 −87 186 125 −33 5 23.5 4.9 −79 110 125 +14 6 14.6 3.9 −73 210 255 +21 7 34.0 11.6 −66 235 170 −28 8 12.3 4.9 −60 239 138 −42 9 2.6 1.1 −59 194 135 −30 10 24.6 11.8 −52 216 210 −3 11 8.9 4.7 −47 126 120 −5 12 41.1 28.8 −30 192 149 −22 13 1.7 1.7 0 207 219 +6 14 3.3 3.5 +4 152 134 −12 15 20.2 31.7 +57 177 213 +20 16 2.7 4.4 +62 158 158 0 17 NA 17.9 NA NA 211 NA
NST: neoadjuvant systemic therapy; NA: not available.
Get Radiology Tree app to read full this article<
Get Radiology Tree app to read full this article<
Get Radiology Tree app to read full this article<
Get Radiology Tree app to read full this article<
Get Radiology Tree app to read full this article<
Table 3
Evaluation of the Segmentation and Intensity of the Regions Colored Blue in the Parametric Images Obtained Pre- and Post-NST
Case No. Volume of Blue Pixels, cm 3 Median Color Intensity of Blue Pixels Pretreatment Posttreatment Change (%) Pretreatment Posttreatment Change (%) 1 6.4 0.3 −96 134 120 −10 2 1.6 0.3 −81 150 120 −20 3 16.0 2.4 −85 146 123 −16 4 5.1 0.9 −83 159 126 −21 5 5.9 2.8 −52 102 127 +25 6 4.0 5.0 +26 170 178 +5 7 13.4 4.2 −69 147 141 −4 8 5.2 2.2 −57 135 135 0 9 1.9 1.2 −38 155 136 −12 10 11.7 3.4 −71 154 140 −9 11 5.6 9.7 +75 134 129 −4 12 19.2 20.6 +7 147 141 −4 13 1.1 0.4 −64 162 158 −2 14 4.4 3.4 −23 141 131 −7 15 14.9 16.0 +7 159 159 0 16 2.2 1.3 −42 133 147 +11 17 NA 10.5 NA NA 158 NA
NST: neoadjuvant systemic therapy; NA: not available.
Get Radiology Tree app to read full this article<
Get Radiology Tree app to read full this article<
Discussion
Get Radiology Tree app to read full this article<
Get Radiology Tree app to read full this article<
Get Radiology Tree app to read full this article<
Get Radiology Tree app to read full this article<
Get Radiology Tree app to read full this article<
Get Radiology Tree app to read full this article<
Get Radiology Tree app to read full this article<
Get Radiology Tree app to read full this article<
Get Radiology Tree app to read full this article<
Acknowledgments
Get Radiology Tree app to read full this article<
Get Radiology Tree app to read full this article<
References
1. Kaufmann M., Hortobagyi G.N., Goldhirsch A., et. al.: Recommendations from an international expert panel on the use of neoadjuvant (primary) systemic treatment of operable breast cancer: an update. J Clin Oncol 2006; 24: pp. 1940-1949.
2. Helbich T.H.: Contrast-enhanced magnetic resonance imaging of the breast. Eur J Radiol 2000; 34: pp. 208-219.
3. Padhani A.R., Ah-See M.L., Makris A.: MRI in the detection and management of breast cancer. Expert Rev Anticancer Ther 2005; 5: pp. 239-252.
4. Kaiser W.A., Zeitler E.: MR imaging of the breast: fast imaging sequences with and without Gd-DTPA. Preliminary observations. Radiology 1989; 170: pp. 681-686.
5. Knopp M.V., von Tengg-Kobligk H., Choyke P.L.: Functional magnetic resonance imaging in oncology for diagnosis and therapy monitoring. Mol Cancer Ther 2003; 2: pp. 419-426.
6. Schnall M.D., Blume J., Bluemke D.A., et. al.: Diagnostic architectural and dynamic features at breast MR imaging: multicenter study. Radiology 2006; 238: pp. 42-53.
7. Rieber A., Brambs H.J., Gabelmann A., et. al.: Breast MRI for monitoring response of primary breast cancer to neo-adjuvant chemotherapy. Eur Radiol 2002; 12: pp. 1711-1719.
8. Wasser K., Sinn H.P., Fink C., et. al.: Accuracy of tumor size measurement in breast cancer using MRI is influenced by histological regression induced by neoadjuvant chemotherapy. Eur Radiol 2003; 13: pp. 1213-1223.
9. Esserman L., Kaplan E., Partridge S., et. al.: MRI phenotype is associated with response to doxorubicin and cyclophosphamide neoadjuvant chemotherapy in stage III breast cancer. Ann Surg Oncol 2001; 8: pp. 549-559.
10. Cheung Y.C., Chen S.C., Su M.Y., et. al.: Monitoring the size and response of locally advanced breast cancers to neoadjuvant chemotherapy (weekly paclitaxel and epirubicin) with serial enhanced MRI. Breast Cancer Res Treat 2003; 78: pp. 51-58.
11. Rosen E.L., Blackwell K.L., Baker J.A., et. al.: Accuracy of MRI in the detection of residual breast cancer after neoadjuvant chemotherapy. AJR Am J Roentgenol 2003; 181: pp. 1275-1282.
12. Martincich L., Montemurro F., De Rosa G., et. al.: Monitoring response to primary chemotherapy in breast cancer using dynamic contrast-enhanced magnetic resonance imaging. Breast Cancer Res Treat 2004; 83: pp. 67-76.
13. El Khoury C., Servois V., Thibault F., et. al.: MR quantification of the washout changes in breast tumors under preoperative chemotherapy: feasibility and preliminary results. AJR Am J Roentgenol 2005; 184: pp. 1499-1504.
14. Partridge S.C., Gibbs J.E., Lu Y., et. al.: Accuracy of MR imaging for revealing residual breast cancer in patients who have undergone neoadjuvant chemotherapy. AJR Am J Roentgenol 2002; 179: pp. 1193-1199.
15. Partridge S.C., Gibbs J.E., Lu Y., et. al.: MRI measurements of breast tumor volume predict response to neoadjuvant chemotherapy and recurrence-free survival. AJR Am J Roentgenol 2005; 184: pp. 1774-1781.
16. Delille J.P., Slanetz P.J., Yeh E.D., et. al.: Invasive ductal breast carcinoma response to neoadjuvant chemotherapy: noninvasive monitoring with functional MR imaging pilot study. Radiology 2003; 228: pp. 63-69.
17. Chang Y.C., Huang C.S., Liu Y.J., et. al.: Angiogenic response of locally advanced breast cancer to neoadjuvant chemotherapy evaluated with parametric histogram from dynamic contrast-enhanced MRI. Phys Med Biol 2004; 49: pp. 3593-3602.
18. Armitage P., Behrenbruch C., Brady M., et. al.: Extracting and visualizing physiological parameters using dynamic contrast-enhanced magnetic resonance imaging of the breast. Med Image Anal 2005; 9: pp. 315-329.
19. Padhani A.R., Hayes C., Assersohn L., et. al.: Prediction of clinicopathologic response of breast cancer to primary chemotherapy at contrast-enhanced MR imaging: initial clinical results. Radiology 2006; 239: pp. 361-374.
20. Pickles M.D., Lowry M., Manton D.J., et. al.: Role of dynamic contrast enhanced MRI in monitoring early response of locally advanced breast cancer to neoadjuvant chemotherapy. Breast Cancer Res Treat 2005; 91: pp. 1-10.
21. Hayes C., Padhani A.R., Leach M.O.: Assessing changes in tumour vascular function using dynamic contrast-enhanced magnetic resonance imaging. NMR Biomed 2002; 15: pp. 154-163.
22. Manton D.J., Chaturvedi A., Hubbard A., et. al.: Neoadjuvant chemotherapy in breast cancer: early response prediction with quantitative MR imaging and spectroscopy. Br J Cancer 2006; 94: pp. 427-435.
23. Fischer U., Zachariae O., Baum F., et. al.: The influence of preoperative MRI of the breasts on recurrence rate in patients with breast cancer. Eur Radiol 2004; 14: pp. 1725-1731.
24. Thibault F., Nos C., Meunier M., et. al.: MRI for surgical planning in patients with breast cancer who undergo preoperative chemotherapy. AJR Am J Roentgenol 2004; 183: pp. 1159-1168.
25. Denis F., Desbiez-Bourcier A.V., Chapiron C., et. al.: Contrast enhanced magnetic resonance imaging underestimates residual disease following neoadjuvant docetaxel based chemotherapy for breast cancer. Eur J Surg Oncol 2004; 30: pp. 1069-1076.
26. Degani H., Gusis V., Weinstein D., et. al.: Mapping pathophysiological features of breast tumors by MRI at high spatial resolution. Nat Med 1997; 3: pp. 780-782.
27. Furman-Haran E., Degani H.: Parametric analysis of breast MRI. J Comput Assist Tomogr 2002; 26: pp. 376-386.
28. Kelcz F., Furman-Haran E., Grobgeld D., et. al.: Clinical testing of high-spatial-resolution parametric contrast-enhanced MR imaging of the breast. AJR Am J Roentgenol 2002; 179: pp. 1485-1492.
29. Furman-Haran E., Grobgeld D., Margalit R., et. al.: Response of MCF7 human breast cancer to tamoxifen: evaluation by the three-time-point, contrast-enhanced magnetic resonance imaging method. Clin Cancer Res 1998; 4: pp. 2299-2304.
30. Tofts P.S., Kermode A.G.: Measurement of the blood-brain barrier permeability and leakage space using dynamic MR imaging. 1. Fundamental concepts. Magn Reson Med 1991; 17: pp. 357-367.
31. Tofts P.S.: Modeling tracer kinetics in dynamic Gd-DTPA MR imaging. J Magn Reson Imaging 1997; 7: pp. 91-101.
32. Furman-Haran E., Schechtman E., Kelcz F., et. al.: Magnetic resonance imaging reveals functional diversity of the vasculature in benign and malignant breast lesions. Cancer 2005; 104: pp. 708-718.
33. Therasse P., Arbuck S.G., Eisenhauer E.A., et. al.: New guidelines to evaluate the response to treatment in solid tumors. J Natl Cancer Inst 2000; 92: pp. 205-216.
34. Moneer M., El-Didi M., Khaled H.: Breast conservative surgery: is it appropriate for locally advanced breast cancer following downstaging by neoadjuvant chemotherapy? A pathological assessment. Breast 1999; 8: pp. 315-319.
35. Singletary S.E., Connolly J.L.: Breast cancer staging: working with the sixth edition of the AJCC Cancer Staging Manual. CA Cancer J Clin 2006; 56: pp. 37-47. quiz 50–31
36. Yarbro J.W., Page D.L., Fielding L.P., et. al.: American Joint Committee on Cancer Prognostic Factors Consensus Conference. Cancer 1999; 86: pp. 2436-2446.
37. Tofts P.S., Brix G., Buckley D.L., et. al.: Estimating kinetic parameters from dynamic contrast-enhanced T1-weighted MRI of a diffusable tracer: standardized quantities and symbols. J Magn Reson Imaging 1999; 10: pp. 223-232.
38. Yankeelov T.E., Rooney W.D., Li X., et. al.: Variation of the relaxographic “shutter-speed” for transcytolemmal water exchange affects the CR bolus-tracking curve shape. Magn Reson Med 2003; 50: pp. 1151-1169.
39. Dadiani M., Margalit R., Sela N., et. al.: High-resolution magnetic resonance imaging of disparities in the transcapillary transfer rates in orthotopically inoculated invasive breast tumors. Cancer Res 2004; 64: pp. 3155-3161.
40. Hassid Y., Furman-Haran E., Margalit R., et. al.: Non invasive magnetic resonance imaging of transport and interstitial fluid pressure in ectopic human lung tumors. Cancer Res 2006; 66: pp. 4159.