
Rationale and Objectives
To evaluate the role of perfusion CT for monitoring inflammatory activity in patients with aortitis and chronic periaortitis undergoing immunosuppressive therapy.
Materials and Methods
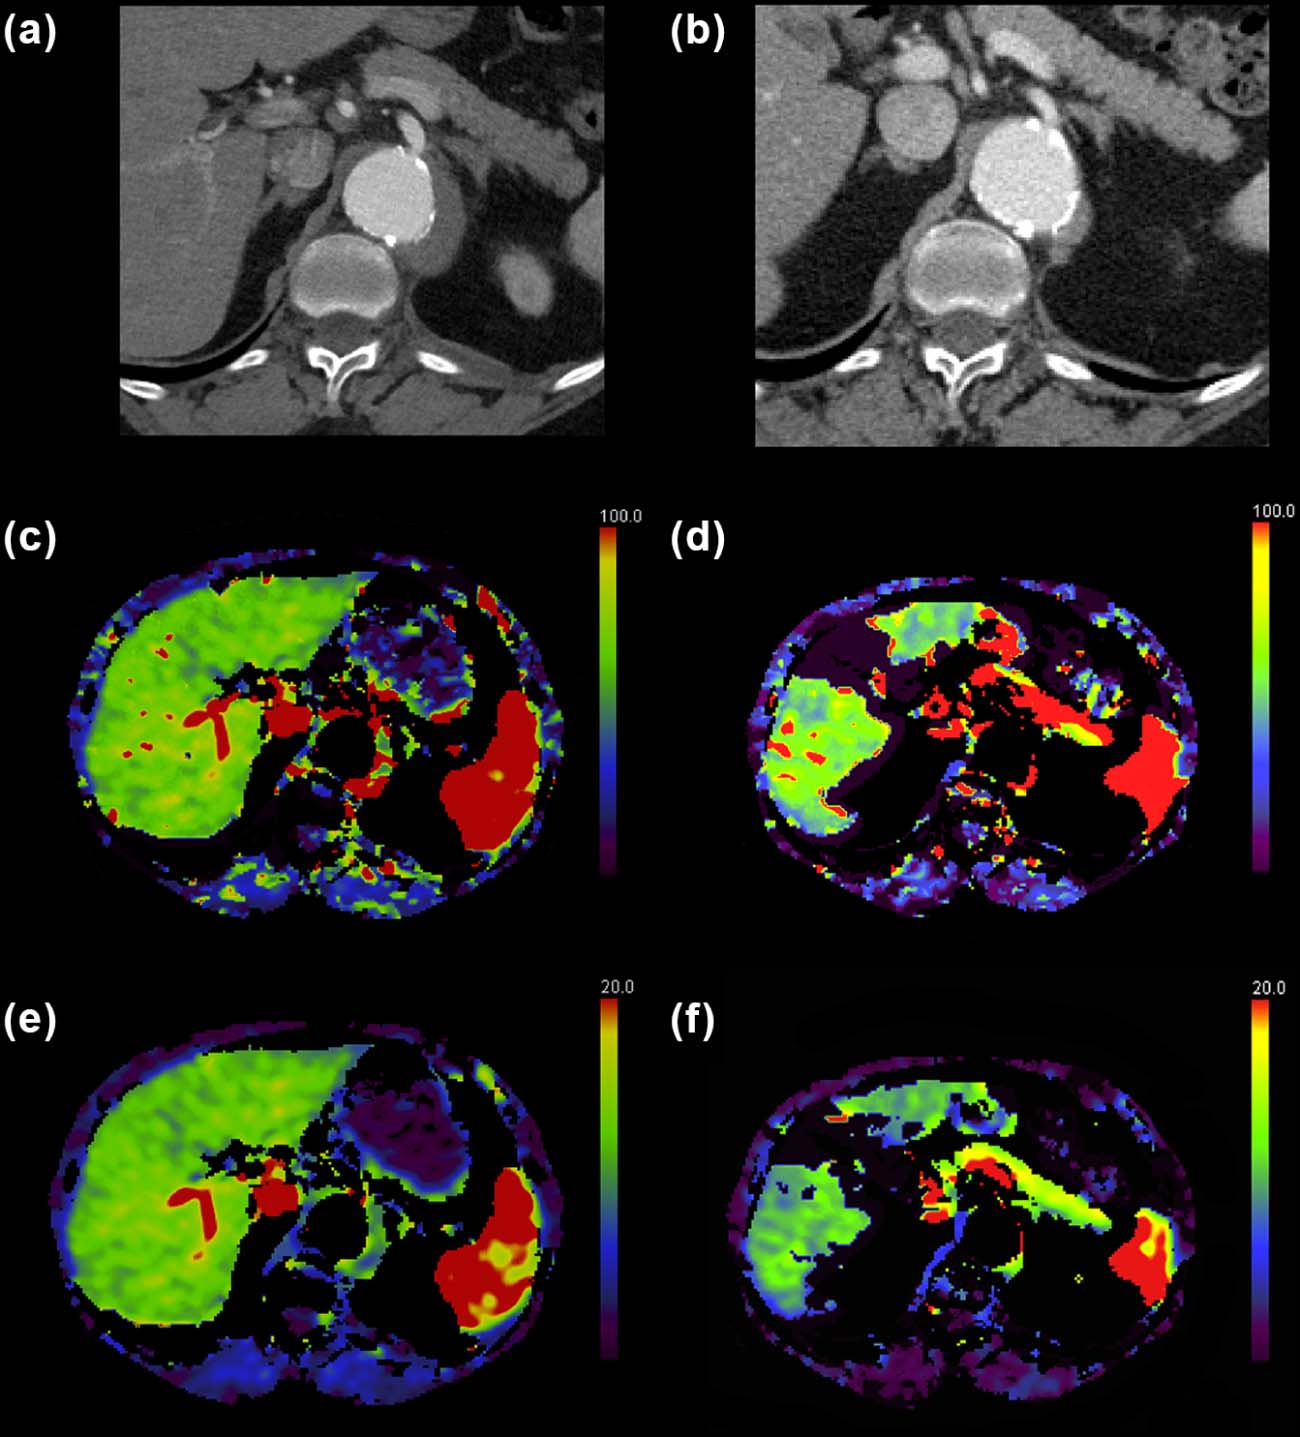
Seventeen symptomatic patients (median age 68.5 years) who underwent perfusion-based computed tomography (CT) monitoring after diagnostic contrast-enhanced CT were retrospectively included in this study. Blood flow (BF), blood volume (BV), volume transfer constant (k-trans), time to peak, and mean transit time were determined by setting circular regions of interest in prominently thickened parts of the vessel wall or perfused surrounding tissue at sites where the perfusion CT color maps showed a maximum BF value. Differences in CT perfusion and, morphological parameters, C-reactive protein (CRP), and erythrocyte sedimentation rate (ESR) were tested for significance during therapy.
Results
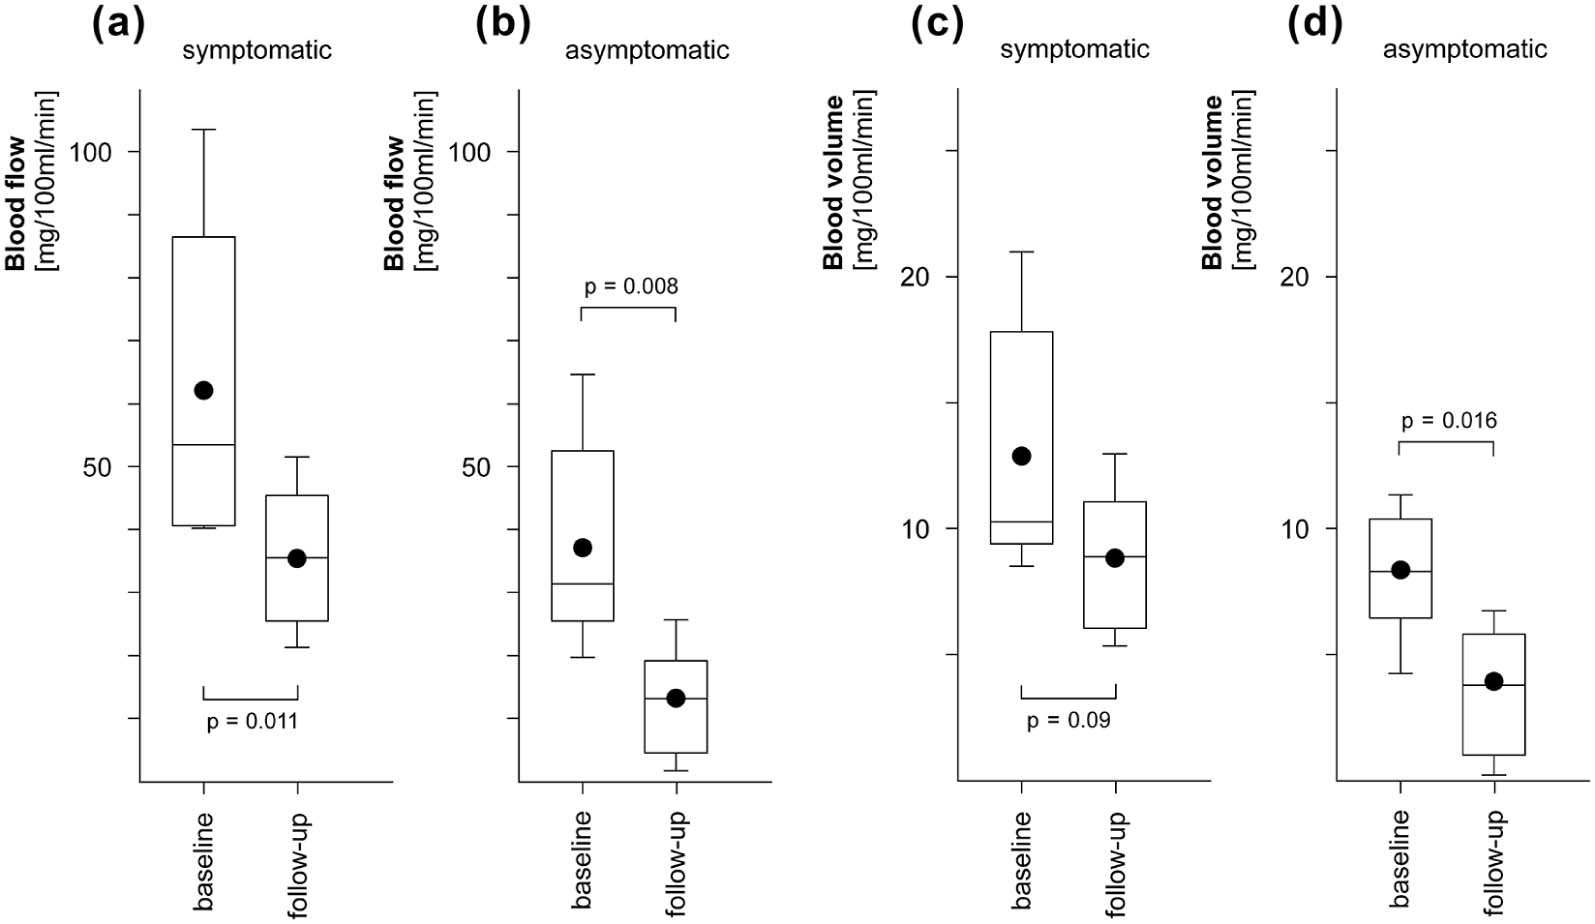
In all patients BF and BV dropped at second perfusion CT ( P < 0.05). In aortitis patients, CRP dropped from 3.86 ± 5.31 mg/dL to 0.9 ± 1.37 mg/dL and in periaortitis patients from 1.78 ± 2.25 mg/dL to 0.79 ± 1.55 mg/dL, whereas ESR dropped from 45.71 ± 37.59 seconds to 8.57 ± 3.1 seconds and 36.78 ± 34.67 seconds to 17.22 ± 21.82 seconds in aortitis and in periaortitis, respectively.
Conclusions
The course of perfusion CT parameters in aortitis and chronic periaortitis undergoing immunosuppressive therapy dropped at different extent after therapy.
Introduction
Inflammatory disorders of the large vessel walls or such arising around large vessels are rare and generally difficult to diagnose because of discrete, unspecific symptoms and poor or partially missing serologic alterations. Aortitis and periaortitis (A/PA) are all-encompassing terms ascribed to these disorders. Due to the fact that large-vessel vasculitis and periaortitic conditions are commonly autoimmune-mediated and may be associated with other, potentially severe systemic diseases, imaging plays a major role in their diagnosis. Moreover, histological proof is mostly impracticable and risky. To limit these mostly incurable pathological conditions, immunosuppressive therapy is necessary and, once a diagnosis has been verified, generally prompted.
Morphological changes such as regression of pathological vessel wall thickening or perivascular tissue formation are expected during immunosuppression, but their magnitude and temporal course are quite variable and depend on the histological substrate (eg, inflammation vs. fibrosis) . Some of the retroperitoneal fibrosis persists even after successful systemic therapy . Using serological parameters like erythrocyte sedimentation rate (ESR), C-reactive protein (CRP), and even leukocyte count has been proposed for monitoring these entities, but they can fail in up to 22% of cases, in particular in patients with PA. Moreover, these follow-up markers rapidly turn normal after onset of some novel therapeutic agents . Therefore, functional imaging techniques have advanced to the methods of choice in A/PA diagnosis, assessment of disease activity, and even therapy monitoring. Among them, magnetic resonance imaging (MRI) is capable of demonstrating vessel wall edema by increased T2-signal in the vessel wall as already reported in patients with Takayasu’s arteritis or giant cell aortitis . Complementary, contrast enhancement in postcontrast T1w MRI sequences is considered more sensitive and a surrogate for inflammation-related angiogenesis . Another very frequently applied imaging technique in this clinical setting is 18F-fludeoxyglucose positron emission tomography (FDG-PET), reported to be a highly sensitive imaging tool that increases overall diagnostic accuracy and has a beneficial impact on medical management . However, due to its high sensitivity, FDG–PET-positive findings rapidly normalize during immunosuppression (hours—few days) so that the course of the underlying autoimmune process cannot be reliably assessed anymore.
Get Radiology Tree app to read full this article<
Get Radiology Tree app to read full this article<
Materials and Methods
Patients
Get Radiology Tree app to read full this article<
Get Radiology Tree app to read full this article<
Get Radiology Tree app to read full this article<
Clinical Data
Get Radiology Tree app to read full this article<
Table 1
Patient Characteristics
Parameter_n_ = 17 % Age (64.4 ± 8.16 years) Gender Male 9 52.9 Female 8 47.1 Aortitis 5 29.4 Periaortitis 12 70.6 IAA 3 17.6 Retroperitoneal fibrosis 9 60 New diagnoses 12 70.6 Relapsing disease 5 29.4 Symptoms at baseline Abdominal pain 5 29.4 Urinary obstruction 5 29.4 Weight loss 4 23.5 Night sweats 4 23.5 Exhaustion 1 5.9 Back pain 1 5.9 Fever 1 5.9 Vertigo 1 5.9
IAA, inflammatory aortic aneurysm.
Get Radiology Tree app to read full this article<
Get Radiology Tree app to read full this article<
Laboratory Data
Get Radiology Tree app to read full this article<
CT Imaging
Get Radiology Tree app to read full this article<
Get Radiology Tree app to read full this article<
Perfusion CT Imaging
Get Radiology Tree app to read full this article<
Morphologic CT Image Analysis
Get Radiology Tree app to read full this article<
Functional Perfusion CT Image Analysis
Get Radiology Tree app to read full this article<
Get Radiology Tree app to read full this article<
Get Radiology Tree app to read full this article<
Statistics
Get Radiology Tree app to read full this article<
Get Radiology Tree app to read full this article<
Results
Clinical Data
Get Radiology Tree app to read full this article<
Laboratory Data
Get Radiology Tree app to read full this article<
Table 2
CRP and ESR Values (Median and Range) and Significance Level ( P ) at Baseline and the Second CT for Aortitis and Periaortitis
Disorder CRP Baseline (mg/dL) CRP Follow-Up (mg/dL)P ESR Baseline (mm/h) ESR Follow-Up (mm/h)P Aortitis 1.8(0.04–15.25) 0.4(0.01–4.08) 0.039 37(6–112) 8(5–12) 0.016 Periaortitis 0.8(0.05–6.87) 0.12(0.03–4.8) 0.15 22(7–99) 12(7–75) 0.09 Total 1.57(0.04–15.25) 0.22(0.01–2.08) 0.044 23.5(6–112) 9.5(5–75) 0.006
CRP, C-reactive protein; CT, computed tomography; ESR, erythrocyte sedimentation rate.
Get Radiology Tree app to read full this article<
Morphologic Image Data
Get Radiology Tree app to read full this article<
Get Radiology Tree app to read full this article<
Get Radiology Tree app to read full this article<
Functional Image Data
Get Radiology Tree app to read full this article<
Get Radiology Tree app to read full this article<
Table 3
Pairwise Correlation of VPCT, and Morphological and Serological Parameters
Parameter Mean Difference ± SD CRP ESR Diameter_r__P__r__P__r__P_ Blood flow (mL/100 mL/min) −24.85±17.62 0.04 0.9 0.02 0.95 0.15 0.63 Blood volume (mL/100 mL/min) −4.34±3.23 −0.21 0.51 −0.09 0.76 0.19 0.55 Time to peak (second) 4.35 ± 4.52 −0.46 0.13 −0.22 0.5 0.05 0.87 Mean time of transit (second) −5.33±4.45 −0.06 0.86 0.3 0.34 −0.57 0.052 k-trans (mL/100 mL/min) 10.37 ± 8.79 0.62 0.03 0.81 0.002 −0.33 0.29
CRP, C-reactive protein; ESR, erythrocyte sedimentation rate; VPCT, volume-perfusion CT.
Get Radiology Tree app to read full this article<
Get Radiology Tree app to read full this article<
Table 4
VPCT Parameters (Mean ± SD) at Baseline and Follow-Up for Aortitis Patients Plus P Values
VPCT Parameter Baseline Follow-Up_P_ Blood flow 52.94 ± 26.61 23.45 ± 18.98 0.020 Blood volume 11.21 ± 5.07 6.34 ± 4.83 0.008 Time to peak 12.15 ± 2.62 13.58 ± 2.23 0.939 Mean transit time 5.73 ± 2.99 4.38 ± 1.94 0.061 k-trans 13.41 ± 9.47 11.59 ± 7.73 0.561
VPCT, volume-perfusion CT.
VPCT values are given in mL/100 mL/min.
Table 5
VPCT Parameters (Mean ± SD) at Baseline and Follow-Up for Periaortitis Patients Plus P Values
VPCT Parameter Baseline Follow-Up_P_ Blood flow 39.11 ± 15.54 19.71 ± 11.07 0.007 Blood volume 8.32 ± 2.53 4.83 ± 2.86 0.009 Time to peak 14.05 ± 3.48 16.2 ± 6.48 0.418 Mean transit time 8.06 ± 4.07 8.82 ± 8.57 0.560 k-trans 17.13 ± 10.56 12.59 ± 10.81 0.156
VPCT, volume-perfusion CT.
VPCT values are given in mL/100 mL/min.
Get Radiology Tree app to read full this article<
Get Radiology Tree app to read full this article<
Get Radiology Tree app to read full this article<
Get Radiology Tree app to read full this article<
Discussion
Get Radiology Tree app to read full this article<
Get Radiology Tree app to read full this article<
Get Radiology Tree app to read full this article<
Get Radiology Tree app to read full this article<
Get Radiology Tree app to read full this article<
Get Radiology Tree app to read full this article<
Get Radiology Tree app to read full this article<
References
1. Restrepo C.S., Ocazionez D., Suri R., et. al.: Aortitis: imaging spectrum of the infectious and inflammatory conditions of the aorta. Radiographics 2011; 31: pp. 435-451.
2. Meller J., Grabbe E., Becker W., et. al.: Value of F-18 FDG hybrid camera PET and MRI in early Takayasu aortitis. Eur Radiol 2003; 13: pp. 400-405.
3. Spira D., Kotter I., Ernemann U., et. al.: Imaging of primary and secondary inflammatory diseases involving large and medium-sized vessels and their potential mimics: a multitechnique approach. AJR Am J Roentgenol 2010; 194: pp. 848-856.
4. Seror O., Fain O., Dordea M., et. al.: Aortitis with antiphospholipid antibodies: CT and MR findings. Eur Radiol 1998; 8: pp. 1373-1375.
5. Vaglio A., Greco P., Versari A., et. al.: Post-treatment residual tissue in idiopathic retroperitoneal fibrosis: active residual disease or silent “scar”? A study using 18F-fluorodeoxyglucose positron emission tomography. Clin Exp Rheumatol 2005; 23: pp. 231-234.
6. Loricera J., Blanco R., Castaneda S., et. al.: Tocilizumab in refractory aortitis: study on 16 patients and literature review. Clin Exp Rheumatol 2014; 32: pp. S79-S89.
7. Spira D., Xenitidis T., Henes J., et. al.: MRI parametric monitoring of biological therapies in primary large vessel vasculitides—a pilot study. Br J Radiol 2015; 89: pp. 20150892.
8. Lavado-Perez C., Martinez-Rodriguez I., Martinez-Amador N., et. al.: (18)F-FDG PET/CT for the detection of large vessel vasculitis in patients with polymyalgia rheumatica. Rev Esp Med Nucl Imagen Mol 2015; 34: pp. 275-281.
9. Heston T.F., Szabo Z.: Giant cell arteritis on 18F-FDG PET/CT. Clin Physiol Funct Imaging 2009; 29: pp. 382-384.
10. Hayashida T., Sueyoshi E., Sakamoto I., et. al.: PET features of aortic diseases. AJR Am J Roentgenol 2010; 195: pp. 229-233.
11. Bier G., Henes J., Eulenbruch C., et. al.: Perfusion-based assessment of disease activity in untreated and treated patients with aortitis and chronic periaortitis: correlation with CT morphological, clinical and serological data. Br J Radiol 2015; 88: pp. 20150526.
12. Grozinger G., Balletshofer B., Horger M.: Volume perfusion CT image of an inflammatory infrarenal aortic aneurysm. Rheumatology 2013; 52: pp. 459.
13. Litmanovich D.E., Yildirim A., Bankier A.A.: Insights into imaging of aortitis. Insights Imaging 2012; 3: pp. 545-560.
14. Palmisano A., Vaglio A.: Chronic periaortitis: a fibro-inflammatory disorder. Best Pract Res Clin Rheumatol 2009; 23: pp. 339-353.
15. Arnaud L., Haroche J., Malek Z., et. al.: Is (18)F-fluorodeoxyglucose positron emission tomography scanning a reliable way to assess disease activity in Takayasu arteritis?. Arthritis Rheum 2009; 60: pp. 1193-1200.
16. Webb M., Chambers A., Al-Nahhas A., et. al.: The role of 18F-FDG PET in characterising disease activity in Takayasu arteritis. Eur J Nucl Med Mol Imaging 2004; 31: pp. 627-634.
17. Tezuka D., Haraguchi G., Ishihara T., et. al.: Role of FDG PET-CT in Takayasu arteritis: sensitive detection of recurrences. JACC Cardiovasc Imaging 2012; 5: pp. 422-429.
18. Feinstein R.S., Gatewood O.M., Goldman S.M., et. al.: Computerized tomography in the diagnosis of retroperitoneal fibrosis. J Urol 1981; 126: pp. 255-259.
19. Weyand C.M., Goronzy J.J.: Pathogenic principles in giant cell arteritis. Int J Cardiol 2000; 75: pp. S9-S15. discussion S7–S9
20. Liozon E., Boutros-Toni F., Ly K., et. al.: Silent, or masked, giant cell arteritis is associated with a strong inflammatory response and a benign short term course. J Rheumatol 2003; 30: pp. 1272-1276.
21. Cavalcanti Filho J.L., de Souza Leao Lima R., de Souza Machado Neto L., et. al.: PET/CT and vascular disease: current concepts. Eur J Radiol 2011; 80: pp. 60-67.
22. Slobodin G., Nakhleh A., Rimar D., et. al.: Increased aortic wall thickness for the diagnosis of aortitis: a computed tomography-based study. Int J Rheum Dis 2015; 19: pp. 82-86.
23. Iino M., Kuribayashi S., Imakita S., et. al.: Sensitivity and specificity of CT in the diagnosis of inflammatory abdominal aortic aneurysms. J Comput Assist Tomogr 2002; 26: pp. 1006-1012.
24. Salvarani C., Pipitone N., Versari A., et. al.: Positron emission tomography (PET): evaluation of chronic periaortitis. Arthritis Rheum 2005; 53: pp. 298-303.
25. Bruls S., Courtois A., Nusgens B., et. al.: 18F-FDG PET/CT in the management of aortitis. Clin Nucl Med 2016; 41: pp. 28-33.
26. Loricera J., Blanco R., Hernandez J.L., et. al.: Use of positron emission tomography (PET) for the diagnosis of large-vessel vasculitis. Rev Esp Med Nucl Imagen Mol 2015; 34: pp. 372-377.
27. Kok J., Lin M., Patapanian H., et. al.: [18F]FDG PET/CT in the diagnosis of large vessel vasculitis. Intern Med J 2009; 39: pp. 267-269.
28. Kuehl H., Eggebrecht H., Boes T., et. al.: Detection of inflammation in patients with acute aortic syndrome: comparison of FDG-PET/CTimaging and serological markers of inflammation. Heart 2008; 94: pp. 1472-1477.
29. Blockmans D.: The use of (18F)fluoro-deoxyglucose positron emission tomography in the assessment of large vessel vasculitis. Clin Exp Rheumatol 2003; 21: pp. S15-S22.
30. Truijers M., Kurvers H.A., Bredie S.J., et. al.: In vivo imaging of abdominal aortic aneurysms: increased FDG uptake suggests inflammation in the aneurysm wall. J Endovasc Ther 2008; 15: pp. 462-467.
31. Caiafa R.O., Vinuesa A.S., Izquierdo R.S., et. al.: Retroperitoneal fibrosis: role of imaging in diagnosis and follow-up. Radiographics 2013; 33: pp. 535-552.
32. Wen D., Du X., Ma C.S.: Takayasu arteritis: diagnosis, treatment and prognosis. Int Rev Immunol 2012; 31: pp. 462-473.
33. Kaufmann S., Horger T., Oelker A., et. al.: Characterization of hepatocellular carcinoma (HCC) lesions using a novel CT-based volume perfusion (VPCT) technique. Eur J Radiol 2015; 84: pp. 1029-1035.
34. Yun M., Yeh D., Araujo L.I., et. al.: F-18 FDG uptake in the large arteries: a new observation. Clin Nucl Med 2001; 26: pp. 314-319.
35. Papathanasiou N.D., Du Y., Menezes L.J., et. al.: 18F-Fludeoxyglucose PET/CT in the evaluation of large-vessel vasculitis: diagnostic performance and correlation with clinical and laboratory parameters. Br J Radiol 2012; 85: pp. e188-e194.