
Rationale and Objectives
Our long-term goals are to identify imaging biomarkers for hemorrhagic shock and to understand how the preservation of cerebral microcirculation works. We also seek to understand how the damage occurs to the cerebral hemodynamics and the mitochondrial metabolism during severe hemorrhagic shock.
Materials and Methods
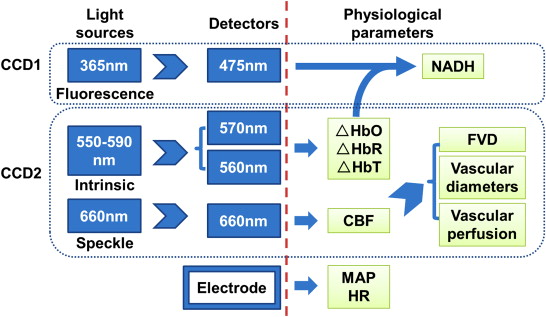
We used a multimodal cerebral cortex optical imaging system to obtain 4-hour observations of cerebral hemodynamic and metabolic alterations in exposed rat cortexes during severe hemorrhagic shock. We monitored the mean arterial pressure, heart rate, cerebral blood flow (CBF), functional vascular density (FVD), vascular perfusion and diameter, blood oxygenation, and mitochondrial reduced nicotinamide adenine dinucleotide (NADH) signals.
Results
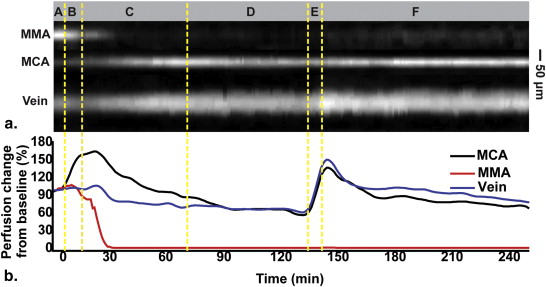
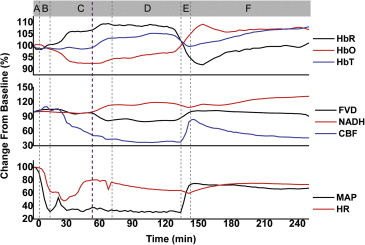
During the rapid bleeding and compensatory stage, cerebral parenchymal circulation was protected by inhibiting the perfusion of dural vessels. During the compensatory stage, although the brain parenchymal CBF and FVD decreased rapidly, the NADH signal did not show a significant increase. During the decompensatory stage, FVD and CBF maintained the same low level and the NADH signal remained unchanged. However, the NADH signal showed a significant increase after the rapid blood infusion. FVD and CBF rebounded to the baseline after the resuscitation and then declined again.
Conclusions
We present for the first time simultaneous imaging of cerebral hemodynamics and NADH signals in vivo during the process of hemorrhagic shock. This novel multimodal method demonstrated clearly that severe hemorrhagic shock imparts irreversible tissue damage that is not compensated by the autoregulatory mechanism. Hemodynamic and metabolic signatures including CBF, FVD, and NADH may be further developed to provide sensitive biomarkers for stage transitions in hemorrhagic shock.
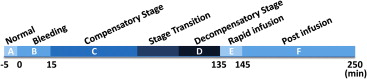
Hemorrhagic shock is a condition caused by a rapid and significant loss of intravascular volume, which may lead to hemodynamic instability, decreased tissue perfusion, cellular hypoxia, organ damage, and death . Usually, the process of hemorrhagic shock is described in three stages (or in four stages if defining an initial stage before the compensatory stage) . In the first stage (i.e., the compensatory stage) the body undergoes microcirculatory ischemia. This is characterized by compensatory hypotension during which the minimum perfusion level of vital organs is maintained by autoregulatory mechanism. In the second stage (i.e., the decompensatory stage) the body exhibits microcirculatory congestion, characterized by decompensatory hypotension that indicates the failure of autoregulatory mechanism. The last stage is the refractory stage, characterized by refractory hypotension and microcirculation failure followed by irreversible cell damage and organ failure.
Whether the cerebral circulation is protected by the autoregulatory mechanism during the process of the shock has long been controversial . Previous studies have highlighted that cerebral blood flow (CBF) in rats is maintained when mean arterial pressure (MAP) is kept between 60 and 140 mmHg . Animals would have lower MAP if they underwent a greater blood loss. Wan et al. found that the microcirculation of the cerebral cortex could be maintained after losing 35% of blood volume (MAP could be reduced to 60 mmHg or less). However, they found that the buccal microcirculation supplied by the carotid artery showed damages that are consistent with the changes in peripheral circulation. Furthermore, the protection of cerebral circulation resulting from autoregulatory mechanism may be temporary during the process of shock . The autoregulatory mechanism will show signs of failure once the blood pressure (BP) exceeds the lower threshold for an extended period .
Get Radiology Tree app to read full this article<
Get Radiology Tree app to read full this article<
Materials and methods
Animal Preparation
Get Radiology Tree app to read full this article<
Experimental Procedures
Get Radiology Tree app to read full this article<
Get Radiology Tree app to read full this article<
Imaging Instrument
Get Radiology Tree app to read full this article<
Get Radiology Tree app to read full this article<
Data Analyses
Get Radiology Tree app to read full this article<
log(Iλ0/Iλt)=μλHbRDλΔHbR+μλHbODλΔHbO. log
(
I
0
λ
/
I
t
λ
)
=
μ
HbR
λ
D
λ
Δ
HbR
+
μ
HbO
λ
D
λ
Δ
HbO
.
where λ is the light wavelength, Iλ0 I
0
λ and Iλt I
t
λ are the measured intensities of reflected light at the light wavelength λ for the baseline ( t = 0) and time t , respectively; μλHbR μ
HbR
λ and μλHbO μ
HbO
λ are absorption coefficients of oxyhemoglobin (HbO) and deoxyhemoglobin (HbR), respectively; D__λ is the differential pathlength factor, that is, the mean optical pathlength of the photons travelling in the tissue; ΔHbO, ΔHbR, and ΔHbT represent the concentration changes of oxyhemoglobin, deoxyhemoglobin, and total hemoglobin (HbT), respectively. D__λ in brain tissue was evaluated and quantified by the Monte Carlo simulation at 350 nm (∼365 nm), 480 nm (∼475 nm), 560 nm, and 570 nm using the approach of Kohl et al. and Andrew et al. . We used the simulated D__λ for 560 nm and 570 nm to compute ΔHbO, ΔHbR, and ΔHbT (ΔHbT = ΔHbO + ΔHbR) by Equation ( 1 ). The intrinsic signals (reflectance) at 350 nm and 480 nm were predicted from ΔHbO and ΔHbR using the approach of Yevgeniy et al. , and their reflected signals were then used to correct the NADH signals measured from the first CCD . CBF was obtained through online processing (customized C program) by the laser speckle temporal contrast analysis of 100 consecutive raw speckles images .
Get Radiology Tree app to read full this article<
Get Radiology Tree app to read full this article<
Results
Alterations of Hemodynamics
Get Radiology Tree app to read full this article<
Get Radiology Tree app to read full this article<
Get Radiology Tree app to read full this article<
Get Radiology Tree app to read full this article<
Get Radiology Tree app to read full this article<
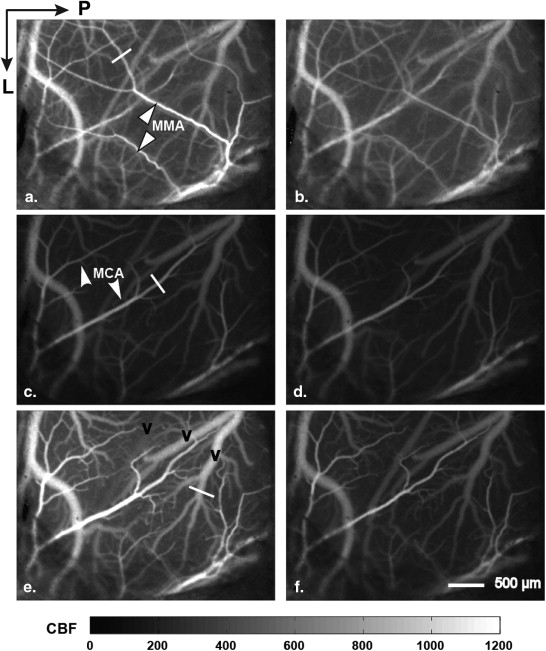
![Figure 6, Blood flow interruption observed for some vessels during the decompensatory stage. The images in the first row are intrinsic (Ref [reflectance]) signals of 560 nm and those in the second row are CBF images (CBF [cerebral blood flow]). T1–T4 indicates different time points during the decompensatory stage.](https://storage.googleapis.com/dl.dentistrykey.com/clinical/MonitoringHemodynamicandMetabolicAlterationsduringSevereHemorrhagicShockinRatBrains/5_1s20S1076633213005515.jpg)
Get Radiology Tree app to read full this article<
Get Radiology Tree app to read full this article<
Get Radiology Tree app to read full this article<
Get Radiology Tree app to read full this article<
Get Radiology Tree app to read full this article<
Alteration of Metabolism
Get Radiology Tree app to read full this article<
![Figure 9, Mean relative changes in parenchymal microcirculation (cerebral blood flow, functional vascular density, and nicotinamide adenine dinucleotide [NADH]) recorded during the process of severe hemorrhagic shock. Periods: A, baseline; B, rapid bleeding; C, compensatory stage; D, decompensatory stage; E, rapid infusion; and F, after infusion. ** P < .01, * P < .05.](https://storage.googleapis.com/dl.dentistrykey.com/clinical/MonitoringHemodynamicandMetabolicAlterationsduringSevereHemorrhagicShockinRatBrains/8_1s20S1076633213005515.jpg)
Get Radiology Tree app to read full this article<
Get Radiology Tree app to read full this article<
Get Radiology Tree app to read full this article<
Discussion
Get Radiology Tree app to read full this article<
Get Radiology Tree app to read full this article<
Get Radiology Tree app to read full this article<
Get Radiology Tree app to read full this article<
Get Radiology Tree app to read full this article<
Get Radiology Tree app to read full this article<
Get Radiology Tree app to read full this article<
Get Radiology Tree app to read full this article<
Acknowledgments
Get Radiology Tree app to read full this article<
Get Radiology Tree app to read full this article<
References
1. Gutierrez G., Reines H.D., Wulf-Gutierrez M.E.: Clinical review: hemorrhagic shock. Crit Care 2004; 8: pp. 373-381.
2. Gann D.S., Drucker W.R.: Hemorrhagic shock. J Trauma Acute Care Surg 2013; 75: pp. 888-895.
3. Spaniol J.R., Knight A.R., Zebley J.L., et. al.: Fluid resuscitation therapy for hemorrhagic shock. J Trauma Nurs 2007; 14: pp. 152-160.
4. Kovach A.G., Sandor P.: Cerebral blood flow and brain function during hypotension and shock. Annu Rev Physiol 1976; 38: pp. 571-596.
5. Taccone F.S., De Backer D.: Is cerebral microcirculation really preserved in shock states?. Crit Care Med 2010; 38: pp. 1008-1009.
6. Werner C., Lu H., Engelhard K., et. al.: Sevoflurane impairs cerebral blood flow autoregulation in rats: reversal by nonselective nitric oxide synthase inhibition. Anesth Analg 2005; 101: pp. 509-516.
7. Wan Z., Sun S.J., Ristagno G., et. al.: The cerebral microcirculation is protected during experimental hemorrhagic shock. Crit Care Med 2010; 38: pp. 928-932.
8. Golden P.F., Jane J.A.: Experimental study of irreversible shock and the brain. J Neurosurg 1973; 39: pp. 434-441.
9. Szopinski J., Kusza K., Semionow M.: Microcirculatory responses to hypovolemic shock. J Trauma 2011; 71: pp. 1779-1788.
10. Clavijo J.A., van Bastelaar J., Pinsky M.R., et. al.: Minimally invasive real time monitoring of mitochondrial NADH and tissue blood flow in the urethral wall during hemorrhage and resuscitation. Med Sci Monit 2008; 14: pp. BR175-BR182.
11. Zhao K.S., Junker D., Delano F.A., et. al.: Microvascular adjustments during irreversible hemorrhagic shock in rat skeletal muscle. Microvasc Res 1985; 30: pp. 143-153.
12. Thiemermann C., Szabo C., Mitchell J.A., et. al.: Vascular hyporeactivity to vasoconstrictor agents and hemodynamic decompensation in hemorrhagic shock is mediated by nitric oxide. Proc Natl Acad Sci USA 1993; 90: pp. 267-271.
13. Song R., Bian H., Wang X., et. al.: Mitochondrial injury underlies hyporeactivity of arterial smooth muscle in severe shock. Am J Hypertens 2011; 24: pp. 45-51.
14. Mongan P.D., Capacchione J., Fontana J.L., et. al.: Pyruvate improves cerebral metabolism during hemorrhagic shock. Am J Physiol Heart Circ Physiol 2001; 281: pp. H854-H864.
15. Li P., Ni S., Zhang L., et. al.: Imaging cerebral blood flow through the intact rat skull with temporal laser speckle imaging. Opt Lett 2006; 31: pp. 1824-1826.
16. Liu S., Li P., Luo Q.: Fast blood flow visualization of high-resolution laser speckle imaging data using graphics processing unit. Opt Express 2008; 16: pp. 14321-14329.
17. Jiang C., Zhang H., Wang J., et. al.: Dedicated hardware processor and corresponding system-on-chip design for real-time laser speckle imaging. J Biomed Opt 2011; 16: pp. 116008.
18. Pouratian N., Sheth S.A., Martin N.A., et. al.: Shedding light on brain mapping: advances in human optical imaging. Trends Neurosci 2003; 26: pp. 277-282.
19. Hillman E.M.: Optical brain imaging in vivo: techniques and applications from animal to man. J Biomed Opt 2007; 12: pp. 051402.
20. Sun X.L., Wang Y.R., Chen S.B., et. al.: Simultaneous monitoring of intracellular pH changes and hemodynamic response during cortical spreading depression by fluorescence-corrected multimodal optical imaging. Neuroimage 2011; 57: pp. 873-884.
21. Dunn A.K., Devor A., Bolay H., et. al.: Simultaneous imaging of total cerebral hemoglobin concentration, oxygenation, and blood flow during functional activation. Opt Lett 2003; 28: pp. 28-30.
22. Qiu J., Li P., Luo W., et. al.: Spatiotemporal laser speckle contrast analysis for blood flow imaging with maximized speckle contrast. J Biomed Opt 2010; 15: pp. 016003.
23. L’Heureux B., Gurden H., Pain F.: Autofluorescence imaging of NADH and flavoproteins in the rat brain: insights from Monte Carlo simulations. Opt Express 2009; 17: pp. 9477-9490.
24. Kohl M., Lindauer U., Royl G., et. al.: Physical model for the spectroscopic analysis of cortical intrinsic optical signals. Phys Med Biol 2000; 45: pp. 3749-3764.
25. Dunn A.K., Devor A., Dale A.M., et. al.: Spatial extent of oxygen metabolism and hemodynamic changes during functional activation of the rat somatosensory cortex. Neuroimage 2005; 27: pp. 279-290.
26. Prahl S. Optical Absorption of Hemoglobin. Available at: http://omlc.ogi.edu/spectra/hemoglobin/index.html .1998;1. Jan. 11, 2010.
27. Sirotin Y.B., Hillman E.M.C., Bordier C., et. al.: Spatiotemporal precision and hemodynamic mechanism of optical point spreads in alert primates. Proc Natl Acad Sci USA 2009; 106: pp. 18390-18395.
28. Schmid-Schoenbein G.W., Zweifach B.W., Kovalcheck S.: The application of stereological principles to morphometry of the microcirculation in different tissues. Microvasc Res 1977; 14: pp. 303-317.
29. White S.M., George S.C., Choi B.: Automated computation of functional vascular density using laser speckle imaging in a rodent window chamber model. Microvasc Res 2011; 82: pp. 92-95.
30. Chen S., Li P., Zeng S., et. al.: Using threshold segmentation methods to measure dynamic vasodilatation in a series of optical images. Proc SPIE 2005; pp. 151-158.
31. Nielsen A.N., Fabricius M., Lauritzen M.: Scanning laser-Doppler flowmetry of rat cerebral circulation during cortical spreading depression. J Vasc Res 2000; 37: pp. 513-522.
32. O’Farrell A.M., Rex D.E., Muthialu A., et. al.: Characterization of optical intrinsic signals and blood volume during cortical spreading depression. Neuroreport 2000; 11: pp. 2121-2125.
33. Brookes Z.L.S., Brown N.J., Reilly C.S.: Response of the rat cremaster microcirculation to hemorrhage in vivo: differential effects of intravenous anesthetic agents. Shock 2002; 18: pp. 542-548.
34. Bolay H., Reuter U., Dunn A.K., et. al.: Intrinsic brain activity triggers trigeminal meningeal afferents in a migraine model. Nat Med 2002; 8: pp. 136-142.
35. Chance B., Baltscheffsky H.: Respiratory enzymes in oxidative phosphorylation. J Biol Chem 1958; 233: pp. 736-739.
36. Chance B., Cohen P., Jobsis F., et. al.: Intracellular oxidation-reduction states in vivo. Science 1962; 137: pp. 499-508.
37. Chance B., Schoener B., Oshino R., et. al.: Oxidation-reduction ratio studies of mitochondria in freeze-trapped samples. NADH and flavoprotein fluorescence signals. J Biol Chem 1979; 254: pp. 4764-4771.
38. Mayevsky A., Rogatsky G.G.: Mitochondrial function in vivo evaluated by NADH fluorescence: from animal models to human studies. Am J Physiol Cell Physiol 2007; 292: pp. C615-C640.
39. Mayevsky A.: Mitochondrial function and tissue viability in vivo: from animal experiments to clinical applications. Forty years of fruitful collaboration with Britton Chance. J Innov Opt Health Sci 2011; 04: pp. 337-359.
40. Bradley R.S., Thorniley M.S.: A review of attenuation correction techniques for tissue fluorescence. J R Soc Interface 2006; 3: pp. 1-13.
41. Quistorff B., Haselgrove J.C., Chance B.: High spatial resolution readout of 3-D metabolic organ structure: an automated, low-temperature redox ratio-scanning instrument. Anal Biochem 1985; 148: pp. 389-400.
42. Li L.Z., Xu H.N., Ranji M., et. al.: Mitochondrial redox imaging for cancer diagnostic and therapeutic studies. J Innov Opt Health Sci 2009; 2: pp. 325-341.
43. Strandgaard S., Paulson O.B.: Cerebral autoregulation. Stroke 1984; 15: pp. 413-416.