
Rationale and Objectives
This study aimed to validate the feasibility of using virtual monochromatic spectral computed tomography (CT) with isotonic low iodine concentration contrast medium for VX2 hepatic tumors.
Materials and Methods
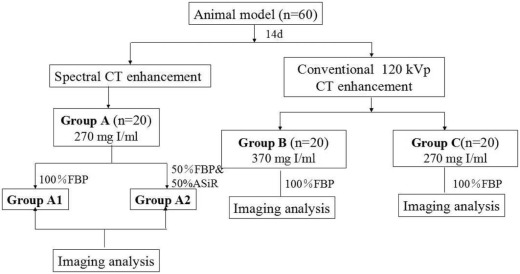
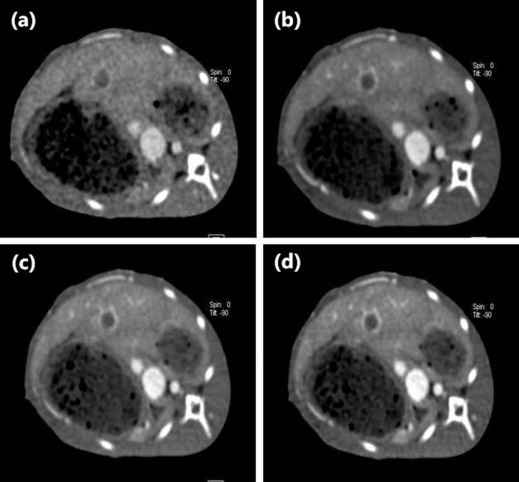
Sixty New Zealand white rabbits with implanted VX2 hepatic tumors underwent two-phase contrast-enhanced spectral CT imaging on the 14th day after tumor implantation. They were randomly divided into groups A, B, and C, with 20 rabbits each (group A: 270 mg I/mL, monochromatic spectral images; group B: 370 mg I/mL, conventional 120 kVp images, 100% filtered back projection [FBP]; group C: 270 mg I/mL, conventional 120 kVp images, 100% FBP). Group A was further divided into two subgroups (subgroup A1: 100% FBP; subgroup A2: 50% FBP + 50% adaptive statistical iterative reconstruction). Objective evaluation (signal-to-noise ratio [SNR], contrast-to-noise ratio [CNR], and image noise), subjective rating score (image noise score, anatomical details score, overall image quality score, and lesion conspicuity score), CT dose index volume, and dose length product were compared between groups during two-phase contrast enhancement. The detection rates of the four groups were calculated as percentages.
Results
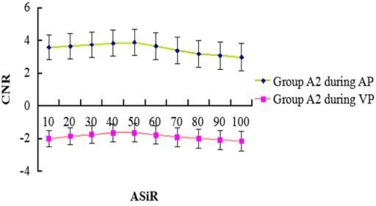
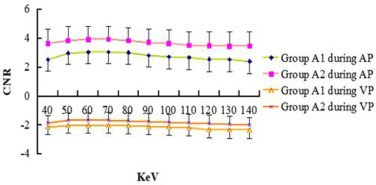
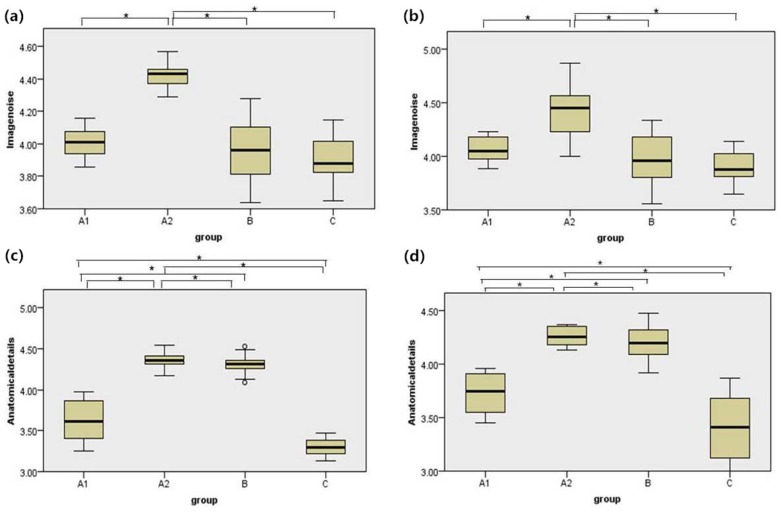
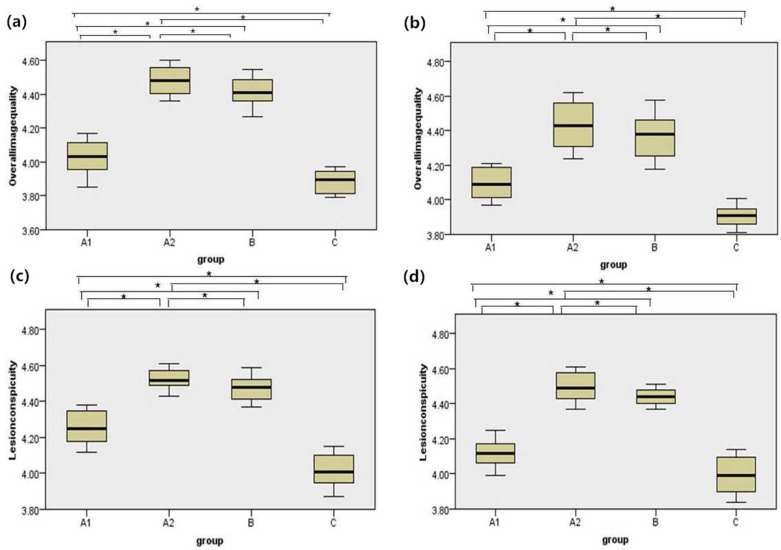
Image noise (SNR and CNR) among the four groups was statistically significant ( P < 0.05). The image noise in group A2 was lower than in group A1, but higher than that in groups B and C ( P < 0.05). SNR and CNR in group A2 were the highest, followed by group A1, and group C was the lowest ( P < 0.05 for all). The image noise score of group A2 was higher than that of the other three groups. In terms of the anatomic details score, the overall image quality score, and the lesion conspicuity score, the images of group A2 were superior to that of groups A1 and C. For hepatic tumor diameters more than or equal to 1.0 cm and less than 3.0 cm, group A achieved a higher detection rate than groups B and C. The CT dose index volume, dose length product, and effective dose in group A were significantly lower than that in groups B and C ( P < 0.05). On average, group A reduced the effective radiation dose by 27.2% compared to group B, whereas group B reduced the effective radiation dose by 28% compared to group C. Group A reduced the iodine load by 22.86% compared to group B.
Conclusions
The use of monochromatic images combined with 50% adaptive statistical iterative reconstruction with an isotonic low concentration contrast medium of 270 mg I/mL can optimize image quality, reduce image noise, increase detection rate for small tumors, and decrease radiation dose and iodine load in hepatic tumor CT examinations.
Introduction
The high iodine concentration in contrast agents or fast injection rates in computed tomography (CT) contrast-enhanced scanning can produce high-quality images; however, it can expose the patient to an increased radiation dose and place a high burden on the kidneys . McDonald et al. and Silver et al. found a close relationship between the dose of contrast agents and the occurrence of contrast-induced nephropathy. Moreover, reducing the injection dose of a contrast agent could further reduce the risk of intravenous access failure, which could especially benefit patients with poor venous access .
Currently, scholars are concerned about low-dose scanning for patients, that is, reducing the radiation dose as much as possible and still ensuring good CT image quality . Dual-energy spectral CT capable of rapidly alternating between two peak voltage settings (140 kVp and 80 kVp) allows the reconstruction of conventional polychromatic images corresponding to 140 kVp and monochromatic images with energies ranging from 40 to 140 keV, which provides the ability to reduce beam-hardening artifacts and optimize contrast with monochromatic energy . Compared to traditional filtered back projection (FBP), a new low-dose spectral scanning technique called adaptive statistical iterative reconstruction (ASiR) for spectral CT was reported to reduce image noise, improve image quality, and reduce the radiation dose during contrast-enhanced CT . Because of the upgrade of CT postprocessing software, it was feasible to reconstruct monochromatic spectral CT images using the ASiR technique.
Get Radiology Tree app to read full this article<
Materials and Methods
Animals
Get Radiology Tree app to read full this article<
Get Radiology Tree app to read full this article<
Preparation of the VX2 Tumor Cells
Get Radiology Tree app to read full this article<
A Rabbit VX2 Hepatic Tumor Model
Get Radiology Tree app to read full this article<
Spectral CT Examination
Get Radiology Tree app to read full this article<
Get Radiology Tree app to read full this article<
Get Radiology Tree app to read full this article<
Objective Image Quality Analysis
Get Radiology Tree app to read full this article<
SNR=ROIlesion/SDlesion;CNR=(ROIlesion−ROIliver)/SDliver, SNR
=
ROI
lesion
/
SD
lesion
;
CNR
=
(
ROI
lesion
−
ROI
liver
)
/
SD
liver
,
where ROI lesion and ROI liver are the mean attenuation of the lesion and the adjacent normal liver parenchyma, respectively. SD liver is the standard deviation of the pixel values from normal liver parenchyma. The SNRs and CNRs were determined for both the arterial phase and the portal venous phase.
Get Radiology Tree app to read full this article<
Subjective Image Rating Measurement
Get Radiology Tree app to read full this article<
Table 1
Criteria of Grading Scale for Subjective Image Quality
Grading Scale Image Quality Image Noise Anatomical Details Overall Image Quality Lesion Conspicuity 1 Unacceptable Blurry/Not applicable Unacceptable Nondiagnosis 2 Above average Better than average/Severe artifacts affecting diagnostic information Suboptimal Diagnosis questionable 3 Average Average/Moderate artifacts, but diagnosis still possible Average Successful detection 4 Less than average Poorer than average/Mild artifacts, but not interfering with diagnostic decision making Above average Frequent detection 5 Minimum or none Sharpest/Minimal or no artifacts Superior Well diagnosis
Get Radiology Tree app to read full this article<
Radiation Dose Analysis
Get Radiology Tree app to read full this article<
ED=k×DLP, ED
=
k
×
DLP
,
where k = 0.015 (recommended by the European Commission).
Get Radiology Tree app to read full this article<
Statistical Analysis
Get Radiology Tree app to read full this article<
Get Radiology Tree app to read full this article<
Results
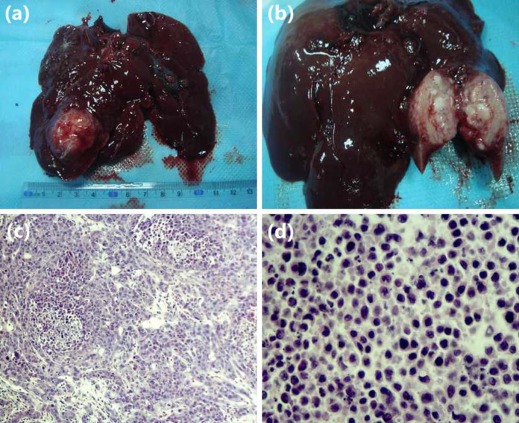
Tumor Implantation
Get Radiology Tree app to read full this article<
Get Radiology Tree app to read full this article<
Monochromatic Image
Get Radiology Tree app to read full this article<
Get Radiology Tree app to read full this article<
Objective Image Quality Analysis
Get Radiology Tree app to read full this article<
Table 2
The CT Attenuation, Objective Image Noises, SNRs, and CNRs of Lesion During AP and VP
Group Number AP VP CT Attenuation (HU) SNR CNR Image Noise (HU) CT Attenuation (HU) SNR CNR Image Noise (HU) A1 20 115.34 ± 38.04 7.70 ± 0.78 3.03 ± 0.98 15.69 ± 0.85 55.09 ± 27.10 4.74 ± 1.74 −1.99 ± 0.11 16.38 ± 0.40 A2 20 116.59 ± 55.81 8.71 ± 0.29 3.95 ± 0.76 14.68 ± 0.71 51.56 ± 31.62 5.45 ± 0.60 −1.63 ± 0.51 15.24 ± 1.03 B 20 70.08 ± 30.22 6.34 ± 0.57 2.71 ± 0.32 13.08 ± 0.41 31.27 ± 21.27 3.95 ± 0.54 −2.36 ± 0.35 14.12 ± 0.37 C 20 61.42 ± 30.80 5.89 ± 0.78 2.21 ± 0.27 13.20 ± 0.47 31.35 ± 29.51 2.96 ± 0.25 −2.76 ± 0.23 14.56 ± 0.48P value A1 vs. A2 0.947 0.000 0.000 0.002 0.787 0.001 0.031 0.000 A1 vs. B 0.004 0.000 0.000 0.000 0.011 0.000 0.020 0.000 A1 vs. C 0.001 0.000 0.000 0.000 0.012 0.000 0.000 0.000 A2 vs. B 0.003 0.000 0.000 0.000 0.022 0.000 0.000 0.000 A2 vs. C 0.001 0.000 0.000 0.000 0.023 0.000 0.000 0.024 B vs. C 0.666 0.000 0.000 0.667 0.995 0.000 0.010 0.123
AP, arterial phase; CNR, contrast-to-noise ratio; HU, Hounsfield unit; SNR, signal-to-noise ratio; VP, venous phase.
Get Radiology Tree app to read full this article<
Subjective Image Quality Analysis
Get Radiology Tree app to read full this article<
Table 3
The Image Noise Scores, Anatomical Details Scores, Overall Image Quality Scores, and Lesion Conspicuity Scores During Two Phase
Group Image Noise Score Anatomical Details Score Overall Image Quality Score Lesion Conspicuity Score AP VP AP VP AP VP AP VP A1 4.01 ± 0.97 4.17 ± 0.11 3.62 ± 0.25 3.73 ± 0.18 4.03 ± 0.10 4.10 ± 0.88 4.26 ± 0.09 4.12 ± 0.78 A2 4.42 ± 0.80 4.42 ± 0.25 4.36 ± 0.11 4.27 ± 0.57 4.48 ± 0.08 4.43 ± 0.13 4.52 ± 0.05 4.50 ± 0.08 B 3.96 ± 0.19 3.97 ± 0.24 4.31 ± 0.12 4.20 ± 0.17 4.42 ± 0.09 4.37 ± 0.13 4.47 ± 0.07 4.44 ± 0.04 C 3.90 ± 0.15 3.90 ± 0.16 3.30 ± 0.10 3.41 ± 0.31 3.88 ± 0.05 3.91 ± 0.06 4.02 ± 0.09 3.99 ± 0.10P value A1 vs. A2 0.000 0.001 0.000 0.000 0.000 0.000 0.000 0.000 A1 vs. B 0.431 0.292 0.000 0.000 0.000 0.000 0.000 0.000 A1 vs. C 0.103 0.080 0.000 0.002 0.001 0.000 0.000 0.001 A2 vs. B 0.000 0.000 0.485 0.509 0.103 0.184 0.162 0.110 A2 vs. C 0.000 0.000 0.000 0.000 0.000 0.000 0.000 0.000 B vs. C 0.374 0.454 0.000 0.000 0.000 0.000 0.000 0.000
AP, arterial phase; VP, venous phase.
Get Radiology Tree app to read full this article<
Get Radiology Tree app to read full this article<
Get Radiology Tree app to read full this article<
Detection Rate
Get Radiology Tree app to read full this article<
Table 4
The Detection Rate for Groups According to Tumor Diameters During AP and VP
Diameter Group A1 ( n = 20) Group A2 ( n = 20) Group B ( n = 20) Group C ( n = 20) AP VP AP VP AP VP AP VP d < 1 cm 4/5 4/5 4/5 4/5 3/5 3/5 2/5 2/5 1 cm ≤ d < 3 cm 7/7 7/7 7/7 7/7 7/7 7/7 6/7 6/7 d > 3 cm 8/8 8/8 8/8 8/8 8/8 8/8 8/8 8/8 Sum 19/20 19/20 19/20 19/20 18/20 18/20 16/20 16/20
AP, arterial phase; VP, venous phase.
Get Radiology Tree app to read full this article<
Radiation Dose
Get Radiology Tree app to read full this article<
Table 5
The CTDIvol, DLP, and ED for Three Groups
Parameters Group A ( n = 20) Group B ( n = 20) Group C ( n = 20) CTDIvol (mGy) 6.81 ± 1.42 \* 9.74 ± 1.23 9.85 ± 1.22 DLP(mGy/cm) 87.56 ± 3.23 \* 120.30 ± 5.00 121.27 ± 4.38 ED (mSv) 1.31 ± 0.05 \* 1.80 ± 0.08 1.82 ± 0.07
CTDIvol, CT dose index volume; DLP, dose length product; ED, effective dose.
Get Radiology Tree app to read full this article<
Get Radiology Tree app to read full this article<
Discussion
Get Radiology Tree app to read full this article<
Get Radiology Tree app to read full this article<
Get Radiology Tree app to read full this article<
Get Radiology Tree app to read full this article<
Get Radiology Tree app to read full this article<
Get Radiology Tree app to read full this article<
Conclusions
Get Radiology Tree app to read full this article<
Acknowledgments
Get Radiology Tree app to read full this article<
References
1. Leipsic J., Labounty T.M., Heilbron B., et. al.: Adaptive statistical iterative reconstruction: assessment of image noise and image quality in coronary CT angiography. AJR Am J Roentgenol 2010; 195: pp. 649-654.
2. Johnson T.R., Krauss B., Sedlmair M., et. al.: Material differentiation by dual energy CT: initial experience. Eur Radiol 2007; 17: pp. 1510-1517.
3. McDonald R.J., McDonald J.S., Bida J.P., et. al.: Intravenous contrast material-induced nephropathy: causal or coincident phenomenon?. Radiology 2013; 267: pp. 106-118.
4. Silver S.A., Shah P.M., Chertow G.M., et. al.: Risk prediction models for contrast induced nephropa: systematic review. BMJ 2015; 351: pp. h4395.
5. Liu J., Lv P.J., Wu R., et. al.: Aortic dual-energy CT angiography with low contrast medium injection rate. J Xray Sci Technol 2014; 22: pp. 689-696.
6. Choo J.Y., Goo G.M., Lee C.H., et. al.: Quantitative analysis of emphysema and airway measurements according to iterative reconstruction algorithms: comparison of filtered back projection, adaptive statistical iterative reconstruction and model-based iterative reconstruction. Eur Radiol 2014; 24: pp. 799-806.
7. Kanagaraj K., Abdul Syed Basheerudeen S., Tamizh Selvan G., et. al.: Assessment of dose and DNA damages in individuals exposed to low dose and low dose rate ionizing radiations during computed tomography imaging. Mutat Res Genet Toxicol Environ Mutagen 2015; 789–790: pp. 1-6.
8. Kim K.S., Lee J.M., Kim S.H., et. al.: Image fusion in dual energy computed tomography for detection of hypervascular liver hepatocellular carcinoma: phantom and preliminary studies. Invest Radiol 2010; 45: pp. 149-157.
9. Yamada Y., Jinzaki M., Hosokawa T., et. al.: Abdominal CT: an intra-individual comparison between virtual monochromatic spectral and polychromatic 120-kVp images obtained during the same examination. Eur J Radiol 2014; 83: pp. 1715-1722.
10. Lv P., Lin X.Z., Chen K., et. al.: Spectral CT in patients with small HCC: investigation of image quality and diagnostic accuracy. Eur Radiol 2012; 22: pp. 2117-2124.
11. Jiang H.J., Xu K., Zhang H.B., et. al.: In vivo assessment of neovascularization of rabbit VX2 liver tumor by multi-slice CT perfusion. Chin J Med Imaging Technol 2007; 23: pp. 967-970.
12. Pinho D.F., Kulkarni N.M., Krishnaraj A., et. al.: Initial experience with single-source dual-energy CT abdominal angiography and comparison with single-energy CT angiography: image quality, enhancement, diagnosis and radiation dose. Eur Radiol 2013; 23: pp. 351-359.
13. Zhao L.Q., He W., Li J.Y., et. al.: Improving image quality in portal venography with spectral CT imaging. Eur J Radiol 2012; 81: pp. 1677-1681.
14. Lee C.W., Song J.W., Seo J.B., et. al.: Evaluation of computer-aided detection and dual energy software in detection of peripheral pulmonary embolism on dual-energy CTPA. Eur Radiol 2011; 21: pp. 54-62.
15. Hough C.L., Lieu B.K., Caldwell E.S.: Manual muscle strength testing of critically ill patients: feasibility and interobserver agreement. Crit Care 2011; 15: pp. R43.
16. Mackay A., Weigelt B., Grigoriadis A., et. al.: Microarray-based class discovery for molecular classification of breast cancer: analysis of interobserver agreement. J Natl Cancer Inst 2011; 103: pp. 662-673.
17. Yoon H.J., Chung M.J., Hwang H.S., et. al.: Adaptive statistical iterative reconstruction-applied ultra-low-dose CT with radiography-comparable radiation dose: usefulness for lung nodule detection. Korean J Radiol 2015; 16: pp. 1132-1141.
18. Behrendt F.F., Schmidt B., Plumhans C., et. al.: Image fusion in dual-energy computed tomography: effect on contrast enhancement, signal-to-noise ratio and image quality in computed tomography angiography. Invest Radiol 2009; 44: pp. 1-6.
19. Davenport M.S., Khalatbari S., Dillman J.R., et. al.: Contrast material-induced nephrotoxicity and intravenous low-osmolality iodinated contrast material. Radiology 2013; 267: pp. 94-105.
20. Lakhal K., Ehrmann S., Chaari A., et. al.: Acute Kidney Injury Network definition of contrast-induced nephropathy in the critically ill: incidence and outcome. J Crit Care 2011; 26: pp. 593-599.
21. Funama Y., Taguchi K., Utsunomiya D., et. al.: Image quality assessment of an iterative reconstruction algorithm applied to abdominal CT imaging. Phys Med 2014; 30: pp. 527-534.
22. Shampain K.L., Davenport M.S., Cohan R.H., et. al.: Effect of model-based iterative reconstruction on CT number measurements within small (10–29 mm) low-attenuation renal masses. AJR Am J Roentgenol 2015; 205: pp. 85-89.
23. You J., Dai Y., Huang N., et. al.: Low-dose computed tomography with adaptive statistical iterative reconstruction and low tube voltage in craniocervical computed tomographic angiography: impact of body mass index. J Comput Assist Tomogr 2015; 39: pp. 774-780.
24. Padole A., Ali Khawaja R.D., Kalra M.K., et. al.: CT radiation dose and iterative reconstruction techniques. AJR Am J Roentgenol 2015; 204: pp. W384-W392.
25. Sun G., Hou Y.B., Zhang B., et. al.: Application of low tube voltage coronary CT angiography with low-dose iodine contrast agent in patients with a BMI of 26–30 kg/m 2 . Clin Radiol 2015; 70: pp. 138-145.
26. Yu Y., He N., Sun K., et. al.: Differentiating hepatocellular carcinoma from angiomyolipoma of the liver with CT spectral imaging: a preliminary study. Clin Radiol 2013; 68: pp. e491-e497.
27. Yu Y., Lin X., Chen K., et. al.: Hepatocellular carcinoma and focal nodular hyperplasia of the liver: differentiation with CT spectral imaging. Eur Radiol 2013; 23: pp. 1660-1668.