
Rationale and Objectives
Anterior/posterior commissure reference system (AC/PC reference system) and the fastigium/ventricular floor plane reference system (FFL/VFL reference system) are two reference systems used in the stereotactic localization of the invisible nuclei of the brainstem in magnetic resonance (MR) images. This study investigated the variation of the midsagittal brainstem in relation to the AC/PC and VFL/FFL reference systems with respect to age and gender.
Materials and Methods
High-resolution T1-weighted structural MR images were acquired from 64 adults (age range 21–60 years, 32 males and 32 females). The AC/PC and VFL/FFL reference systems were identified automatically. A set of landmarks of the midsagittal brainstem were defined and localized interactively.
Results
Results illustrated that there was significant difference between the variance of the anteroposterior coordinate of the landmarks in relation to the AC/PC reference system and that in relation to the FFL/VFL reference system ( P < .05), the former is larger than the latter. The positions of the landmarks in the females are more anterior than those in the males in relation to the AC/PC reference ( P < .05); the difference in relation to the FFL/VFL reference system was not found.
Conclusion
Either the FFL/VFL reference system or the AC/PC reference system has its own advantage in the stereotactic localization of the structure in the brainstem.
The brainstem comprises mesencephalon, pons, and medulla , which play crucial roles in regulating cardiac, respiratory, and central nervous system function and maintaining consciousness. However, because of the deep location and invisibility of some nuclei in the brainstem in common neuroimages, the brainstem has always been considered a dangerous stereotactic field. Indeed, the safe approach to most of the brainstem targets is still a major challenge even for the skilled neurosurgeons . Neurosurgeons always consult a reference system when locating the invisible nuclei.
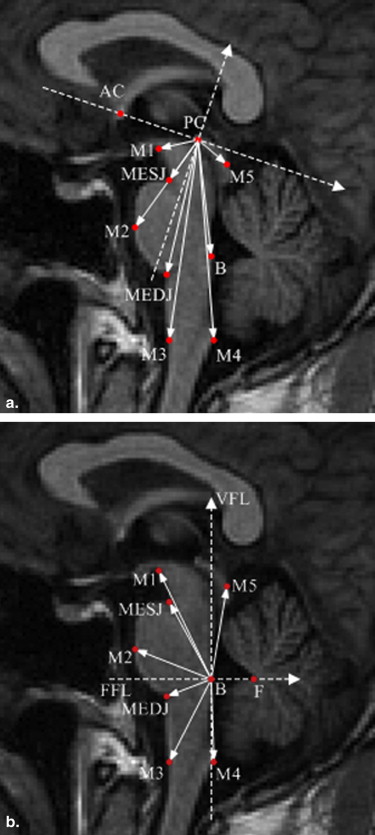
Currently, there are two reference systems are used in the stereotactic field: the anterior/posterior commissure (AC/PC) reference system and the fastigium/ventricular floor plane (FFL/VFL) reference system. The AC/PC and FFL/VFL reference systems are derived from two stereotactic atlases: the Talairach and Afshar , respectively. Figure 1 shows the definitions of these two reference systems on the midsagittal plane (MSP): the AC/PC reference system based on AC and PC, and the FFL/VFL reference system based on the fastigial point (F) of the fourth ventricle and the VFL. Their spatial relationship was analyzed using x-ray images by Hitchcock et al . Niemann et al compared imaging findings of the brainstem to Afshar’s atlas, and found that the FFL in magnetic resonance (MR) images was often displaced in a more caudal location than that predicted by the atlas. These findings cast some doubt on the suitability of the FFL/VFL reference system as an appropriate landmark for stereotactic localization. Zrinzo et al reported that the anteroposterior coordinate of the caudal pole of pedunculopontine nucleus in the brainstem has a significantly greater variance in relation to the AC/PC reference system than to the VFL/FFL reference system ( F -test: P < .001). The study of the location in the brainstem is still undergoing. However, to the best of our knowledge, there is no quantitative morphometric analysis of the brainstem in relation to these two reference systems using MR images.
 Open full size image
Figure 1
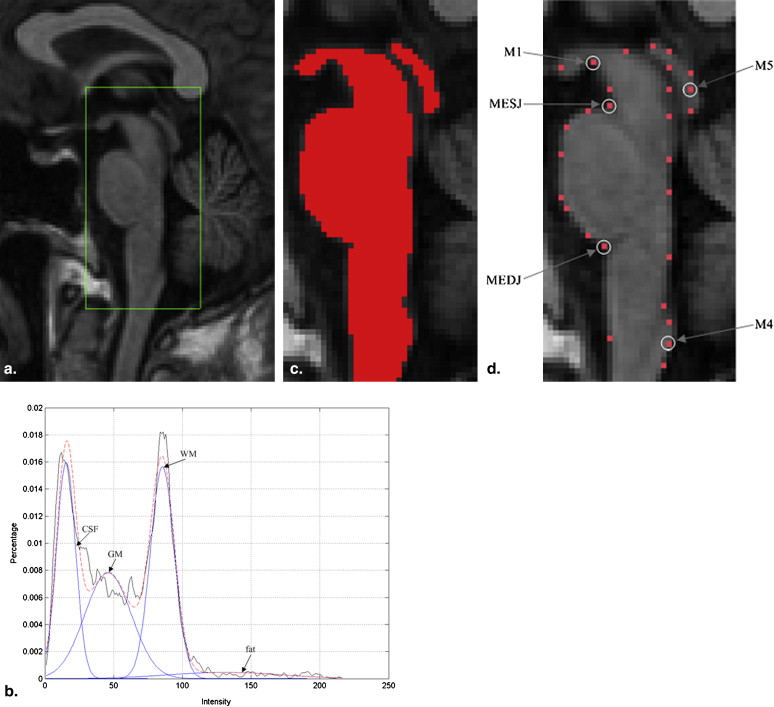
Scheme of two reference systems defined on the MSP. AC, anterior commissure point; PC, posterior commissure point, origin of the AC/PC reference system; VFL, ventricular floor line, midsagittal tangent to the rhomboid fossa; F, fastigial point of the fourth ventricle; FFL, fastigial floor line, perpendicular to the VFL though the F; B, origin of the FFL/VFL reference system. MESJ, pontomesencephalic junction; MEDJ, pontomedullary junction; M1, inferior corner between the mesencephalon and the hypothalamus; M2, edge point on the line passing the center between MESJ and MEDJ and perpendicular to the VFL; M4, posterior corner between the medulla and spinal cord; M3, edge point on the line passing M4 and perpendicular to the centerline of the medulla; M5, midpoint between the superior and inferior colliculi.
Get Radiology Tree app to read full this article<
Get Radiology Tree app to read full this article<
Get Radiology Tree app to read full this article<
Materials and Methods
Data Overview
Subjects
Get Radiology Tree app to read full this article<
Get Radiology Tree app to read full this article<
Image acquisition
Get Radiology Tree app to read full this article<
Method
Definition of the landmarks
Get Radiology Tree app to read full this article<
Localization of the landmarks
Get Radiology Tree app to read full this article<
Stage 1: Identification of the reference systems
Get Radiology Tree app to read full this article<
Stage 2: Extraction of the midsagittal brainstem
Get Radiology Tree app to read full this article<
Get Radiology Tree app to read full this article<
Get Radiology Tree app to read full this article<
Get Radiology Tree app to read full this article<
ε=∣∣∑4i=1kiG(ui,σi)−H∣∣ ε
=
|
∑
i
=
1
4
k
i
G
(
u
i
,
σ
i
)
−
H
|
Get Radiology Tree app to read full this article<
Get Radiology Tree app to read full this article<
Get Radiology Tree app to read full this article<
Stage 3: Localization of the candidates of the landmark
Get Radiology Tree app to read full this article<
Stage 4: Selection of the best position of the landmark
Get Radiology Tree app to read full this article<
Get Radiology Tree app to read full this article<
Statistical analysis
Get Radiology Tree app to read full this article<
Get Radiology Tree app to read full this article<
Results
Get Radiology Tree app to read full this article<
Accuracy
Get Radiology Tree app to read full this article<
Table 1
Statistics of the Location Error of Each Landmark (Unit:mm)
M1 MESJ MEDJ M2 M3 M4 M5 Average 0.6 0.5 0.5 0.9 0.9 0.8 0.7 Maximum 1.6 1.3 1.5 2.2 2.3 1.9 1.7
M1, inferior corner between the mesencephalon and the hypothalamus; MESJ, pontomesencephalic junction; MEDJ, pontomedullary junction; M2, edge point on the line passing the center between MESJ and MEDJ and perpendicular to the VFL; M3, edge point on the line passing M4 and perpendicular to the centerline of the medulla; M4, posterior corner between the medulla and spinal cord; M5, midpoint between the superior and inferior colliculi.
Get Radiology Tree app to read full this article<
Intra- and Inter-observer Variation
Get Radiology Tree app to read full this article<
Normal Ranges
Get Radiology Tree app to read full this article<
Table 2
Statistics of the AP and SI Coordinate of each Landmark in Relation to the AC/PC Reference System (Unit:mm)
Landmarks Parameters Mean SD Maximum Minimum M1 AP −11.50 1.03 −9.03 −14.14 SI −6.18 0.9 −4.48 −8.16 MESJ AP −4.37 1.53 −1.70 −7.23 SI −14.31 1.45 −11.36 −17.53 MEDJ AP 1.18 3.14 9.16 −6.33 SI −39.13 2.81 −32.5 −43.98 M2 AP −10.09 2.60 −5.23 −16.64 SI −28.93 2.33 −23.39 −34.68 M3 AP 9.39 3.82 19.22 0.32 SI −53.35 3.62 −43.20 −60.69 M4 AP 19.56 3.49 28.85 10.22 SI −48.33 3.60 −38.61 −56.79 M5 AP 8.82 0.93 10.83 6.89 SI −4.88 0.97 −2.74 −7.35 B AP 12.19 2.39 17.71 6.59 SI −26.70 2.58 −21.50 −31.96
+, posterior or superior; −, anterior or inferior; AP, anteroposterior; SI, superoinferior; AC/PC, anterior/posterior commissure reference system. All other abbreviations as in Table 1 .
Table 3
Statistics of the AP and SI Coordinate of Each Landmark in Relation to the FFL/VFL Reference System (Unit:mm)
Landmarks Parameters Mean SD Maximum Minimum M1 AP −16.98 1.86 −13.08 −20.12 SI 26.29 3.39 33.30 19.90 MESJ AP −12.43 1.18 −9.55 −14.71 SI 16.49 2.27 21.52 11.78 MEDJ AP −13.97 1.30 −10.79 −16.65 SI −8.94 2.68 −2.95 −15.79 M2 AP −22.00 1.50 −18.14 −25.25 SI 3.99 2.51 9.08 −1.45 M3 AP −10.01 1.74 −5.27 −14.10 SI −24.88 3.13 −19.17 −33.85 M4 AP 1.15 1.25 5.76 −1.46 SI −22.85 2.78 −15.57 −29.04 M5 AP 2.85 1.18 5.84 0.05 SI 21.93 2.27 25.82 17.15
FFL/VFL, fastigium/ventricular floor plane reference system. All other abbreviations as in Tables 1 and 2 .

Get Radiology Tree app to read full this article<
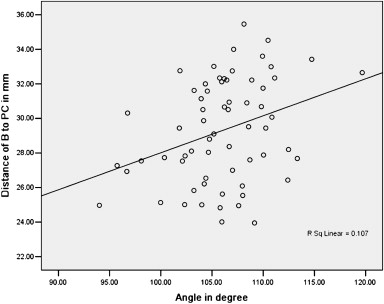
Relationship between the Two Reference Systems
Get Radiology Tree app to read full this article<
Table 4
Statistics of the Angle between the Anterior/Posterior Commissure Line and the Ventricular Floor Plane (Unit:degree)
Minimum Maximum Mean Standard Deviation Angle 94.00° 119.67° 106.04° 4.63°
Get Radiology Tree app to read full this article<
Variations in the Two Reference Systems
Get Radiology Tree app to read full this article<
Table 5
Variance of the AP and SI Coordinates of Each Landmark in Relation to the AC/PC and FFL/VFL Reference System, Respectively (Unit:mm)
Variance (AP) Variance (SI) Landmarks AC/PC VFL/FFL_P_ value AC/PC VFL/FFL_P_ Value M1 1.0 1.9 .0 ∗∗ 0.9 3.4 .0 ∗∗ MESJ 1.5 1.1 .006 ∗ 1.4 2.7 .0 ∗∗ M2 2.6 1.5 .0 ∗∗ 2.3 2.5 .447 (>.05) MEDJ 3.1 1.3 .0 ∗∗ 2.8 2.7 .627 (>.05) M3 3.8 1.7 .0 ∗∗ 3.6 3.1 .346 (>.05) M4 3.5 1.2 .0 ∗∗ 3.6 2.8 .084 (>.05) M5 0.9 1.2 .185 (>.05) 1.0 2.3 .00 ∗∗
Abbreviations as in Tables 1 and 2 .
Get Radiology Tree app to read full this article<
Get Radiology Tree app to read full this article<
Get Radiology Tree app to read full this article<
Get Radiology Tree app to read full this article<
Table 6
Pearson’s Linear Correlation Matrix (R-matrix) for the Age, the Angle between VFL and AC-PC line, and the Distance of each Landmark to PC and B

Abbreviations as in Tables 1 and 2 .
Dark shade cell-correlation is significant at the 0.01 level (two-tailed).
Light shade cell-correlation is significant at the 0.05 level (two-tailed).
Table 7
Significance Matrix (P-matrix)

Abbreviations as in Tables 1 and 2 .
Light shade cell-correlation is significant at the 0.05 level (two-tailed).
Dark shade cell-correlation is significant at the 0.01 level (two-tailed).
Get Radiology Tree app to read full this article<
Effect of Gender
Get Radiology Tree app to read full this article<
Table 8
Difference in the Mean of the AP and SI Coordinate of Each Landmark in Relation to the AC/PC Reference System between Males and Females (Unit:mm)
Mean (AP) Mean (SI) Landmarks Males Females_P_ Value Males Females_P_ Value M1 −11.3 −11.7 .107 −6.1 −6.3 .270 MESJ −3.7 −5.0 .0 ∗∗ −14.5 −14.1 .294 M2 −9.1 −11.0 .001 ∗ −29.4 −28.5 .134 MEDJ 2.5 −0.1 .003 ∗ −39.6 −38.7 .191 M3 10.9 7.9 .002 ∗ 10.9 7.9 .244 M4 21.0 18.1 .001 ∗ −48.9 −47.8 .245 M5 9.1 8.5 .008 ∗ −4.8 −4.8 .989 B 11.3 13.1 .002 ∗ −26.6 −26.8 .756
Abbreviations as in Tables 1 and 2 .
Get Radiology Tree app to read full this article<
Get Radiology Tree app to read full this article<
Get Radiology Tree app to read full this article<
Get Radiology Tree app to read full this article<
Table 9
Difference in the Mean of the AP and SI Coordinate of Each Landmark in Relation to the FFL/VFL Reference System between Males and Females (Unit:mm)
Mean (AP) Mean (SI) Landmarks Males Females_P_ Value Males Females_P_ Value M1 −17.1 −16.9 .647 27.0 25.5 .084 MESJ −12.4 −12.5 .745 16.7 16.3 .508 M2 −22.0 −22.0 .86 4.1 3.9 .823 MEDJ −13.8 −14.1 .407 −9.2 −8.7 .528 M3 −10.1 −10.0 .814 −25.3 −24.5 .311 M4 1.1 1.2 .641 −23.4 −22.3 .094 M5 2.7 3.0 .468 22.2 21.7 .429
Abbreviations as in Tables 1 and 2 .
∗ P < .05.
∗∗ P < .001.
Get Radiology Tree app to read full this article<
Get Radiology Tree app to read full this article<
Discussion
Get Radiology Tree app to read full this article<
Get Radiology Tree app to read full this article<
Get Radiology Tree app to read full this article<
Get Radiology Tree app to read full this article<
Limitations
Get Radiology Tree app to read full this article<
Get Radiology Tree app to read full this article<
Conclusion
Get Radiology Tree app to read full this article<
Get Radiology Tree app to read full this article<
Get Radiology Tree app to read full this article<
References
1. Duvernoy H.M., Bonneville J.F.: The human brainstem and cerebellum: surface, structure, vascularization, and three-dimensional sectional anatomy with MRI.1995.Springer-VerlagNew York
2. Coffey R.J., Lunsford L.D.: Stereotactic surgery for mass lesions of the midbrain and pons. Neurosurgery 1985; 17: pp. 12-18.
3. Yelnik J.: PPN or PPD, what is the target for deep brain stimulation in Parkinson’s disease?. Brain 2007; 130: pp. e79.
4. Talairach J., Tournoux P.: Coplanar stereotactic atlas of the human brain.1988.Thieme Medical PublishersNew York
5. Afshar F., Watkins E.S., Yap J.C.: Stereotaxic atlas of the human brainstem and cerebellar nuclei. A variability study.1978.Raven PressNew York
6. Hitchcock E., Oppitz P., Donaldson A.A.: Relationships between portions of the third and fourth ventricles: An aid to stereotactic accuracy for posterior fossa stereotaxy. Neuroradiology 1978; 15: pp. 197-199.
7. Niemann K., Boom R., Haeselbarth K., et. al.: A brainstem stereotactic atlas in a three-dimensional magnetic resonance imaging navigation system: first experiences with atlas-to-patient registration. J Neurosurg 1999; 90: pp. 891-901.
8. Zrinzo L., Zrinzo L.V., Tisch S., et. al.: Stereotactic localization of the human pedunculopontine nucleus: atlas-based coordinates and validation of a magnetic resonance imaging protocol for direction localization. Brain 2008; 131: pp. 1588-1598.
9. Jerzy S., Akiko I., Ryan J.U., et. al.: MR imaging of brainstem atrophy in progressive supranuclear palsy. J Neurol 2008; 255: pp. 37-44.
10. Chida K., Goto N., Kamikura I., et. al.: Quantitative evaluation of pontine atrophy using computer tomography. Neuroradiology 1989; 31: pp. 13-15.
11. Andreas R.L., Martin S., Jörg B.S., et. al.: Patterns of age-related shrinkage in cerebellum and brainstem observed in vivo using three-dimensional MRI volumetry. Cerebral Cortex 1999; 9: pp. 712-721.
12. Bloomer C.W., Langleben D.D., Meyerhoff D.J.: Magnetic resonance detects brainstem changes in chronic, active heavy drinkers. Psychiatry Res: Neuroimaging 2004; 132: pp. 209-218.
13. Raininko R., Autti T., Vanhanen S.L., et. al.: The normal brain stem from infancy to old age: a morphometric MRI study. Neuroradiology 1994; 36: pp. 364-368.
14. Hu Q., Nowinski W.L.: A rapid algorithm for robust and automatic extraction of the midsagittal plane of the human cerebrum from neuroimages based on local symmetry and outlier removal. NeuroImage 2003; 20: pp. 2153-2165.
15. Ardekani B.A., Bachman A.H.: Model-based automatic detection of the anterior and posterior commissures on MRI scans. NeuroImage 2009; 46: pp. 677-682.
16. Fu Y., Gao W., Chen X., et. al.: Automatic identification of the reference system based on the fourth ventricular landmarks in T1-weighted MR images. Academic Radiology 2010; 17: pp. 67-74.
17. Harris C., Stephens M.: A combined corner and edge detector. Proc Fourth Alvey Vision Conference 1998; pp. 147-151.
18. Fu Y., Gao W., Zhu M., et. al.: Computer-assisted automatic localization of the human pedunculopontine nucleus in T1-weighted MR images: a preliminary study. International Journal of Medical Robotics and Computer Assisted Surgery 2009; 5: pp. 309-318.
19. Oguro H., Okada K., Yamaguchi S., et. al.: Sex differences in morphology of the brain stem and cerebellum with normal ageing. Neuroradiology 1998; 40: pp. 788-792.