
Rationale and Objectives
To assess the performance, postprocessing time, and intra- and interobserver agreement of a simple magnetic resonance–based mapping technique to quantify liver fat.
Materials and Methods
This prospective, single-center study included 26 patients who were overweight with type 2 diabetes and at risk for nonalcoholic fatty liver disease. Mapping of the liver was based on a triple echo gradient-echo sequence, and 1 H magnetic resonance spectroscopy was used as the reference standard. The nonparametric Spearman correlation coefficient and the Wilcoxon test were used for comparisons between mapping and spectroscopy. The mapping was assessed for its predictive performance using the area under the curve of a receiver operating characteristic curve. Intraclass correlation coefficients were used to calculate intra- and interobserver’s agreement for mapping measurements.
Results
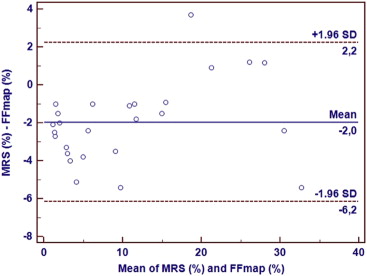
Patients had a mean fat percentage of 11.7% (range, 2–35.4%). A strong correlation was seen between mapping and spectroscopy ( r = 0.89, P < .0001). A cutoff of 6.9% for fat fraction mapping was found to diagnose steatosis with 93% sensitivity and 100% specificity with an area under the curve of 0.99. Mapping of the liver had shorter acquisition and post-processing times than spectroscopy (5 min vs. 38 min; P < .0001). Mapping measurements had an intra- and interobserver agreement of 0.98 and 0.99, respectively.
Conclusions
The magnetic resonance–based liver mapping can accurately quantify liver fat with a cutoff value of 6.9% and excellent intra- and interobserver agreement. This mapping technique, with its simple methodology and short postprocessing time, has the potential to be included in routine abdominal protocols.
Nonalcoholic fatty liver disease is being increasingly recognized as a disease associated to liver-related morbidity and even mortality in the western countries. Its prevalence has been rising in the past two decades to become the leading cause of chronic liver disease, being closely associated to insulin resistance and type 2 diabetes . This chronic liver disease includes not only bland steatosis but also steatohepatitis, which can progress to fibrosis, cirrhosis, and ultimately hepatocellular carcinoma . Although early stages of liver steatosis may be reversible, patients can progress to nonalcoholic steatohepatitis even without any proven inflammation or cell injury . Liver biopsy is the current gold standard for diagnosing nonalcoholic fatty liver disease and quantifying liver fat. However, its invasive nature limits the use for screening or follow-up of nonalcoholic fatty liver disease patients . Alternative noninvasive imaging methods, such as magnetic resonance spectroscopy (MRS) and multiecho (≥6 echos) gradient-echo imaging with or without fat spectral modeling, have been used to accurately quantify liver fat . However, they are time-consuming and require the use of extensive logarithmic calculations. Yokoo et al have recently found no significant differences between triple echo gradient-echo imaging and the more complex methods for fat quantification. Therefore, the purpose of our study was to 1) assess the performance and specific cutoff value of a simple MR-based mapping technique for liver fat quantification at 1.5-T in patients at risk for nonalcoholic fatty liver disease, 2) quantify the time it can add to routine clinical practice abdominal protocols and 3) assess its intra- and interobserver reproducibility.
Materials and methods
Study Design and Patients
This prospective, single-center study was approved by the review board at our institution and written informed consent was obtained for all patients. Between May 2010 and June 2011, a screening program was initiated at the department of endocrinology using the following inclusion criteria: age 18 years and older, overweight with type 2 diabetes, at risk for nonalcoholic fatty liver disease, and absence of a clinical history or biochemical data consistent with hepatitis, cirrhosis, or hemochromatosis. A total of 32 patients were initially included in the study protocol that consisted of liver MR imaging at 1.5-T (Magnetom Symphony, Siemens Healthcare, Erlangen, Germany), using a four-element surface coil, performing triple echo gradient-echo T1-weighted MR imaging, from which the fat fraction mapping was processed, and 1 H MRS, used as the reference standard. Six patients were excluded for the following reasons: two patients because of technical failure during the MRS acquisition, two had uninterpretable spectra, and two missed the scheduled MR imaging. The final study population consisted of 26 patients, 6 men and 20 women, with a mean age of 47 years (range, 28–70 for women; 25–55 years for men). The mean body mass index was 36.2 kg/m 2 (range, 25–44 kg/m 2 for women; 33–48 kg/m 2 for men).
Magnetic Resonance Imaging
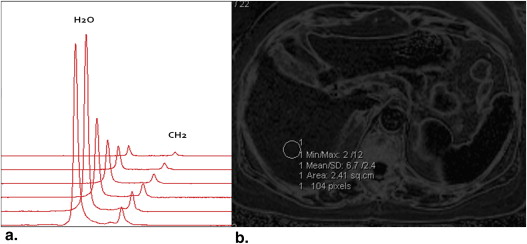
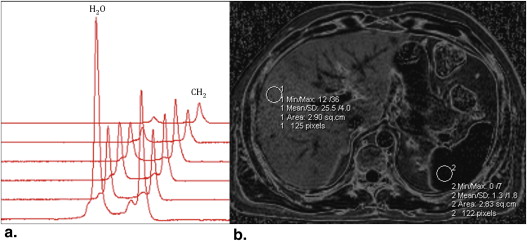
1 H MRS
Get Radiology Tree app to read full this article<
A(t)=A0⋅e(−t/T2) A
(
t
)
=
A
0
·
e
(
−
t/T2
)
where A is the integral value at time t and A 0 is the integral value at time 0.
Get Radiology Tree app to read full this article<
Get Radiology Tree app to read full this article<
%FF=100⋅A0CH2/(A0CH2+A0H2O) %FF
=
100
·
A
0
CH2
/
(
A
0
CH2
+
A
0
H2O
)
Get Radiology Tree app to read full this article<
Get Radiology Tree app to read full this article<
Fat fraction mapping (FFM)
Get Radiology Tree app to read full this article<
Get Radiology Tree app to read full this article<
Statistical analysis
Get Radiology Tree app to read full this article<
Get Radiology Tree app to read full this article<
Results
Get Radiology Tree app to read full this article<
Table 1
Fat Fraction Measurements with FFM and MRS in the 26 Patients
Fat Fraction Mapping (%) Magnetic Resonance Spectroscopy (%) 4.8 1.2 2.8 0.8 2.6 0.8 27.4 28.6 4.5 1.2 35.4 30 15.7 14.2 2.0 1.0 6.7 5.7 12.0 7.0 15.9 15 10.8 7.3 3.0 1.0 20.8 21.7 25.5 26.7 12.6 10.8 6.9 3.1 2.5 1.0 5.3 1.3 11.4 10.3 16.8 20.5 6.7 1.6 2.2 0.8 6.8 4.4 31.7 29.3 12.0 11.0
Get Radiology Tree app to read full this article<
Discussion
Get Radiology Tree app to read full this article<
Get Radiology Tree app to read full this article<
Get Radiology Tree app to read full this article<
Get Radiology Tree app to read full this article<
Get Radiology Tree app to read full this article<
Acknowledgments
Get Radiology Tree app to read full this article<
Get Radiology Tree app to read full this article<
References
1. Younossi Z.M., Stepanova M., Afendy M., et. al.: Changes in the prevalence of the most common causes of chronic liver diseases in the United States from 1998 to 2008. Clin Gastroenterol Hepatol 2011; 9: pp. 524-530.
2. Chalasani N., Younossi Z., Lavine J.E., et. al.: Liver disease: practice guideline by the American Association for the Study of Liver Diseases, American College of Gastroenterology, and the American Gastroenterological Association. Hepatology 2012; 55: pp. 2005-2023.
3. Pais R., Pascale A., Fedchuck L., et. al.: Progression from isolated steatosis to steatohepatitis and fibrosis in nonalcoholic fatty liver disease. Clin Res Hepatol Gastroenterol 2011; 35: pp. 23-28.
4. Won V., Wong G., Choi P., et. al.: Disease progression of non-alcoholic fatty liver disease: a prospective study with paired liver biopsies at 3 years. Gut 2010; 59: pp. 969-974.
5. Kim S.R., Nakajima T., Ando K., et. al.: Two cases of nonalcoholic liver steato-hepatitis developing from simple fatty liver. J Gastrointest Liver Dis 2009; 18: pp. 491-495.
6. Harrisson S.A., Togerson S., Hayashi P.H.: The natural history of non alcoholic fatty liver disease: a clinical histopathological study. Am J Gastroenterol 2003; 98: pp. 2042-2047.
7. Brunt E.M.: Nonalcoholic fatty liver disease: what the pathologist can tell the clinician. Dig Dis 2012; 30: pp. 61-68.
8. Szczepaniak L.S., Nurenberg P., Leonard D., et. al.: Magnetic resonance spectroscopy to measure hepatic triglyceride content: prevalence of hepatic steatosis in the general population. Am J Physiol Endocrinol Metab 2005; 288: pp. E462-E468.
9. Yokoo T., Bydder M., Hamilton G., et. al.: Nonalcoholic fatty liver disease: diagnostic and fat-grading accuracy of low-flip-angle multiecho gradient-recalled-echo MR imaging at 1.5 T. Radiology 2009; 251: pp. 67-76.
10. Yokoo T., Shiehmorteza M., Hamilton G., et. al.: Estimation of hepatic proton-density fat fraction by using MR imaging at 3.0 T. Radiology 2011; 258: pp. 749-759.
11. Guiu B., Petit J.M., Loffroy R., et. al.: Quantification of liver fat content: comparison of triple-echo chemical shift gradient-echo imaging and in vivo proton MR spectroscopy. Radiology 2009; 250: pp. 95-102.
12. d’Assignies G., Ruel M., Khiat A., et. al.: Noninvasive quantification of human liver steatosis using magnetic resonance methods. Eur Radiol 2009; 19: pp. 2033-2040.
13. Reeder S.B., Cruite I., Hamilton G., et. al.: Quantitative assessment of liver fat with magnetic resonance imaging and spectroscopy. JMRI 2011; 34: pp. 729-749.
14. Guiu B., Loffroy R., Petit J.M., et. al.: Mapping of liver fat with triple-echo gradient echo imaging: validation against 3.0-T proton MR spectroscopy. Eur Radiol 2009; 19: pp. 1786-1793.
15. Guiu B., Peti J.-M., Capitan V., et. al.: Intravoxel incoherent motion diffusion-weighted imaging in nonalcoholic fatty liver disease: a 3.0-T MR study. Radiology 2012; 265: pp. 96-103.
16. Bland J.M., Altman D.G.: Statistical methods for assessing agreement between two methods of clinical measurement. Lancet 1986; 1: pp. 307-310.
17. Décarie P.-O., Lepanto L., Billiard J.-S., et. al.: Fatty liver deposition and sparing: a pictorial review. Insights Imaging 2011; 2: pp. 533-538.
18. Sirlin C.B.: Noninvasive imaging biomarkers for steatosis assessment. Liver Transpl 2009; 15: pp. 1389-1391.
19. Guiu B., Loffroy R., Ben Salem D., et. al.: Liver steatosis and in-phase/opposed-phase MR imaging: theory and clinical applications at 3 T. J Radiol 2007; 88: pp. 1845-1853.
20. Forbes G.B.: Splenic lipidosis after administration of intravenous fat emulsions. J Clin Pathol 1978; 31: pp. 765-771.
21. Brunt E.M., Tiniakos D.G.: Histopathology of nonalcoholic fatty liver disease. World J Gastroenterol 2010; 16: pp. 5286-5296.
22. Stefan N., Kantartzis K., Häring H.-U.: Causes and metabolic consequences of fatty liver. Endocrinol Rev 2008; 29: pp. 939-960.