
Rationale and Objectives
To assess the usefulness of T2*-corrected fat fraction (FF) map from volume-interpolated breathhold examination (VIBE) magnetic resonance (MR) sequence in patients with the rotator cuff pathology.
Materials and Methods
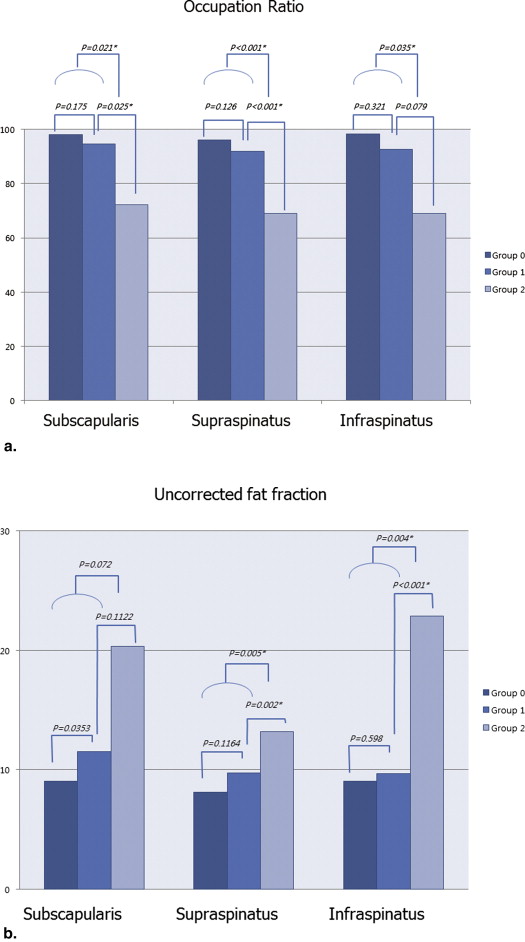
The phantom study was performed to validate the FF maps. Eighty-nine shoulder MR arthrographies were analyzed: (1) divided into three groups namely tendinopathy/normal tendons, partial-thickness tears, and full-thickness tears, and (2) occupation ratio (OR) was measured for muscular atrophy. Uncorrected and T2*-corrected FF maps were reconstructed from the VIBE images. The Pearson correlation test was used to correlate the FFs with ORs. The FF and the OR were compared between groups using the Student t test.
Results
T2*-corrected FF maps could provide a higher correlation than uncorrected FF maps. There were significantly negative correlations between the ORs and the FFs ( P < .01). In the normal and the partial-thickness tear group, the OR did not show a significant difference, although the FF maps showed a significant difference ( P < .01).
Conclusions
This quantitative assessment of the T2*-corrected FF in the rotator cuff muscles was found to be reliable and correlated well with the ORs. The T2*-corrected FF maps could be used for more sophisticated assessments of the fat even in the partial-thickness tear.
Key points:
1. Fat fraction (FF) in the rotator cuff is an important prognostic factor.
Get Radiology Tree app to read full this article<
Get Radiology Tree app to read full this article<
Get Radiology Tree app to read full this article<
Get Radiology Tree app to read full this article<
Get Radiology Tree app to read full this article<
Materials and methods
Phantom Study
Get Radiology Tree app to read full this article<
Get Radiology Tree app to read full this article<
Patient Population
Get Radiology Tree app to read full this article<
MR Protocol
Get Radiology Tree app to read full this article<
Get Radiology Tree app to read full this article<
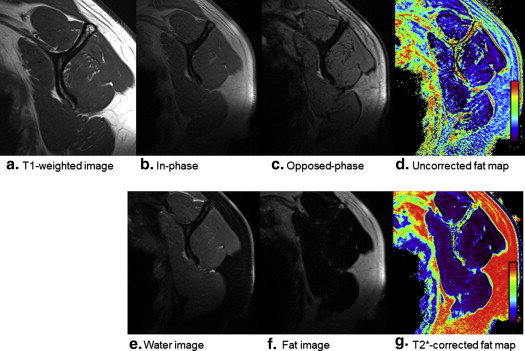
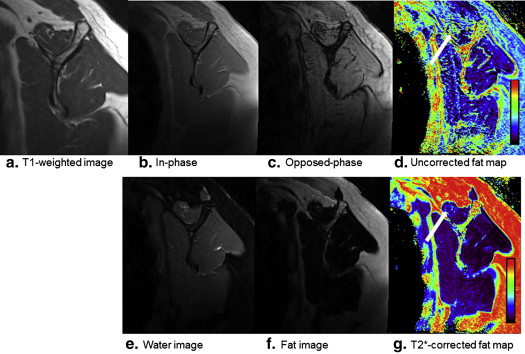
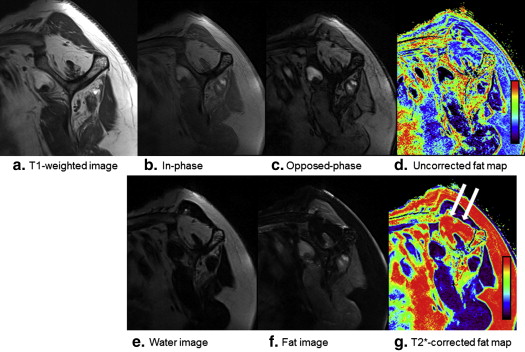
Fat Fraction Maps
Get Radiology Tree app to read full this article<
T2*−correctedfatfraction(FF)=F(W+F)×100 T
2
*
-
corrected
fat
fraction
(
FF
)
=
F
(
W
+
F
)
×
100
Get Radiology Tree app to read full this article<
Get Radiology Tree app to read full this article<
Uncorrectedfatfraction(FF)=(IP−OP)(IP+OP)×100 Uncorrected
fat
fraction
(
FF
)
=
(
IP
−
OP
)
(
IP
+
OP
)
×
100
Get Radiology Tree app to read full this article<
MRI of Rotator Cuff Tendon Tears
Get Radiology Tree app to read full this article<
MRI of Muscle Atrophy
Get Radiology Tree app to read full this article<
MRI of Fat Quantification
Get Radiology Tree app to read full this article<
Statistical Analysis
Get Radiology Tree app to read full this article<
Results
Get Radiology Tree app to read full this article<

Get Radiology Tree app to read full this article<
Get Radiology Tree app to read full this article<
Table 1
Mean Values and Standard Deviations of the Occupation Ratios and Fat Fractions
Occupation Ratio Uncorrected FF T2*-corrected FF Subscapularis NL/TP 98.11 ± 3.03 9.01 ± 3.52 7.88 ± 1.99 PT 94.71 ± 10.20 11.52 ± 5.24 12.73 ± 7.67 FT 72.25 ± 17.45 20.30 ± 11.28 30.11 ± 22.85 Supraspinatus NL/TP 96.03 ± 5.92 8.14 ± 1.89 6.61 ± 1.81 PT 91.87 ± 9.81 9.74 ± 3.97 7.89 ± 2.41 FT 68.99 ± 22.44 13.19 ± 5.74 22.23 ± 19.43 Infraspinatus NL/TP 98.35 ± 2.13 9.05 ± 2.31 5.81 ± 1.76 PT 92.65 ± 9.59 9.70 ± 3.61 8.74 ± 5.14 FT 68.97 ± 28.38 22.83 ± 7.86 37.71 ± 24.67
FF, fat fraction; FT, full-thickness tear; NL, normal; PT, partial tear; TP, tendinopathy.
The values are represented as mean ± standard deviation.
Get Radiology Tree app to read full this article<
Get Radiology Tree app to read full this article<
Table 2
Pearson Correlations of the Occupation Ratios and Fat Fractions
Correlation Coefficient (95% Confidence Interval) Uncorrected Fat Fraction T2*-corrected Fat Fraction Subscapularis −.65 (−.75 to −.51) ∗ −.86 (−.91 to −.80) ∗ Supraspinatus −.59 (−.71 to −.44) ∗ −.78 (−.86 to −.69) ∗ Infraspinatus −.72 (−.81 to −.60) ∗ −.94 (−.96 to −.91) ∗
Get Radiology Tree app to read full this article<
Get Radiology Tree app to read full this article<
Get Radiology Tree app to read full this article<
Table 3
Correlations of Occupation Ratios and Fat Fractions with the Tear Sizes (Length/Width) in Patients with Full-thickness Tears
Correlation Coefficient ( P Value) Occupation Ratio Uncorrected FF T2*-corrected FF Tear length Subscapularis −.486 (.356) .769 (.074) .543 (.297) Supraspinatus −.467 (.018) ∗ .639 (<.001) ∗ .766 (<.001) ∗ Infraspinatus .464 (.302) −.378 (.403) −.286 (.556) Tear width Subscapularis −.886 (.033) ∗ .894 (.016) ∗ .943 (.017) ∗ Supraspinatus −.622 (.001) ∗ .534 (.006) ∗ .657 (<.001) ∗ Infraspinatus .0367 (.963) −.140 (.765) .256 (.580)
FF, fat fraction.
Get Radiology Tree app to read full this article<
Get Radiology Tree app to read full this article<
Get Radiology Tree app to read full this article<
Table 4
Comparisons of Occupation Ratios and Fat Fractions between Groups
Occupation Ratio Uncorrected FF T2*-corrected FF Subscapularis NL/TP and PT .175 .035 .005 ∗ PT and FT .025 ∗ .112 .040 ∗ NL/TP/PT and FT .021 ∗ .072 .024 ∗ Supraspinatus NL/TP and PT .126 .116 .064 PT and FT <.001 ∗ .002 ∗ <.001 ∗ NL/TP/PT and FT <.001 ∗ .005 ∗ <.001 ∗ Infraspinatus NL/TP and PT .321 .598 .338 PT and FT .079 <.001 ∗ .021 ∗ NL/TP/PT and FT .035 ∗ .004 ∗ .014 ∗
FF, fat fraction; FT, full-thickness tear; NL, normal; PT, partial tear; TP, tendinopathy.
Get Radiology Tree app to read full this article<
Get Radiology Tree app to read full this article<
Discussion
Get Radiology Tree app to read full this article<
Get Radiology Tree app to read full this article<
Get Radiology Tree app to read full this article<
Get Radiology Tree app to read full this article<
Get Radiology Tree app to read full this article<
Get Radiology Tree app to read full this article<
Get Radiology Tree app to read full this article<
Get Radiology Tree app to read full this article<
Get Radiology Tree app to read full this article<
Acknowledgement
Get Radiology Tree app to read full this article<
Get Radiology Tree app to read full this article<
References
1. Nakagaki K., Ozaki J., Tomita Y., et. al.: Fatty degeneration in the supraspinatus muscle after rotator cuff tear. J Shoulder Elbow Surg 1996; 5: pp. 194-200.
2. Goutallier D., Postel J.M., Gleyze P., et. al.: Influence of cuff muscle fatty degeneration on anatomic and functional outcomes after simple suture of full-thickness tears. J Shoulder Elbow Surg 2003; 12: pp. 550-554.
3. Goutallier D., Godefroy D., Postel J.M., et. al.: Comments on: muscle fatty infiltration in rotator cuff tears: descriptive analysis of 1,688 cases by B. Melis, C. Nemoz and G. Walch, published in 10.1016/j.otsr. 2009.05.001. Orthop Traumatol Surg Res 2010; 96: pp. 918-919.
4. Melis B., Nemoz C., Walch G.: Muscle fatty infiltration in rotator cuff tears: descriptive analysis of 1688 cases. Orthop Traumatol Surg Res 2009; 95: pp. 319-324.
5. Melis B., DeFranco M.J., Chuinard C., et. al.: Natural history of fatty infiltration and atrophy of the supraspinatus muscle in rotator cuff tears. Clin Orthop Relat Res 2010; 468: pp. 1498-1505.
6. Melis B., Wall B., Walch G., et. al.: Natural history of infraspinatus fatty infiltration in rotator cuff tears. J Shoulder Elbow Surg 2010; 19: pp. 757-763.
7. Gladstone J.N., Bishop J.Y., Lo I.K., et. al.: Fatty infiltration and atrophy of the rotator cuff do not improve after rotator cuff repair and correlate with poor functional outcome. Am J Sports Med 2007; 35: pp. 719-728.
8. Burkhart S.S., Barth J.R., Richards D.P., et. al.: Arthroscopic repair of massive rotator cuff tears with stage 3 and 4 fatty degeneration. Arthroscopy 2007; 23: pp. 347-354.
9. Dixon W.T.: Simple proton spectroscopic imaging. Radiology 1984; 153: pp. 189-194.
10. Reeder S.B., Cruite I., Hamilton G., et. al.: Quantitative assessment of liver fat with magnetic resonance imaging and spectroscopy. J Magn Reson Imaging 2011; 34: spcone
11. Bydder M., Middleton M., Sirlin C., et. al.: Fat quantification by modeling the variation in signal amplitude with TE.2006.Proceedings 14th Annual Scientific Meeting of ISMRMSeattlepp. 2298.
12. Hussain H.K., Chenevert T.L., Londy F.J., et. al.: Hepatic fat fraction: MR imaging for quantitative measurement and display—early experience. Radiology 2005; 237: pp. 1048-1055.
13. Westphalen A.C., Qayyum A., Yeh B.M., et. al.: Liver fat: effect of hepatic iron deposition on evaluation with opposed-phase MR imaging. Radiology 2007; 242: pp. 450-455.
14. Yu H., McKenzie C.A., Shimakawa A., et. al.: Multiecho reconstruction for simultaneous water-fat decomposition and T2* estimation. J Magn Reson Imaging 2007; 26: pp. 1153-1161.
15. Liu C.Y., McKenzie C.A., Yu H., et. al.: Fat quantification with IDEAL gradient echo imaging: correction of bias from T(1) and noise. Magn Reson Med 2007; 58: pp. 354-364.
16. Yu H., Shimakawa A., Reeder S.B., et. al.: Magnitude fitting following phase sensitive water-fat separation to remove effects of phase errors.2009.Proceedings of the 17th Annual Meeting of ISMRMHonolulu, Hawaiipp. 461.
17. Yu H., Shimakawa A., McKenzie C.A., et. al.: Multiecho water-fat separation and simultaneous R2* estimation with multifrequency fat spectrum modeling. Magn Reson Med 2008; 60: pp. 1122-1134.
18. Thomazeau H., Rolland Y., Lucas C., et. al.: Atrophy of the supraspinatus belly. Assessment by MRI in 55 patients with rotator cuff pathology. Acta Orthop Scand 1996; 67: pp. 264-268.
19. Gokalp G., Yildirim N., Yazici Z., et. al.: Using chemical-shift MR imaging to quantify fatty degeneration within supraspinatus muscle due to supraspinatus tendon injuries. Skeletal Radiol 2010; 39: pp. 1211-1217.
20. Wren T.A., Bluml S., Tseng-Ong L., et. al.: Three-point technique of fat quantification of muscle tissue as a marker of disease progression in Duchenne muscular dystrophy: preliminary study. AJR Am J Roentgenol 2008; 190: pp. W8-12.
21. Samagh S.P., Kramer E.J., Melkus G., et. al.: MRI quantification of fatty infiltration and muscle atrophy in a mouse model of rotator cuff tears. J Orthop Res 2013; 31: pp. 421-426.
22. Mansson S., Peterson P., Johansson E.: Quantification of low fat contents: a comparison of MR imaging and spectroscopy methods at 1.5 and 3 T. Magn Reson Imaging 2012; 30: pp. 1461-1467.
23. Kang B.K., Yu E.S., Lee S.S., et. al.: Hepatic fat quantification: a prospective comparison of magnetic resonance spectroscopy and analysis methods for chemical-shift gradient echo magnetic resonance imaging with histologic assessment as the reference standard. Invest Radiol 2012; 47: pp. 368-375.
24. Borra R.J., Salo S., Dean K., et. al.: Nonalcoholic fatty liver disease: rapid evaluation of liver fat content with in-phase and out-of-phase MR imaging. Radiology 2009; 250: pp. 130-136.
25. van Werven J.R., Marsman H.A., Nederveen A.J., et. al.: Assessment of hepatic steatosis in patients undergoing liver resection: comparison of US, CT, T1-weighted dual-echo MR imaging, and point-resolved 1H MR spectroscopy. Radiology 2010; 256: pp. 159-168.
26. Moosmayer S., Tariq R., Stiris M.G., et. al.: MRI of symptomatic and asymptomatic full-thickness rotator cuff tears. A comparison of findings in 100 subjects. Acta Orthop 2010; 81: pp. 361-366.
27. Cassidy F.H., Yokoo T., Aganovic L., et. al.: Fatty liver disease: MR imaging techniques for the detection and quantification of liver steatosis. Radiographics 2009; 29: pp. 231-260.