
Rationale and Objectives
To compare the ability of normalized versus non-normalized metabolite ratios to differentiate recurrent brain tumor from radiation injury using magnetic resonance spectroscopy (MRS) in previously treated patients.
Materials and Methods
Twenty-five patients with previous diagnosis of primary intracranial neoplasm confirmed with biopsy/resection, previously treated with radiation therapy (range, 54–70 Gy) with or without chemotherapy and new contrast enhancing lesion on a 1.5 T magnetic resonance imaging at the site of the primary neoplasm participated in this retrospective study. After MRS, clinical, radiological, and histopathology data were used to classify new contrast-enhancing lesions as either recurrent neoplasm or radiation injury. Volume of interest included both the lesion and normal-appearing brain on the contralateral side. Non-normalized metabolic ratios were calculated from choline (Cho), creatine (Cr), and N-acetylaspartate (NAA) spectroscopic values obtained within the contrast-enhancing lesion: Cho/Cr, NAA/Cr, and Cho/NAA. Normalized ratios were calculated using the metabolic values from the contralateral normal side: Cho/normal creatinine (nCr), Cho/normal N-acetylaspartate (nNAA), Cho/normal choline, NAA/nNAA, NAA/nCr, and Cr/nCr. Results were correlated with the final diagnosis by Wilcoxon rank-sum analysis.
Results
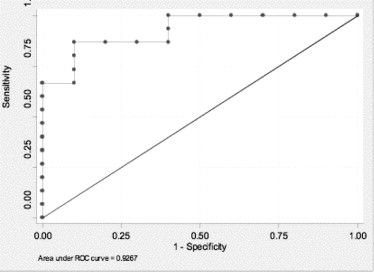
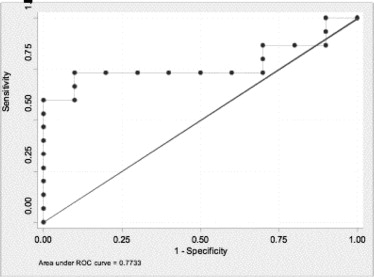
Two of three non-normalized ratios, Cho/NAA (sensitivity 86%, specificity 90%) and NAA/Cr (sensitivity 93%, specificity 70%) significantly associated with tumor recurrence even after correcting for multiple comparisons. Of the six normalized ratios, only Cho/nNAA significantly correlated with tumor recurrence (sensitivity 73%, specificity 40%), but did not remain significant after correcting for multiple comparisons.
Conclusion
Cho/NAA and NAA/Cr were the two ratios with the best discriminating ability and both had better discriminating ability than their corresponding normalized ratios (Area under the curve = 0.92 versus 0.77, AUC= 0.85 vs. 0.66), respectively.
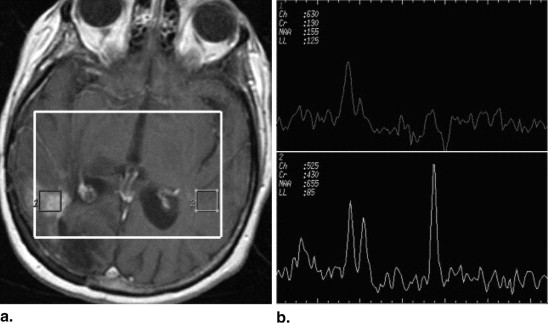
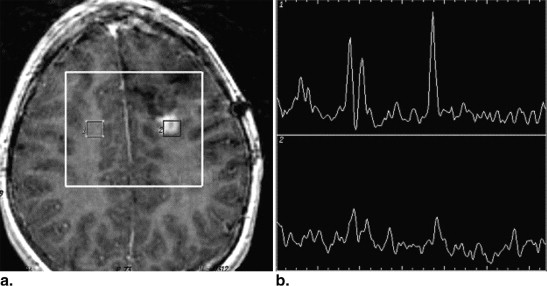
Differentiation between recurrent neoplasm and postradiation change in patients who were treated for primary brain tumors is often difficult, based on conventional magnetic resonance imaging (MRI) features alone. Previous studies suggest that magnetic resonance spectroscopy (MRS) can discern between postradiation changes and recurrent neoplasm in patients treated for a primary brain tumor who have nonspecific contrast-enhancing lesions on follow-up imaging and have shown adequate correlation with pathologic specimens obtained at biopsy and/or resection . Prior investigators evaluating the ability of multivoxel MRS—either two-dimensional (2D) or three-dimensional (3D) chemical shift imaging (CSI)—to differentiate between recurrent neoplasm and postradiation change have suggested that specific standard ratios, such as the choline/creatine (Cho/Cr) or choline/N-acetylaspartate (Cho/NAA), could be used as “cutoffs” to define the different groups .
The key question is which of the different ways to measure ratios and obtaining so called cutoff values works the best?
Get Radiology Tree app to read full this article<
Get Radiology Tree app to read full this article<
Methods
Patient Population
Get Radiology Tree app to read full this article<
Get Radiology Tree app to read full this article<
Table 1
Demographics, Primary Tumor, MRS Diagnosis, Follow-up Interval for the 25 Patients in Whom Normalized Ratios Could be Appropriately Calculated out of 27 Patients in the Original Cohort
Patient Number Age Sex Histology of the Initial Tumor MRS Diagnosis ∗ Final Diagnosis † Reference Standard Months of MRI Follow-up 1 43 M Anaplastic astrocytoma Radiation Radiation Histology 13 2 35 F Oligoastrocytoma Tumor Radiation Histology 27 3 44 M GBM Radiation Radiation Imaging 13 4 54 M Anaplastic oligoastrocytoma Radiation Radiation Imaging 11 5 10 F Oligoastrocytoma Radiation Radiation Imaging 11 6 52 M Oligoastrocytoma Radiation Radiation Imaging 9 7 41 F Anaplastic oligoastrocytoma Radiation Radiation Imaging 11 8 43 F Anaplastic Oligodendroma Radiation Radiation Imaging 19 9 7 F PNET Radiation Radiation Imaging 20 10 64 F Glioblastoma Tumor Tumor Histology 14 11 59 F Low-grade oligoastrocytoma Tumor Tumor Histology 16 12 20 M PNET/glioblastoma Tumor Tumor Histology 27 13 43 M Oligoastrocytoma to GBM Tumor Tumor Histology 12 14 7 M Ependymoma Tumor Tumor Histology 18 15 42 F Anaplastic oligoastrocytoma Tumor Tumor Histology 22 16 24 M Oligoastrocytoma Tumor Tumor Histology 6 17 35 M Astrocytoma Tumor Tumor Imaging 2 18 4 M Medulla glioma Tumor Tumor Imaging 21 19 41 M Oligodendroglioma Tumor Tumor Imaging 18 20 50 M Oligodendroglioma Tumor Tumor Imaging 5 21 36 F Astrocytoma Tumor Tumor Imaging 20 22 32 F Astrocytoma Tumor Tumor Imaging 23 23 ‡ 55 M Pontine glioma Radiation Tumor Imaging 27 24 56 F Neurocytoma Tumor Tumor Imaging — 25 47 M Astrocytoma Radiation Radiation Histology 41
GBM, glioblastoma multiforme; L, left; MRS, magnetic resonance spectroscopy; PNET, primitive neuroectodermal tumor; R, right.
Get Radiology Tree app to read full this article<
Get Radiology Tree app to read full this article<
Get Radiology Tree app to read full this article<
Table 2
Tumor Location and Metabolic Ratios
Patient Number Tumor Location Cho/Cr Cho/NAA NAA/Cr Cho/nNAA Cho/nCr Cho/nCho Cr/nCr NAA/nNAA NAA/nCr 1 R frontal 1.81 3.19 0.56 1.54 2.52 2.75 1.39 0.48 0.79 2 L Parieto-occipital 2.11 1.29 1.64 0.38 0.89 0.72 0.42 0.29 0.70 3 L corona - radiata 2.24 1.71 1.31 0.79 1.55 1.07 0.69 0.46 0.90 4 R fontal 2.25 1.72 1.31 0.79 1.55 1.07 0.69 0.46 0.90 5 L frontal 1.22 1.05 1.17 0.43 0.70 0.87 0.57 0.41 0.67 6 R frontal 1.58 2.33 0.67 0.81 1.20 1.54 0.76 0.34 0.51 7 R frontal 2.48 1.33 1.86 0.80 1.68 1.34 0.67 0.60 1.26 8 R frontal 1.91 1.27 1.50 0.85 1.53 1.10 0.80 0.66 1.20 9 L frontal 0.86 0.88 0.98 0.92 0.90 1.06 1.05 1.05 1.03 10 R parietal 3.05 3.84 0.79 0.87 1.47 1.23 0.48 0.23 0.38 11 L frontal 0.82 3.42 0.24 0.24 0.48 0.41 0.55 0.07 0.13 12 L frontal 1.46 1.56 0.93 1.18 1.40 1.60 0.96 0.76 0.90 13 R temporal 2.61 1.70 1.54 0.57 0.91 0.66 0.35 0.34 0.53 14 L frontal 2.57 2.25 1.14 0.95 2.27 0.33 0.88 0.42 1.01 15 R temporal 1.90 3.52 0.54 1.96 2.48 2.87 1.30 0.56 0.70 16 L frontal 2.85 2.69 1.06 1.44 2.75 1.72 0.96 0.54 1.02 17 L temporal 2.11 2.71 0.78 0.90 1.33 1.00 0.63 0.33 0.49 18 Pont-med junction 3.87 1.87 2.07 1.09 3.38 1.19 0.87 0.58 1.80 19 L frontal 2.12 2.60 0.82 0.99 2.26 1.86 1.06 0.38 0.87 20 R frontal 2.83 2.63 1.08 4.65 0.78 0.71 0.28 0.18 0.30 21 L frontal 2.51 4.64 0.54 1.23 2.47 2.15 0.99 0.26 0.53 22 L brachium pontis 2.16 2.28 0.94 1.45 1.82 1.30 0.84 0.63 0.80 23 Pons 0.90 1.65 0.55 0.29 0.48 0.37 0.53 0.18 0.29 24 L parietal 2.48 3.29 0.75 0.54 1.08 0.91 0.43 0.16 0.33 25 L frontal 1.09 0.69 1.59 0.22 0.42 0.67 0.38 0.33 0.61
Cho, choline; Cr, creatine; L, left; NAA, N-acetylaspartate; nCho, normal choline; nCr, normal creatinine; nNAA, normal N-acetylaspartate; R, right.
Get Radiology Tree app to read full this article<
Lesion Classification
Get Radiology Tree app to read full this article<
MRI and MRS Protocol
Get Radiology Tree app to read full this article<
Get Radiology Tree app to read full this article<
Get Radiology Tree app to read full this article<
Get Radiology Tree app to read full this article<
Data and Statistical Analysis
Get Radiology Tree app to read full this article<
Results
Get Radiology Tree app to read full this article<
Get Radiology Tree app to read full this article<
Get Radiology Tree app to read full this article<
Get Radiology Tree app to read full this article<
Table 3
Performance of Non-normalized and Normalized Metabolic Ratios in the Differentiation between Tumor Recurrence and Radiation Change the 25 Patients with Final Diagnosis by Either Histopathology or Imaging Follow-up
Non-normalized Ratios Normalized Ratios Cho/NAA NAA/Cr Cho/Cr Cho/nNAA Cho/nCr Cho/nCho Cr/nCr NAA/nNAA NAA/nCr ROC estimate 0.92 0.85 0.64 0.77 0.71 0.70 0.66 0.62 0.66 ROC 95%CI 0.77–0.99 0.63–0.95 0.45–0.85 0.60–0.93 0.52–0.90 0.46–0.86 0.44-0.84 0.43–0.84 0.4–0.85 % Correctly Classified 88 84 60 60 64 64 52 64 64 Sensitivity 86 93 80 73 73 80 66 86 93 Specificity 90 70 30 40 50 40 30 30 20 (+) Positive Predictive value 93 82 63 65 69 67 59 65 64 (-) Negative Predictive value 82 87 50 50 55 57 37 60 67 Tumor recurrence Mean (SD) 2.81 (0.82) 0.85 (0.40) 2.23 (0.78) 1.01 (0.47) 1.79 (0.85) 1.44 (0.73) 0.81 (0.31) 0.38 (0.20) 0.69 (0.40) Radiation change Mean (SD) 1.39 (0.46) 1.36 (0.33) 1.84 (0.58) 0.66 (0.22) 1.13 (0.41) 0.97 (0.35) 0.64 (0.20) 0.49 (0.22) 0.83 (0.25)P value .0004 ∗ , † .0033 ∗ , † .2441 .02291 ∗ .0759 .0961 .1654 .2918 .1654
Cho, choline; CI, confidence interval; Cr, creatine; L, left; NAA, N-acetylaspartate; nCho, normal choline; nCr, normal creatinine; nNAA, normal N-acetylaspartate; ROC, area under the ROC curve; R, right; ROC, receiver operating characteristic.
Get Radiology Tree app to read full this article<
Get Radiology Tree app to read full this article<
Get Radiology Tree app to read full this article<
Get Radiology Tree app to read full this article<
Get Radiology Tree app to read full this article<
Discussion
Get Radiology Tree app to read full this article<
Get Radiology Tree app to read full this article<
Get Radiology Tree app to read full this article<
Get Radiology Tree app to read full this article<
Get Radiology Tree app to read full this article<
Get Radiology Tree app to read full this article<
Get Radiology Tree app to read full this article<
Get Radiology Tree app to read full this article<
Get Radiology Tree app to read full this article<
Get Radiology Tree app to read full this article<
References
1. Fulham M.J., Bizzi A., Dieta M.J., et. al.: Mapping of brain tumor metabolites with proton MR spectroscopic imaging: clinical relevance. Radiology 1992; 185: pp. 675-686.
2. Weybright P., Sundgren P.C., Gomez-Hassan D., et. al.: Differentiation of tumor recurrence from treatment related changes using 2D-CSI MR Spectroscopy. Am J Roentgenol AJR 2005; 185: pp. 1471-1476.
3. Weybright P., Maly P., Gomez Hassan D., et. al.: MR spectroscopy in the evaluation of recurrent contrast enhancing lesions in the posterior fossa after tumor treatment. Neuroradiology 2004; pp. 541-549.
4. Rock J.P., Hearschen D., Scarpace L., et. al.: Correlations between magnetic resonances spectroscopy and imaging-guided histopathology, with special attention to radiation necrosis. Neurosurgery 2002; 51: pp. 912-920.
5. Croteau D., Scarpace L., Hearschen D., et. al.: Correlation between magnetic resonance spectroscopy imaging and image guided biopsies: semiquantitative and qualitative histopathological analyses of patients with untreated gliomas. Neurosurgery 2001; 49: pp. 823-829.
6. Dowling C., Bollen A.W., Noworolski S.M., et. al.: Preoperative proton MR spectroscopic imaging of brain tumors: correlation with histopathologic analysis of resection specimens. AJNR Am J Neuroradiol 2001; 22: pp. 604-612.
7. Taylor J.S., Langston J.W., Reddick W.E., et. al.: Clinical value of proton magnetic resonance spectroscopy for differentiating recurrent or residual brain tumor from delayed cerebral necrosis. Int J Radiat Oncol Biol Phys 1996; 36: pp. 1251-1261.
8. Zeng Q.S., Li C.F., Zhang K., et. al.: Multivoxel 3D proton MR spectroscopy in the distinction of recurrent glioma from radiation injury. J Neurooncol 2007; 84: pp. 63-69.
9. Bulakbasi N., Kocaoglu M., Ors F., et. al.: Combination of single-voxel proton MR spectroscopy and apparent diffusion coefficient calculation in the evaluation of common brain tumors. AJNR Am J Neuroradiol 2003; 24: pp. 225-233.
10. Lin A., Bluml S., Mamelak A.N.: Efficacy of proton magnetic resonance spectroscopy in clinical decision making for patients with suspected malignant brain tumors. J Neurooncol 1999; 45: pp. 69-81.
11. Yang D., Korogi Y., Sugahara T., et. al.: Cerebral gliomas: prospective comparison of multivoxel 2D chemical-shift imaging proton MR spectroscopy, echoplanar perfusion and diffusion-weighted MRI. Neuroradiology 2002; 44: pp. 656-666.
12. Wald L.L., Nelson S.J., Day M.R., et. al.: Serial proton magnetic resonance spectroscopy imaging of glioblastoma multiforme after brachytherapy. J Neurosurg 1997; 87: pp. 525-534.
13. Kinoshita K., Tada E., Matsumoto K., et. al.: Proton MR spectroscopy of delayed cerebral radiation in monkeys and humans after brachytherapy. AJNR Am J Neuroradiol 1997; 18: pp. 1753-1761.
14. Rock J.P., Scarpace L., Hearshen D., et. al.: Associations among magnetic resonance spectroscopy, apparent diffusion coefficients, and image-guided histopathology with special attention to radiation necrosis. Neurosurgery 2004; 54: pp. 1111-1117.
15. Esteve F., Rubin C., Grand S., et. al.: Transient metabolic changes observed with proton MR spectroscopy in normal human brain after radiation therapy. Int J Radiat Oncol Biol Phys 1998; 15: pp. 279-286.
16. Lazareff J.A., Gupta R.K., Alger J.: Variation of post-treatment H-MRSI choline signal intensity in pediatric gliomas. J Neurooncol 1999; 41: pp. 291-298.
17. McKnight T.R., von dem Busche M.H., Vigneron D.B., et. al.: Histopathological validation of a three-dimensional magnetic resonance spectroscopy index as a predictor of tumor presence. J Neurosurg 2002; 97: pp. 794-802.
18. Yerli H., Aglidere A.M., Ozen O., et. al.: Evaluation of cerebral glioma grade by using normal side creatine as an internal reference in multi-voxel 1H-MR spectroscopy. Diagn Interv Radiol 2007; 13: pp. 3-9.
19. Tong Z.Y., Toshiaki Y., Wang Y., et. al.: Proton magnetic resonance spectroscopy of normal human brain and glioma: a quantitative in vivo study. Chin Med J (Engl) 2005; 118: pp. 1251-1257.
20. Di Costanzo A., Pollice S., Trojsi F., et. al.: Role of perfusion-weighted imaging at 3 Tesla in the assessment of malignancy of cerebral gliomas. Radiol Med 2008; 113: pp. 134-143.
21. Li C.W., Kuo Y.C., Chen C.Y., et. al.: Quantification of choline compounds in human hepatic tumors by proton MR spectroscopy at 3 T. Magn Reson Med 2005; 53: pp. 770-776.
22. Smith E.A., Carlos R.C., Junck L.R., et. al.: Developing a clinical decision model: use of MR spectroscopy to differentiate between recurrent tumor and radiation change in patients with new contrast enhancing lesions. AJR Am J Roentgenol 2009; 192: pp. W45-W52.
23. Petrou M., Sundgren P.C., Pang Y., et. al.: Preset versus manually-optimized selection of peak boundaries in calculation of proton metabolite ratios. Acad Radiol 2007; 14: pp. 340-343.
24. ROCKIT. Software programs available from the Kurt Rossmann Laboratories. http://xray.bsd.uchicago.edu/krl/KRL_ROC/software_index6.htm
25. Ando K., Ishikura R., Nagami Y., et. al.: Usefulness of Cho/Cr ratio in proton MR spectroscopy for differentiating residual/recurrent glioma from non-neoplastic lesions. Nippon Igaku Hoshasen Gakkai Zasshi 2004; 64: pp. 121-126. (Article in Japanese)
26. Al-Okaili R.N., Kreja J., Woo J.H., et. al.: Intra axial brain masses: MR imaging-based diagnostic strategy-initial experience. Radiology 2007; 243: pp. 539-550.
27. Law M., Yang S., Wang H., et. al.: Glioma grading; sensitivity, specificity, and predictive values of perfusion MR imaging and proton MR spectroscopic imaging compared with conventional MR imaging. AJNR Am J Neuroradiol 2003; 24: pp. 1989-1998.
28. Jain R., Scarpace L., Ellika S., et. al.: First-pass perfusion computed tomography: initial experience in differentiating recurrent brain tumors from radiation effects and radiation necrosis. Neurosurgery 2007; 61: pp. 778-786.
29. Terakawa Y., Tsuyuguchi N., Iwai Y., et. al.: Diagnostic accuracy of 11C-methionine PET for differentiation of recurrent brain tumors from radiation necrosis after radiotherapy. J Nucl Med 2008; 49: pp. 694-699.
30. Sugahara T., Korogi Y., Tomiguchi S., et. al.: Intra axial brain tumor; the value of perfusion–sensitive contrast-enhanced MR imaging for differentiating tumor recurrence from nonneoplastic contrast-enhancing tissue. AJNR Am J Neuroradiol 2000; 21: pp. 901-909.
31. Chan Y.L., Roebuck D.J., Yuen M.P., et. al.: Long-term cerebral metabolite changes on proton magnetic resonance spectroscopy inpatients cured of acute lymphoblastic leukemia with previous intrathecal methotrexate and cranial irradiation prophylaxis. Int J Radiat Oncol Biol Phys 2001; 50: pp. 759-763.
32. Chan Y.L., Yeung D.K.W., Leung S.F., et. al.: Proton magnetic resonance spectroscopy of late delayed radiation-induced injury of the brain. J Magn Reson Imaging 1999; 10: pp. 130-137.
33. Usenius T., Usenius J.P., Tenhunen M., et. al.: Radiation-induced changes in human brain metabolites as studied by 1H nuclear magnetic resonance spectroscopy in vivo. Int J Radiat Oncol Biol Phys 1995; 33: pp. 719-724.
34. Kaminaga T., Shirai K.: Radiation-induced brain metabolic changes in the acute and early delayed phase detected with quantitative proton magnetic resonance spectroscopy. J Comp Assist Tomogr 2005; 29: pp. 293-297.
35. Movsas B., Li B.S.Y., Babb J.S., et. al.: Quantifying radiation therapy-induced brain injury with whole brain proton MR spectroscopy: initial observations. Radiology 2001; 221: pp. 327-331.
36. Lee M.C., Pirzkall A., McKnight T.R., et. al.: 1 H-MRS of radiation effects in normal-appearing white matter: Dose-dependence and impact on automated spectral classification. J Magn Reson Imaging 2004; 19: pp. 379-388.
37. Sundgren P.C., Nagesh V., Elias A., et. al.: Metabolic alterations; a biomarker for radiation-induced injury of normal brain. A spectroscopy study. J Magn Reson Imaging 2009; 29: pp. 291-297.
38. Li B., Wang H., Gonen O.: Metabolite ratios to assumed stable creatine level may confound the quantification of proton brain MR spectroscopy. J Magn Reson Imaging 2003; 21: pp. 923-928.
39. Provencher S.W.: Estimation of metabolite concentrations from localized in vivo proton NMR spectra. Magn Reson Med 1993; 30: pp. 672-679.
40. Hein P.A., Eskey C.J., Dunn J.F., et. al.: Diffusion-weighted imaging in the follow-up of treated high-grade gliomas: tumor recurrence versus radiation injury. AJNR Am J Neuroradiol 2004; 25: pp. 201-209.
41. Bobek-Billewicz B., Stasik-Pres G., Majchrzak H., et. al.: Differentiation between brain tumor recurrence and radiation injury using perfusion, diffusion-weighted imaging and MR spectroscopy. Folia Neuropathol 2010; 48: pp. 81-92.