
Rationale and Objectives
The study aimed to validate magnetic resonance imaging (MRI)-based liver volumetry as a quantitative measure of hepatic regeneration in mice subjected to partial hepatectomy, in view of routine in vivo pharmacologic studies characterizing compounds aiming to accelerate liver regeneration.
Materials and Methods
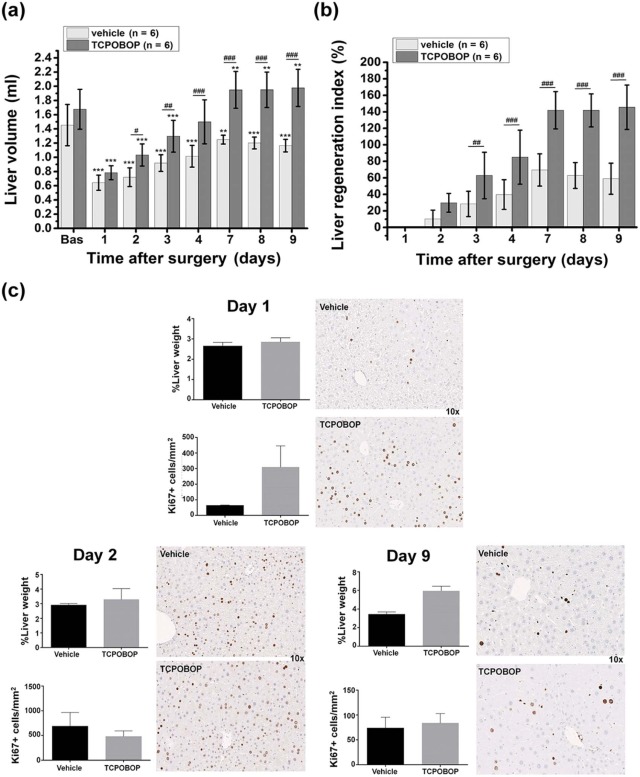
Partial hepatectomy was performed in male B6 mice ( n = 47). Images were acquired in 14.5 minutes from anesthetized and spontaneously respiring animals, without any gating and without administration of contrast material. Some of the mice ( n = 6) were treated with 1, 4-bis [2-(3, 5-dichloropyridyloxy)] benzene (TCPOBOP), a synthetic agonist of mouse constitutive androstane receptor, or with the corresponding vehicle ( n = 6). Postmortem analyses included total liver weight and histologic Ki67 expression.
Results
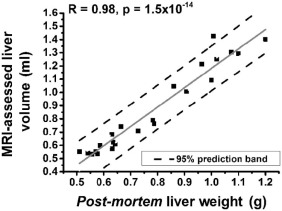
A highly significant correlation (R = 0.98, P = 1.5 × 10 −14 ) was obtained between the MRI-derived liver volumes and the postmortem liver weights in hepatectomized, untreated mice. MRI reliably monitored enhanced murine liver regrowth following treatment with TCPOBOP, as confirmed by comparative hepatocyte proliferation (Ki67 expression) and liver weight analysis (R = 0.96, P = 2 × 10 −6 ).
Conclusions
MRI-based monitoring of liver regrowth in mice without the requirement of euthanizing animals at several time points has been established. In comparison to terminal procedures, the number of hepatectomized mice needed to derive a liver (re)growth curve was reduced by a factor of 6. The feasibility of using this imaging approach in pharmacologic studies in the context of liver regeneration has been demonstrated.
Introduction
An efficient repair system of the liver tissue is required to ensure its proper functioning. The ability of the liver to regenerate itself as a response to loss of hepatic tissue has been known for a long time. This regenerative capacity may be impaired in cases of small-for-size liver grafts, liver resection (eg, tumor surgery), or chronic liver disease and acute liver failure often requiring liver transplant . Thus, there is a need for methods to enhance the intrinsic regeneration potential of the liver, enabling partial transplants, and to propagate hepatocytes ex vivo for use in cell transplant .
Whereas molecular mechanisms of liver cell growth and efficacy of mitogens can be studied in hepatic cell line-based in vitro systems, complex processes such as liver development or regeneration require in vivo models. The partial hepatectomy procedure in small rodents has constituted the most popular liver regeneration model. After surgical removal of three of the five liver lobes, the cells of the remaining two lobes proliferate until the liver regains its original size. Complete recovery takes approximately 8 days in rodents .
Get Radiology Tree app to read full this article<
Get Radiology Tree app to read full this article<
Materials and Methods
Get Radiology Tree app to read full this article<
Animals
Get Radiology Tree app to read full this article<
Partial Hepatectomy
Get Radiology Tree app to read full this article<
Get Radiology Tree app to read full this article<
TCPOBOP Treatment
Get Radiology Tree app to read full this article<
MRI
Get Radiology Tree app to read full this article<
Get Radiology Tree app to read full this article<
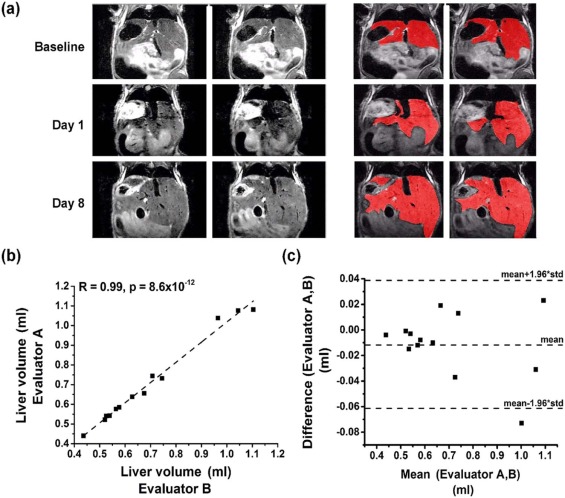
MR Image Evaluation
Get Radiology Tree app to read full this article<
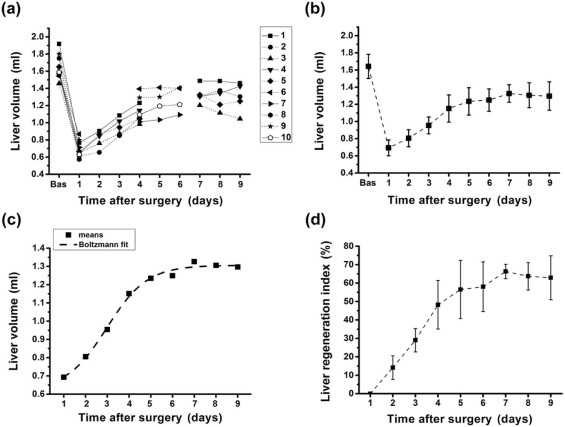
Liver Regeneration Index
Get Radiology Tree app to read full this article<
Liver regeneration index(%)=100×(Vt−VD1)/(Vbas−VD1) Liver regeneration index
(
%
)
=
100
×
(
V
t
−
V
D
1
)
/
(
V
b
a
s
−
V
D
1
)
with V t the liver volume at a given time point t, V D1 the liver volume on day 1 after partial hepatectomy, and V bas the liver volume at baseline prior to surgery. This index removes two possible sources of variance in the study, namely differences in initial liver volume and the volume of liver excised.
Get Radiology Tree app to read full this article<
Postmortem Analyses: Liver Weight and Histology
Get Radiology Tree app to read full this article<
Liver Function Tests
Get Radiology Tree app to read full this article<
Statistical Analyses
Get Radiology Tree app to read full this article<
Results
Get Radiology Tree app to read full this article<
Get Radiology Tree app to read full this article<
Get Radiology Tree app to read full this article<
Get Radiology Tree app to read full this article<
Get Radiology Tree app to read full this article<
Get Radiology Tree app to read full this article<
Get Radiology Tree app to read full this article<
TABLE 1
Markers of Liver Function in the Blood Serum (Means ± Standard Deviation) on Day 9 After Hepatectomy
Parameter Vehicle TCPOBOP T-Prot (g/L) 55.4 ± 3.8 50.4 ± 2.3 (52.0–61.0) (48.0–54.0) Alb (g/L) 25.8 ± 1.5 22.6 ± 1.1 (24.0–28.0) (21.0–24.0) T-Bil (µmol/L) 8.8 ± 1.6 7.8 ± 4.1 (7.0–11.0) (5.0–15.0) AST (IU/L) 35.2 ± 5.9 47.0 ± 10.6 (29.0–45.0) (37.0–63.0) ALT (IU/L) 20.4 ± 3.0 60.0 ± 37.4 (17.0–24.0) (18.0–103.0)
Alb, albumin; ALT, alanine aminotransferase; AST, aspartate aminotransferase; T-Bil, total bilirubin; T-Prot, total protein.
The range of values obtained for a given parameter is provided in parentheses.
Get Radiology Tree app to read full this article<
Discussion and Conclusions
Get Radiology Tree app to read full this article<
Get Radiology Tree app to read full this article<
Get Radiology Tree app to read full this article<
Get Radiology Tree app to read full this article<
Acknowledgments
Get Radiology Tree app to read full this article<
References
1. Michalopoulos G.K.: Liver regeneration. J Cell Physiol 2007; 213: pp. 286-300.
2. Michalopoulos G.K.: Principles of liver regeneration and growth homeostasis. Compr Physiol 2013; 3: pp. 485-513.
3. Michalopoulos G.K., Khan Z.: Liver stem cells: experimental findings and implications for human liver disease. Gastroenterology 2015; 149: pp. 876-882.
4. Higgins G.M., Anderson R.M.: Experimental pathology of the liver. Restoration of the liver of the white rat following partial surgical removal. Arch Pathol (Chic) 1931; 12: pp. 186-202.
5. Mitchell C., Willenbring H.: A reproducible and well-tolerated method for 2/3 partial hepatectomy in mice. Nat Protoc 2008; 3: pp. 1167-1170.
6. Lim M.C., Tan C.H., Cai J., et. al.: CT volumetry of the liver: where does it stand in clinical practice?. Clin Radiol 2014; 69: pp. 887-895.
7. Zhou J., Huang W., Chang S.K., et. al.: Longitudinal in-vivo volumetry study for porcine liver regeneration from CT data. Conf Proc IEEE Eng Med Biol Soc 2014; 2014: pp. 4743-4746.
8. Miyazaki K., Eguchi S., Tomonaga T., et. al.: The impact of the intra-abdominal space on liver regeneration after a partial hepatectomy in rats. J Surg Res 2011; 171: pp. 259-265.
9. Hockings P.D., Roberts T., Campbell S.P., et. al.: Longitudinal magnetic resonance imaging quantitation of rat liver regeneration after partial hepatectomy. Toxicol Pathol 2002; 30: pp. 606-610.
10. Garbow J.R., Kataoka M., Flye M.W.: MRI measurement of liver regeneration in mice following partial hepatectomy. Magn Reson Med 2004; 52: pp. 177-180.
11. Inderbitzin D., Gass M., Beldi G., et. al.: Magnetic resonance imaging provides accurate and precise volume determination of the regenerating mouse liver. J Gastrointest Surg 2004; 8: pp. 806-811.
12. Melloul E., Raptis D.A., Boss A., et. al.: Small animal magnetic resonance imaging: an efficient tool to assess liver volume and intrahepatic vascular anatomy. J Surg Res 2014; 187: pp. 458-465.
13. Halwachs S., Kneuer C., Honscha W.: Downregulation of the reduced folate carrier transport activity by phenobarbital-type cytochrome P450 inducers and protein kinase C activators. Biochim Biophys Acta 2007; 1768: pp. 1671-1679.
14. Ledda-Columbano G.M., Pibiri M., Loi R., et. al.: Early increase in cyclin-D1 expression and accelerated entry of mouse hepatocytes into S phase after administration of the mitogen 1, 4-bis[2-(3,5-dichloropyridyloxy)] benzene. Am J Pathol 2000; 156: pp. 91-97.
15. Columbano A., Ledda-Columbano G.M., Pibiri M., et. al.: Peroxisome proliferator-activated receptor-alpha mice show enhanced hepatocyte proliferation in response to the hepatomitogen 1,4-bis [2-(3,5-dichloropyridyloxy)] benzene, a ligand of constitutive androstane receptor. Hepatology 2001; 34: pp. 262-266.
16. Lin C.W., Mars W.M., Paranjpe S., et. al.: Hepatocyte proliferation and hepatomegaly induced by phenobarbital and 1,4-bis [2-(3,5-dichloropyridyloxy)] benzene is suppressed in hepatocyte-targeted glypican 3 transgenic mice. Hepatology 2011; 54: pp. 620-630.
17. Hennig J., Nauerth A., Friedburg H.: RARE imaging: a fast imaging method for clinical MR. Magn Reson Med 1986; 3: pp. 823-833.
18. Beckmann N., Tigani B., Ekatodramis D., et. al.: Pulmonary edema induced by allergen challenge in the rat: non-invasive assessment by magnetic resonance imaging. Magn Reson Med 2001; 45: pp. 88-95.
19. Blé F.X., Cannet C., Zurbruegg S., et. al.: Allergen-induced lung inflammation in actively sensitized mice assessed by MRI. Radiology 2008; 248: pp. 834-843.
20. Egger C., Cannet C., Gérard C., et. al.: Administration of bleomycin via the oropharyngeal aspiration route leads to sustained lung fibrosis in mice and rats as quantified by UTE-MRI and histology. PLoS ONE 2013; 8: e63432
21. Muhler A., Oude-Elferink R.P., Weinmann H.J.: Complete elimination of the hepatobiliary MR contrast agent Gd-EOB-DTPA in hepatic dysfunction: an experimental study using transport-deficient, mutant rats. Magn Reson Mater Phy Biol Med 1993; 1: pp. 134-139.
22. Leonhardt M., Keiser M., Oswald S., et. al.: Hepatic uptake of the magnetic resonance imaging contrast agent Gd-EOB-DTPA: role of human organic anion transporters. Drug Metab Dispos 2010; 38: pp. 1024-1028.
23. Schuhmann-Giampieri G., Schmitt-Willich H., Frenzel T., et. al.: Biliary excretion and pharmacokinetics of a gadolinium chelate used as a liver-specific contrast agent for magnetic resonance imaging in the rat. J Pharm Sci 1993; 82: pp. 799-803.
24. König J., Nies A.T., Cui Y., et. al.: Conjugate export pumps of the multidrug resistance protein (MRP) family: localization, substrate specificity, and MRP2-mediated drug resistance. Biochim Biophys Acta 1999; 1461: pp. 377-394.
25. Chang T.H., Hakamada K., Toyoki Y., et. al.: Expression of MRP2 and MRP3 during liver regeneration after 90% partial hepatectomy in rats. Transplantation 2004; 77: pp. 22-27.
26. Kato N., Yokawa T., Tamura A., et. al.: Gadolinium-ethoxybenzyl-diethylenetriamine-pentaacetic acid interaction with clinical drugs in rats. Invest Radiol 2002; 37: pp. 680-684.
27. El-Serag H.B., Marrero J.A., Rudolph L., et. al.: Diagnosis and treatment of hepatocellular carcinoma. Gastroenterology 2008; 134: pp. 1752-1763.
28. Kato A., Bamba H., Shinohara M., et. al.: Relationship between expression of cyclin D1 and impaired liver regeneration observed in fibrotic or cirrhotic rats. J Gastroenterol Hepatol 2005; 20: pp. 1198-1205.
29. Yang S., Leow C.K., Tan T.M.: Expression patterns of cytokine, growth factor and cell cycle-related genes after partial hepatectomy in rats with thioacetamide-induced cirrhosis. World J Gastroenterol 2006; 12: pp. 1063-1070.
30. Bugyik E., Dezsö K., Turányi E., et. al.: 1,4-Bis[2-(3,5-dichloropyridyloxy)] benzene induces substantial hyperplasia in fibrotic mouse liver. Int J Exp Pathol 2012; 93: pp. 125-129.
31. Schnell M.A., Hardy C., Hawley M., et. al.: Effect of blood collection technique in mice on clinical pathology parameters. Hum Gene Ther 2002; 13: pp. 155-162.
32. Mazzaccara C., Labruna G., Cito G., et. al.: Age-related reference intervals of the main biochemical and hematological parameters in C57BL/6J, 129SV/EV and C3H/HeJ mouse strains. PLoS ONE 2008; 3: e3772
33. Fernández I., Peña A., del Teso N., et. al.: Clinical biochemistry parameters in C57BL/6J mice after blood collection from the submandibular vein and retroorbital plexus. J Am Assoc Lab Anim Sci 2010; 49: pp. 202-206.
34. Tschuor C., Kachaylo E., Limani P., et. al.: Constitutive androstane receptor (Car)-driven regeneration protects liver from failure following tissue loss. J Hepatol 2016; 65: pp. 66-74.
35. Planas-Paz L., Orsini V., Boulter L., et. al.: The RSPO-LGR4/5-ZNRF3/RNF43 module controls liver zonation and size. Nat Cell Biol 2016; 18: pp. 467-479.