
Rationale and Objective
Because lower limb muscles differ in architecture and function, the systemic effects of chronic obstructive pulmonary disease (COPD) and related disuse may result in regional abnormalities. The purpose of this study was to investigate the differences between patients with COPD and healthy controls in three-dimensional shape and size measurements of individual thigh muscles.
Materials and Methods
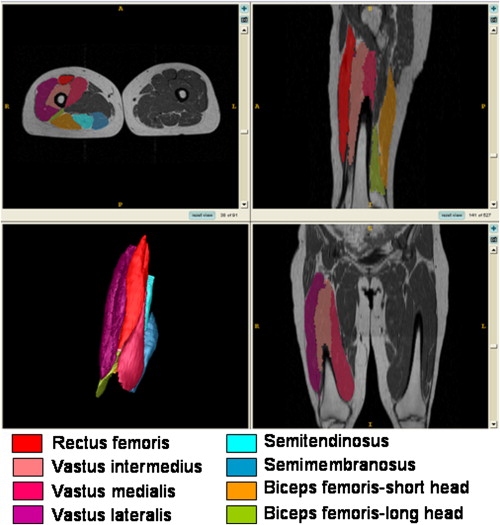
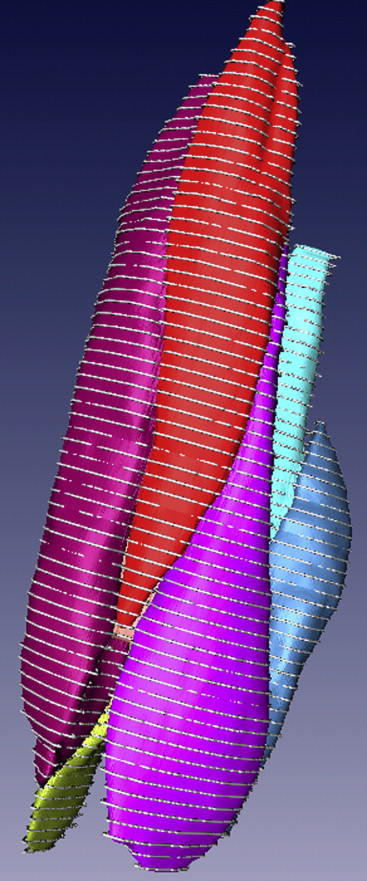
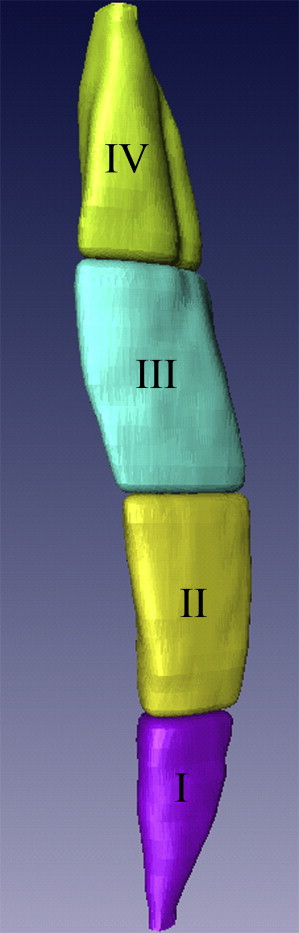
Twenty patients with COPD and 20 healthy adults (aged 55–79 years) underwent magnetic resonance imaging of the thighs. After manual segmentation of individual knee extensor and flexor muscles, the three-dimensional shape of each muscle was obtained using specialized software. Eight shape descriptors were computed both globally (for the whole muscle) and regionally (for portions of the muscle). A two-tailed t test with a modified Bonferroni correction was used to compare group differences.
Results
Compared to the thigh muscles of healthy subjects, vastus intermedius and semimembranosus showed the most shape abnormalities in the COPD group ( P < .01). Greater regional shape anomalies in the COPD group were found in the middle to proximal regions of all knee extensor muscles and the middle region of the semimembranosus muscle, compared to those of the control group ( P < .01). In the COPD group, more shape abnormalities were found in the knee extensors than in the knee flexors ( P < .01).
Conclusions
A non-uniform distribution of atrophy and size changes was found across knee extensors and flexors in patients with COPD. Further research is required to investigate the underlying mechanisms of regional morphologic abnormalities of the thigh muscles and the increased susceptibility of the knee extensors to atrophy-related anatomic anomalies in COPD.
Skeletal muscle weakness, particularly in the lower extremities, is common in patients with chronic obstructive pulmonary disease (COPD) . In fact, lower limb muscles are typically more adversely affected than respiratory muscles in this patient population, in part because of disuse . COPD-related muscle weakness is also associated with other systemic comorbidities, including abnormal arterial blood gases (hypoxia, hypercapnia), malnutrition, systemic inflammation, oxidative stress, and low testosterone levels . Of interest, the magnitude of skeletal muscle weakness in patients with COPD ranges widely among patients , likely reflecting individual differences in the contribution of factors involved in poor muscle performance.
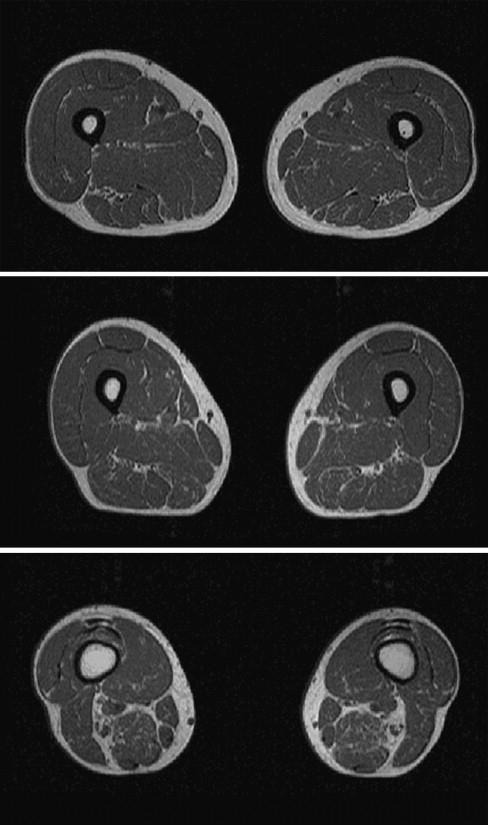
It has been suggested that the loss of muscle mass (size) is associated with skeletal muscle weakness in patients with COPD . However, the contribution of reduced muscle mass relative to other factors, such as changes in the muscle contractile apparatus and/or neuromuscular activation, is unknown . Comprehensive measures of muscle size and shape are therefore required to more precisely examine the relative contribution of muscle mass reduction to force loss. Magnetic resonance imaging (MRI) can be used to accurately distinguish muscle from bone, connective tissue, nerves, and blood vessels and can therefore provide accurate measures of muscle cross-sectional area (CSA) .
Get Radiology Tree app to read full this article<
Get Radiology Tree app to read full this article<
Get Radiology Tree app to read full this article<
Materials and methods
Subjects
Get Radiology Tree app to read full this article<
Get Radiology Tree app to read full this article<
Table 1
Characteristics of Patients with COPD and Healthy Older Adults
Characteristic Healthy Older Adults ( n = 20) Patients with COPD ( n = 20) Age (y) 64.4 ± 8.1 68.2 ± 10.0 Women/men 11/9 11/9 Height (m) 1.67 ± 0.13 1.66 ± 0.09 Weight (kg) 69.0 ± 14.4 72.1 ± 14.6 BMI (kg/m 2 ) 24.3 ± 2.2 26.6 ± 4.7Lung function FEV 1 (L) (% predicted) ∗ 2.28 ± 0.72 (81 ± 20) 1.34 ± 0.41 (51 ± 17) FVC (L) (% predicted) ∗ 3.05 ± 1.11 (83 ± 20) 2.58 ± 0.47 (78 ± 14) FEV 1 /FVC (%) ∗ 77 ± 9 52 ± 14
BMI, body mass index; COPD, chronic obstructive pulmonary disease; FEV 1 , forced expiratory volume in 1 second; FVC, forced vital capacity.
Get Radiology Tree app to read full this article<
Get Radiology Tree app to read full this article<
MRI
Get Radiology Tree app to read full this article<
Get Radiology Tree app to read full this article<
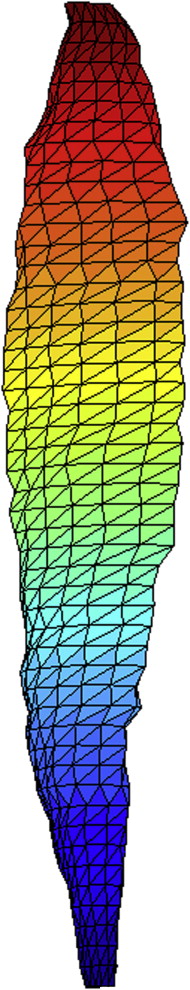
Image Segmentation and Interpolation
Get Radiology Tree app to read full this article<
Get Radiology Tree app to read full this article<
Shape Descriptor Computation
Get Radiology Tree app to read full this article<
Get Radiology Tree app to read full this article<
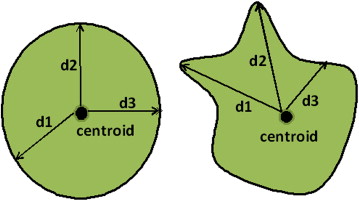
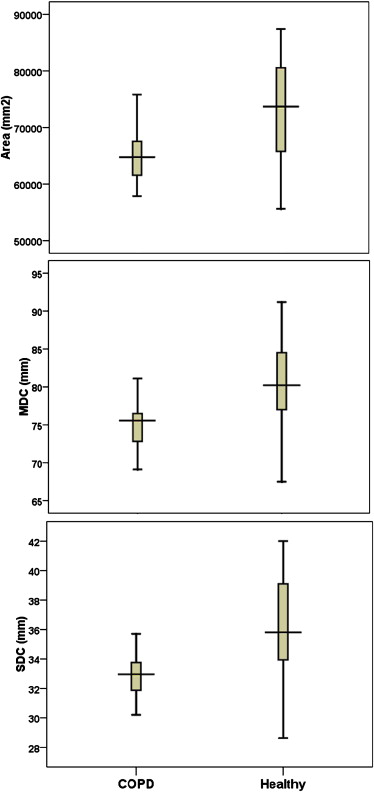
Mean Distance to the Centroid (MDC) and Standard Deviation of Distances to the Centroid (SDC)
Get Radiology Tree app to read full this article<
Get Radiology Tree app to read full this article<
Three-dimensional Moment Invariants
Get Radiology Tree app to read full this article<
Get Radiology Tree app to read full this article<
Surface Area and Volume
Get Radiology Tree app to read full this article<
Get Radiology Tree app to read full this article<
Statistical Analysis
Get Radiology Tree app to read full this article<
Table 2
Differences Between 3D Shape Descriptors for Global Analysis in Healthy Subjects Compared to Patients with COPD
Muscle MDC (mm) SDC (mm) Moment 1 (mm 2 ) Moment 2 (mm 4 ) Moment 3 (mm 6 ) Area (mm 2 ) RF Mean (SE) 3.08 (1.33) 1.19 (0.74) 7.68E7 (2.91E7) ∗ 4.78E15 (1.71E15) † 4.18E22 (1.84E22) 2,549.10 (1,523.03) 95% CI 0.39–5.79 0.31–2.70 1.78E7–1.36E8 1.32E15–8.25E15 4.58E21–7.91E22 534.11–5,632.31 VI Mean (SE) 5.31 (1.66) † 3.12 (1.00) † 1.58 E8 (5.52E7) † 1.83E16 (6.42E15) † 4.87E23 (1.81E23) ∗ 7,492.95 (2,364.59) † 95% CI 1.95–8.67 1.08–5.15 4.57E7–2.69E8 5.31E15–3.13E16 1.22E23–8.52E23 2,706.08–12,279.82 VM Mean (SE) 2.12 (1.06) 0.74 (0.79) 8.49E7 (4.15E7) 1.11E16 (5.33E15) 2.83E23 (1.46E23) 4,667.11 (1,770.98) ∗ 95% CI 0.03–4.27 0.87–2.35 9.07E5–1.69E8 3.14E14–2.19E16 1.14E22–5.78E23 1,081.94–8,252.27 BF-SH Mean (SE) 3.78 (1.55) 2.13 (0.855) 3.65E7 (1.39E7) ∗ 7.15 E14 (2.71E14) ∗ 2.84 E21 (1.21E21) 2,277.42 (1,171.59) 95% CI 0.63–6.92 0.40–3.87 8.39E6–6.47E7 1.68E14–1.26E15 3.96E20–5.29E21 94.35–4,649.18 SM Mean (SE) 5.30 (1.56) † 2.47 (0.88) † 7.49E7 (2.36E7) † 3.25E15 (1.46E15) 3.87E22 (1.97E22) 4,516.24 (1,732.28) ∗ 95% CI 2.15–8.45 0.689–4.24 2.71E7–1.23E8 2.99E14–6.21E15 1.21E21–7.86E22 1,009.41–8,023.07
Statistical measures are reported as mean difference (SE) and 95% CI of the difference. Mean difference is defined as the average absolute difference of group means for each shape descriptor (independent values).
BF-SH, biceps femoris–short head; CI, confidence interval; COPD, chronic obstructive pulmonary disease; MDC, mean distance to the centroid; RF, rectus femoris; SDC, standard deviation of distances to the centroid; SE, standard error; SM, semimembranosus; VI, vastus intermedius; VM, vastus medialis.
Get Radiology Tree app to read full this article<
Get Radiology Tree app to read full this article<
Get Radiology Tree app to read full this article<
Classification Accuracy
Get Radiology Tree app to read full this article<
Results
Analysis of Global Muscle Shape Descriptors
Get Radiology Tree app to read full this article<
Get Radiology Tree app to read full this article<
Analysis of Regional Muscle Shape Descriptors
Get Radiology Tree app to read full this article<
Get Radiology Tree app to read full this article<
Table 3
Differences of Three-dimensional Shape Descriptors for Regional Analysis in Healthy Subjects Compared to Patients with COPD
Muscle Shape Descriptor Region ∗ Mean (SE) of Difference_P_ 95% CI of Difference RF SDC (mm) III 0.91(0.32) .004 0.26–1.54 Area (mm 2 ) III 1,280.20 (460.65) .008 347.66–2,212.73 VL Volume (mm 3 ) II 35,101.15 (9,491.81) .001 15,850.87–54,351.44 Volume (mm 3 ) III 31,114.11 (8,840.89) .001 13,200.76–49,027.46 Area (mm 2 ) III 2,373.28 (860.72) .009 629.30–4,117.26 VI Area (mm 2 ) III 2,634.61 (739.64) .001 1,137.29–4,131.94 VM SDC (mm) II 0.87 (0.26) .001 0.35–1.39 SDC (mm) III 1.28 (0.33) .000 0.62–1.94 SDC (mm) IV 0.96 (0.29) .002 0.37–1.56 Area (mm 2 ) II 1,461.19 (475.00) .004 499.60–2,422.79 Area (mm 2 ) III 1,160.76 (313.56) .001 523.54–1,797.99 SM Area (mm 2 ) II 1,441.56 (546.37) .005 335.48–2,547.64 Volume (mm 3 ) II 16,631.14 (5,140.63) .003 6,215.23–27,047.05
The shape descriptors and corresponding regions that revealed significant between group differences in regional analysis are presented in columns 2 and 3, respectively. Statistical measures are reported as mean difference (SE) and 95% CI of the difference. Mean difference is defined as the average absolute difference of group means for each shape descriptor (independent values).
CI, confidence interval; COPD, chronic obstructive pulmonary disease; RF, rectus femoris; SDC, standard deviation of distances to the centroid; SE, standard error; SM, semimembranosus; VI, vastus intermedius; VL, vastus lateralis; VM, vastus medialis.
Get Radiology Tree app to read full this article<
Get Radiology Tree app to read full this article<
Classification Accuracy
Get Radiology Tree app to read full this article<
Table 4
SVM Classification Rates
Muscle Groups Muscle Classification Rate Using All Features (%) Knee extensors (quadriceps) Rectus femoris 99.9 Vastus medialis 97.0 Vastus intermedius 99.9 Vastus lateralis 97.5 Knee flexors (hamstrings) Biceps femoris–long head 99.9 Biceps femoris–short head 95.0 Semimembranosus 97.3 Semitendinosus 99.8
SVM, support vector machine.
Get Radiology Tree app to read full this article<
Discussion
Differences in MDC, Surface Area, and SDC
Get Radiology Tree app to read full this article<
Get Radiology Tree app to read full this article<
Physiologic Implications of Global and Regional Measurements
Get Radiology Tree app to read full this article<
Get Radiology Tree app to read full this article<
Distribution of Shape Abnormalities and Atrophy Among Thigh Muscles in COPD
Get Radiology Tree app to read full this article<
Get Radiology Tree app to read full this article<
Measurement of Muscle Volume and Comparison to Previous Studies
Get Radiology Tree app to read full this article<
Automated Group Classification on the Basis of Shape Measures
Get Radiology Tree app to read full this article<
Significance of the Study
Get Radiology Tree app to read full this article<
Limitations and Future Work
Get Radiology Tree app to read full this article<
Get Radiology Tree app to read full this article<
Conclusions
Get Radiology Tree app to read full this article<
Get Radiology Tree app to read full this article<
References
1. Gosselink R., Troosters T., Decramer M.: Peripheral muscle weakness contributes to exercise limitation in COPD. Am J Respir Crit Care Med 1996; 153: pp. 976-980.
2. Nici L., Donner C., Wouters E., et. al.: American Thoracic Society/European Respiratory Society statement on pulmonary rehabilitation. Am J Respir Crit Care Med 2006; 173: pp. 1390-1413.
3. Bernard S., LeBlanc P., Whittom F., et. al.: Peripheral muscle weakness in patients with chronic obstructive pulmonary disease. Am J Respir Crit Care Med 1998; 158: pp. 629-634.
4. Casaburi R.: Skeletal muscle dysfunction in chronic obstructive pulmonary disease. Med Sci Sports Exerc 2001; 33: pp. S662-S670.
5. Engstrom C.M., Loeb G.E., Reid J.G., et. al.: Morphometry of the human thigh muscles: a comparison between anatomical sections and computer tomographic and magnetic resonance images. J Anat 1991; 176: pp. 139-156.
6. Tracy B.L., Ivey F.M., Metter J.E., et. al.: A more efficient magnetic resonance imaging-based strategy for measuring quadriceps muscle volume. Med Sci Sports Exerc 2003; 35: pp. 425-433.
7. Seymour J.M., Ward K., Sidhu P.S., et. al.: Ultrasound measurement of rectus femoris cross-sectional area and the relationship with quadriceps strength in COPD. Thorax 2009; 64: pp. 418-423.
8. Marquis K., Debigare R., Lacasse Y., et. al.: Midthigh muscle cross-sectional area is a better predictor of mortality than body mass index in patients with chronic obstructive pulmonary disease. Am J Respir Crit Care Med 2002; 166: pp. 809-813.
9. Akima H., Kano Y., Enomoto Y., et. al.: Muscle function in 164 men and women aged 20-84 yr. Med Sci Sports Exerc 2001; 33: pp. 220-226.
10. Visser M., Goodpaster B.H., Kritchevsky S.B., et. al.: Muscle mass, muscle strength, and muscle fat infiltration as predictors of incident mobility limitations in well-functioning older persons. J Gerontol A Biol Sci Med Sci 2005; 60: pp. 324-333.
11. Overend T.J., Cunningham D.A., Kramer J.F., et. al.: Knee extensor and knee flexor strength: cross-sectional area ratios in young and elderly men. J Gerontol 1992; 47: pp. M204-M210.
12. Mathur S., Takai K.P., Macintyre D.L., et. al.: Estimation of thigh muscle mass with magnetic resonance imaging in older adults and people with chronic obstructive pulmonary disease. Phys Ther 2008; 88: pp. 219-230.
13. Global Initiative for Obstructive Lung Disease: Global strategy for the diagnosis, management and prevention of chronic obstructive pulmonary disease.2004.National Heart, Lung and Blood InstituteBethesda, MD 6–8
14. American Thoracic Society/European Respiratory Society: Skeletal muscle dysfunction in chronic obstructive pulmonary disease: a statement of the American Thoracic Society and the European Respiratory Society. Am J Respir Crit Care Med 1999; 159: pp. S1-S40.
15. Yushkevich P.A., Piven J., Hazlett H.C., et. al.: User-guided 3D active contour segmentation of anatomical structures: significantly improved efficiency and reliability. Neuroimage 2006; 31: pp. 1116-1128.
16. Agur A.M.R., Grant J.C.B., Dalley A.F.: Grant’s atlas of anatomy.12th ed.2009.Lippincott Williams & WilkinsPhiladelphia
17. Marinkovic S., Schellinger D., Milisavljevic M., et. al.: Sectional and MRI anatomy of the human body: a photographic atlas.2000.Thieme VerlagStuttgart, Germany
18. Willan P.L.T., Ransome J.A., Mahon M.: Variability in human quadriceps muscles: Quantitative study and review of clinical literature. Clin Anat 2002; 15: pp. 116-128.
19. Sadjadi F.A., Hall E.L.: Three dimensional moment invariants. IEEE PAMI 1980; 2: pp. 127-136.
20. Ward A.D., Hamarneh G., Ashry R., et. al.: 3D shape analysis of the supraspinatus muscle: a clinical study of the relationship between shape and pathology. Acad Radiol 2007; 14: pp. 1229-1241.
21. Lorensen W.E., Cline H.E.: Marching cubes: a high resolution 3D surface construction algorithm. Comput Graph 1987; 21: pp. 163-169.
22. Pocock S.J., Geller N.L., Tsiatis A.A.: The analysis of multiple endpoints in clinical trials. Biometrics 1987; 43: pp. 487-498.
23. Fradkin D., Muchnik I.: Support vector machines for classification. DIMACS Ser Discrete Math Theoret Comput Sci 2006; 70: pp. 13-20.
24. Narici M.V., Capodaglio P.: Changes in muscle size and architecture in disuse-atrophy.Capodaglio P.Narici M.V.Muscle atrophy: disuse and disease.1998.PI-ME PressPavia, Italy:pp. 55-63.
25. Kubo K., Kanehisa H., Azuma K., et. al.: Muscle architectural characteristics in young and elderly men and women. Int J Sports Med 2003; 24: pp. 125-130.
26. Kawakami Y., Abe T., Fukunaga T.: Muscle-fiber pennation angles are greater in hypertrophied than in normal muscles. J Appl Physiol 1993; 74: pp. 2740-2744.
27. Kendall F.P., McCreary E.K., Provance P.G., et. al.: Muscles: testing and function with posture and pain.5th ed.2005.Lippincott Williams & WilkinsBaltimore, MD
28. Gosker H.R., Engelen M.P., van Mameren H., et. al.: Muscle fiber type IIX atrophy is involved in the loss of fat-free mass in chronic obstructive pulmonary disease. Am J Clin Nutr 2002; 76: pp. 113-119.
29. Johnson M.A., Polgar J., Weightman D., et. al.: Data on the distribution of fibre types in thirty-six human muscles: an autopsy study. J Neurol Sci 1973; 18: pp. 111-129.
30. Faden A., Mendoza E., Flynn F.: Subclinical neuropathy associated with chronic obstructive pulmonary disease: possible pathophysiologic role of smoking. Arch Neurol 1981; 38: pp. 639-642.
31. Pozza J.J., Marti-Masso J.F.: Peripheral neuropathy associated with chronic obstructive pulmonary disease. Neurologia 1997; 12: pp. 12389-12394.
32. Agusti A.G.N., Noguera A., Sauleda J., et. al.: Systemic effects of chronic obstructive pulmonary disease. Eur Respir J 2003; 21: pp. 347-360.
33. Mathur S., MacIntyre D.L., Forster B.B., et. al.: Fat infiltration in the quadriceps and hamstrings in people with COPD and lung transplant recipients. Med Sci Sports Exerc 2005; 37: pp. S243-S244.
34. Roberts N., Cruz-Orive L.M., Reid M.K., et. al.: Unbiased estimation of human body composition by the cavalieri method using magnetic resonance imaging. J Microsc 1993; 171: pp. 239-253.
35. Pizer S.M., Fletcher P.T., Joshi S., et. al.: Deformable M-reps for 3D medical image segmentation. Int J Comput Vis 2003; 55: pp. 85-106.
36. Hamarneh G., Ward A.D., Frank R.: Quantification and visualization of localized and intuitive shape variability using a novel medial-based shape representation. Proc IEEE Conf Int Symp Biomed Imaging 2007; pp. 1232-1235.