
Rationale and Objectives
This report demonstrates the diagnostic potential of magnetic resonance imaging (MRI)-coupled fluorescence molecular tomography (FMT) to determine epidermal growth factor receptor (EGFR) status in brain cancer.
Materials and Methods
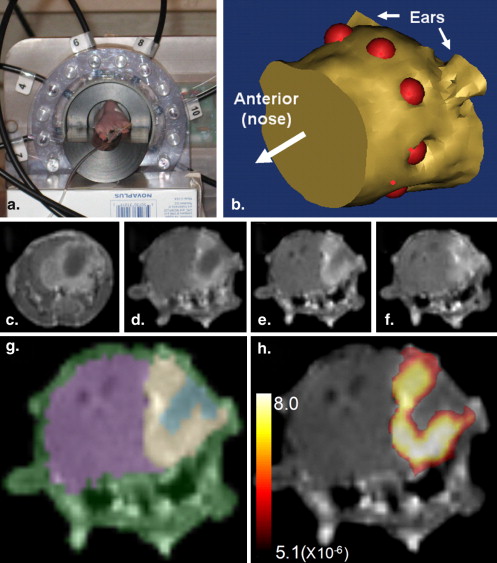
Two orthotopic glioma xenograft models were used in this study: one represented high EGFR expression and the other low expression. Nude mice were inoculated with cells from either one of the tumor lines or were used in a sham surgery control group. Animals were imaged using a unique MRI-FMT scanner 48 hours after intravenous injection of a near-infrared fluorophore bound to epidermal growth factor (EGF) ligand. Coronal images of fluorescence activity of the injected dye in the mouse brain were recovered using the MRI images as anatomical templates.
Results
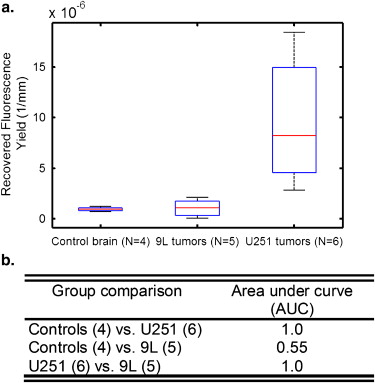
In vivo images of fluorescence activity showed significant differences between animal populations, an observation confirmed by receiver operating characteristic analysis that revealed 100% sensitivity and specificity between animal groups implanted with EGFR (+) and EGFR (-) tumor lines. Similar performance was observed between EGFR (+) and sham surgery control animals.
Conclusions
This preclinical study suggests that MRI-FMT with fluorescent EGF provides excellent discrimination between tumors based on EGFR status. Reliable quantification of receptor status using minimally invasive techniques would be an important innovation for investigating new and existing cancer treatments that target these cellular mechanisms in research animals, and may be applied to identify receptor amplification in human brain cancer patients. This study represents the first systematic multianimal validation of receptor-specific imaging using MRI-guided fluorescence tomography.
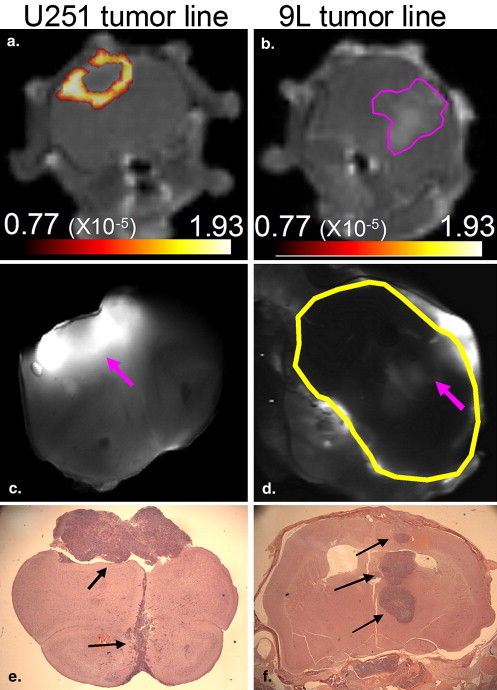
Epidermal growth factor receptor (EGFR) is a cell receptor known to be amplified in a large percentage of cancers, 55% by some estimates, and contributes to malignant cell proliferation when activated via binding by an associated ligand, such as epidermal growth factor (EGF) . Shutting down this pathway to halt malignant proliferation has been the subject of many research and drug development efforts in recent years and several EGFR-targeted therapies are now commonly used against some forms of cancer ; however, the ability to image EGFR activity has not been widely examined in a way which would translate to human use. The preclinical study reported here examines the diagnostic potential of magnetic resonance imaging (MRI)-coupled fluorescence molecular tomography (FMT) to determine EGFR status between two different brain tumor cell lines: U251 (human glioma) and 9L-GFP (rat gliosarcoma transfected with green fluorescent protein). In vitro studies using flow cytometry have previously demonstrated that the U251 tumors have a 20-fold higher uptake of EGF as compared to the 9L-GFP line, suggesting that EGFR expression is greatly amplified in this tumor cell line . Thus, these two cell lines were classified as either EGFR (+) or EGFR (-) for the purpose of this study.
FMT is a minimally invasive imaging modality for studying the underlying biology of disease in living tissue. Preclinical studies in murine models make up the bulk of the in vivo FMT studies reported in the literature, which includes efforts to quantify enzyme activity in arthrosclerotic inflammation and gliomas , myocardial macrophage infiltration , bone regeneration , drug sensitivity in lung carcinoma , and other tumor-specific mechanisms in lung , breast and brain tumors . This modality is well suited for investigating processes associated with transmembrane protein receptors that are frequently amplified in tumor cells. The higher receptor density on malignant cells provides a natural contrast mechanism for molecular probes with high affinity for the protein binding sites. Exploiting this abnormal biology with FMT could help identify tumors with amplified receptor status, monitor the binding capacity of therapeutic drugs, and track overall tumor burden. This is especially effective when the demonstrated benefits of FMT are combined with structural-based information provided by conventional imaging tools, as is done here.
Materials and methods
Get Radiology Tree app to read full this article<
Get Radiology Tree app to read full this article<
Get Radiology Tree app to read full this article<
Get Radiology Tree app to read full this article<
Get Radiology Tree app to read full this article<
Get Radiology Tree app to read full this article<
Results
Get Radiology Tree app to read full this article<
Get Radiology Tree app to read full this article<
Get Radiology Tree app to read full this article<
Get Radiology Tree app to read full this article<
Get Radiology Tree app to read full this article<
Discussion
Get Radiology Tree app to read full this article<
Get Radiology Tree app to read full this article<
Get Radiology Tree app to read full this article<
Get Radiology Tree app to read full this article<
Get Radiology Tree app to read full this article<
Conclusion
Get Radiology Tree app to read full this article<
Acknowledgments
Get Radiology Tree app to read full this article<
Get Radiology Tree app to read full this article<
References
1. Carpenter G.: Receptors for epidermal growth factor and other polypeptide mitogens. Annu Rev Biochem 1987; 56: pp. 881-914.
2. Ciardiello F., Tortora G.: A novel approach in the treatment of cancer: targeting the epidermal growth factor receptor. Clin Cancer Res 2001; 7: pp. 2958-2970.
3. Marshall J.: Clinical implications of the mechanism of epidermal growth factor receptor inhibitors. Cancer Res 2006; 107: pp. 1207-1218.
4. Mendelsohn J., Baselga J.: Status of epidermal growth factor receptor antagonists in the biology and treatment of cancer. J Clin Oncol 2003; 21: pp. 2787-2799.
5. Gibbs-Strauss S.L., Samkoe K.S., O’Hara J.A., et. al.: Detecting epidermal growth factor receptor tumor activity in vivo during cetuximab therapy of murine gliomas. Acad Radiol 2010; 17: pp. 7-17.
6. Deguchi J.-o., Aikawa M., Tung C.-H., et. al.: Inflammation in atherosclerosis: visualizing matrix metalloproteinase action in macrophages in vivo. Library 2006; 114: pp. 55-62.
7. Ntziachristos V., Tung C.H., Bremer C., et. al.: Fluorescence molecular tomography resolves protease activity in vivo. Na Med 2002; 8: pp. 757-760.
8. Sosnovik D.E., Nahrendorf M., Deliolanis N., et. al.: Fluorescence tomography and magnetic resonance imaging of myocardial macrophage infiltration in infarcted myocardium in vivo. Circulation 2007; 115: pp. 1384-1391.
9. Zilberman Y., Kallai I., Gafni Y., et. al.: Fluorescence molecular tomography enables in vivo visualization and quantification of nonunion fracture repair induced by genetically engineered mesenchymal stem cells. J Orthop Res 2008; 26: pp. 522-530.
10. Ntziachristos V., Schellenberger E.A., Ripoll J., et. al.: Visualization of antitumor treatment by means of fluorescence molecular tomography with an annexin V-Cy5.5 conjugate. Proc Natl Acad Sci U S A 2004; 101: pp. 12294-12299.
11. Deliolanis N.C., Dunham J., Wurdinger T., et. al.: In-vivo imaging of murine tumors using complete-angle projection fluorescence molecular tomography. J Biomed Optics 2009; 14: pp. 1-3.
12. Montet X., Ntziachristos V., Grimm J., et. al.: Tomographic fluorescence mapping of tumor targets. Cancer Res 2005; 65: pp. 6330-6336.
13. Patwardhan S.V., Bloch S.R., Achilefu S., et. al.: Time-dependent whole-body fluorescence tomography of probe bio-distributions in mice. Opt Exp 2005; 13: pp. 2564-2577.
14. Davis S.C., Pogue B.W., Springett R., et. al.: Magnetic resonance-coupled fluorescence tomography scanner for molecular imaging of tissue. Rev Sci Instr 2008; 79: 064302–1 to -10
15. McCann C.M., Waterman P., Figueiredo J.-L., et. al.: Combined magnetic resonance and fluorescence imaging of the living mouse brain reveals glioma response to chemotherapy. Neuroimage 2009; 45: pp. 360-369.
16. Arridge S.R., Schweiger M.: Photon-measurement density functions. Part 2: finite-element-method calculations. Appl Opt 1995; 34: pp. 8026-8037.
17. Davis S.C., Dehghani H., Wang J., et. al.: Image-guided diffuse optical fluorescence tomography implemented with Laplacian-type regularization. Optics Exp 2007; 15: pp. 4066-4082.
18. van der Zee P.: Measurement and modeling of the optical properties of human tissue in the near infrared. PhD Thesis.1992.Department of Medical Physics and Bioengineering, University College LondonLondon