
Rationale and Objectives
The aim of this study was to assess regional myocardial function in patients with chronic thromboembolic hypertension (CTEPH) before and after successful pulmonary endarterectomy (PEA) using magnetic resonance imaging.
Methods
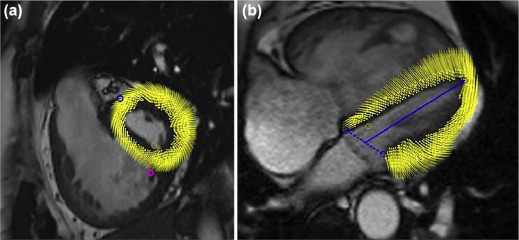
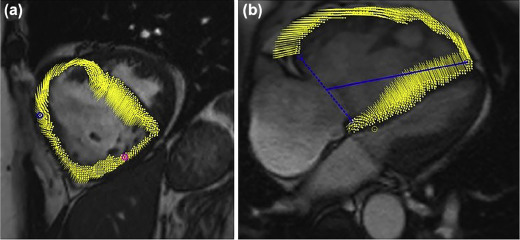
Twenty-two patients with CTEPH underwent cardiac magnetic resonance imaging before and 12 (11, 17) days after PEA. Mean pulmonary artery pressure was evaluated preoperatively by right heart catheterization and during post-PEA intensive care unit-stay using a Swan-Ganz catheter. Biventricular peak systolic longitudinal, radial, circumferential strain and time-to-peak strain were obtained by tissue-tracking analysis.
Results
Mean pulmonary artery pressure decreased (46 mm Hg (34.5, 55) to 24 mm Hg (16, 27); P < .0001) and stroke volume increased ( P < .0001) after PEA. In the right ventricle (RV) peak radial strain increased in the anterior ( P = .04) and in the inferior wall ( P = .0012) and slightly missed statistical significance in the lateral wall ( P = .051) and septum ( P = .07). Circumferential strain increased in the lateral ( P = .0002) and inferior wall of the RV ( P = .03) and in the lateral as well as in the inferior wall of the left ventricle ( P = .01; P = .03). Radial, longitudinal, and circumferential time-to-peak strain shortened ( P < .0001) with resynchronization of the ventricles 12 days after PEA.
Conclusion
While biventricular resynchronization and recovery of global predominantly RV function was observed, regional circumferential function mainly improved in the lateral and inferior walls of both ventricles and regional radial function in the RV wall and septum 12 days after PEA, suggesting fibers primarily affected by myocardial stress in patients with CTEPH possibly need a relatively longer recovery time.
Background
Chronic thromboembolic pulmonary hypertension (CTEPH) is a life-threatening cause of shortness of breath that leads to chronic elevation of mean pulmonary artery pressure (mPAP) and pulmonary vascular resistance . CTEPH occurs in about 3.8% of patients after acute pulmonary embolism, with a mean survival of patients with mPAP >30 mm Hg of less than 2 years without therapy . Right heart failure is the main cause of death in this patient group. Thus, effective treatment of CTEPH needs to lower pulmonary vascular resistance and to improve cardiac function to improve patient outcome. Currently, pulmonary endarterectomy (PEA) is the treatment of choice to treat CTEPH with a perioperative mortality of 2%–4% and strong scientific evidence for improved patient outcome .
An important factor for clinical improvement and prolonged survival is restored biventricular function after PEA . As right ventricle (RV) and left ventricle (LV) share the interventricular septum, increased right ventricular pressure and volume load lead to septal bowing and result in impaired left ventricular function . Not only global, but also regional impairment of biventricular myocardial function is therefore of growing scientific interest .
Get Radiology Tree app to read full this article<
Get Radiology Tree app to read full this article<
Get Radiology Tree app to read full this article<
Methods
Get Radiology Tree app to read full this article<
Get Radiology Tree app to read full this article<
MRI Examination
Get Radiology Tree app to read full this article<
Get Radiology Tree app to read full this article<
Get Radiology Tree app to read full this article<
MRI Data Analysis
Get Radiology Tree app to read full this article<
Get Radiology Tree app to read full this article<
Get Radiology Tree app to read full this article<
Get Radiology Tree app to read full this article<
Get Radiology Tree app to read full this article<
Get Radiology Tree app to read full this article<
Get Radiology Tree app to read full this article<
Statistical Analysis
Get Radiology Tree app to read full this article<
Results
Get Radiology Tree app to read full this article<
TABLE 1
Results—Clinical Data and Global Myocardial Function
Clinical Data Pre (n = 22) Post (n = 22)P Value Age (y) 50.5 (40.75, 60.75) Sex Female (n, %) 7 (31.8) 7 (31.8) Male (n, %) 15 (68.2) 15 (68.2) mPAP (mm Hg) 46 (35, 55) 24 (16, 27) <.0001 LVEF (%) 61 (54, 68) 59 (56, 65) .949 RVEF (%) 35 (25, 51) 48 (41, 57) <.0001 LVSV/BSA (mL/m 2 ) 32 (28, 38) 39 (35, 43) .2538 RVSV/BSA (mL/m 2 ) 35 (28, 40) 40 (35, 45) .1536 LV-EDV/BSA (mL/m 2 ) 55 (47, 68) 64 (59, 70) .0851 RV-EDV/BSA (mL/m 2 ) 106 (76, 128) 83 (60, 99) .0001 RV-EDV/LV-EDV 1.7 (1.4, 2.2) 1.3 (1.1, 1.4) <.0001 LV-ESV/BSA (mL/m 2 ) 23 (15, 30) 25 (21, 31) .2058 RV-ESV/BSA (mL/m 2 ) 69 (46, 95) 41 (28, 54) <.0001 LV-CO (mL/min) 5169 (4117, 6630) 6553 (5349, 7932) .0005 RV-CO (mL/min) 5408 (4702, 6641) 6694 (5532, 8756) .0006 RV-mass/BSA (g/m 2 ) 42 (35, 63) 37 (29, 52) .0006 Pre Post [3-mo follow-up] NYHA class n = 15 n = 14 .002 0 0 (0) 1 (7.1) I. (n, %) 2 (9.5) 5 (35.7) II. (n, %) 5 (23.8) 6 (42.9) III. (n, %) 13 (61.9) 2 (14.3) IV. (n, %) 1 (4.8) 0 (0) 6-min-WD (m) n = 22 n = 15 330 (259, 475) 458 (392, 517) .0498
BSA, body surface area; LV-CO, left ventricular cardiac output; LV-EDV, left ventricular end-diastolic volume; LVEF, left ventricular ejection fraction; LV-ESV, left ventricular end-systolic volume; LVSV, left ventricular stroke volume; mPAP, mean pulmonary artery pressure; NYHA, New York Heart Association; RV-CO, right ventricular cardiac output; RV-EDV, right ventricular end-diastolic volume; RVEF, right ventricular ejection fraction; RV-ESV, right ventricular end-systolic volume; RV-mass, right ventricular mass; RVSV, right ventricular stroke volume; 6-min-WD, 6-min walking distance.
Get Radiology Tree app to read full this article<
Right Ventricle
Get Radiology Tree app to read full this article<
Get Radiology Tree app to read full this article<
Get Radiology Tree app to read full this article<
TABLE 2
Results—Right Ventricular (RV) and Left Ventricular (LV) Regional Myocardial Function
Pre (n = 22) Post (n = 22)P Value ANTERIOR RV-peak strain Radial 5.4 (0.2, 9.6) 10.2 (7.0, 11.4) .0359 Circumferential 4.8 (0.3, 7.7) 1.1 (−4.6, 6.7) .1873 LV-peak strain Radial 20.5 (16.4, 22.6) 22.0 (16.8, 24.9) .6477 Circumferential − 9.4 (−12.5, −5.8) −13.5 (−14.4, −10.9) .1627 RV-time to peak (ms) Radial 340.7 (226.5, 392.7) 291.2 (242.3, 323.4) .095 Circumferential 357.7 (275.8, 513.8) 241.6 (215.8, 266.6) <.0001 LV-time to peak (ms) Radial 305.1 (284.0, 377.0) 255.8 (237.3, 292.6) <.0001 Circumferential 283.6 (230.9, 390.1) 257.0 (242.0, 288.1) .065 LATERAL RV-peak strain Radial 11.4 (9.0, 12.4) 12.3 (14.5, 9.3) .0509 Circumferential −6.5 (−7.9, −3.9) −8.4 (−9.6, −6.6) .0002 Longitudinal −6.2 (−9.7, − 4.0) −7.4 (−9.1, −4.7) .4392 LV-peak strain Radial 24.6 (20.6, 28.8) 26.2 (22.2, 32.7) .2611 Circumferential −15.4 (−17.7, −12.6) −18.1 (−19.9, −16.5) .0057 Longitudinal −11.5 (−14.5, −6.2) −10.3 (−11.8, −7.6) .5604 RV-time to peak (ms) Radial 322.0 (291.0, 348.6) 269.4 (247.0, 310.8) .0074 Circumferential 327.5 (293.4, 370.9) 267.7 (246.3, 303.1) .0004 Longitudinal 313.1 (282,3, 388.4) 286.0 (263.3, 314.6) .0065 LV-time to peak (ms) Radial 276.8 (252.9, 324.3) 264.1 (255.4, 281.7) .3021 Circumferential 279.7 (254.1, 311.6) 276.8 (246.4, 291.1) .7417 Longitudinal 274.7 (244.8, 331.4) 260.7 (228.4, 280.7) .0223 INFERIOR RV-peak strain Radial 12.0 (6.3, 17.4) 17.8 (13.4, 22.3) .0012 Circumferential −5.5 (−9.1, −2.5) −10.4 (−12.8, −6.6) .0327 LV-peak strain Radial 21.2 (18.7, 27.0) 22.2 (19.0, 26.5) .7285 Circumferential −13.1 (−16.0, −8.2) −15.4 (−17.1, −12.6) .0386 RV-time to peak (ms) Radial 345.6 (311.1, 389.8) 271.1 (253.5, 322.1) .0001 Circumferential 365.0 (335.2, 448.1) 283.3 (245.4, 327.5) <.0001 LV-time to peak (ms) Radial 310.1 (250.0, 341.1) 275.7 (260.6, 311.7) .2009 Circumferential 292.5 (237.3, 364.1) 270.4 (250.4, 304.7) .35 SEPTAL LV-peak strain Radial 18.8 (12.9, 22.5) 18.9 (17.3, 24.3) .0696 Circumferential −11.1 (−13.3, −5.2) −11.9 (−14.6, −10.4) .2317 Longitudinal −8.5 (−10.2, −3.8) −9.3 (−10.5, −6.5) .9875 LV-time to peak (ms) Radial 299.0 (277.3, 366.3) 288.1 (268.7, 319.0) .1528 Circumferential 293.1 (265.7, 359.8) 289.1 (252.5, 321.3) .2317 Longitudinal 299.4 (266.1, 346.2) 286.1 (233.9, 319.2) .0359 GLOBAL RV-peak strain Radial 9.0 (6.8, 13.7) 13.1 (10.9, 16.0) .0057 Circumferential −1.6 (−5.9, − 0.8) −6.2 (−8.0, −3.5) .0223 LV-peak strain Radial 22.1 (16.3, 24.1) 21.6 (20.0, 24.1) .6486 Circumferential −12.2 (−15.0, −6.7) −14.4 (−15.4, −13.5) .0201 Longitudinal −9.7 (−11.9, −4.7) −9.9 (−11.2, −7.0) .6486 RV-time to peak (ms) Radial 327.7 (292.7, 368.6) 284.9 (254.3, 306.4) .0002 Circumferential 366.5 (307.6, 413.4) 261.6 (242.4, 286.0) <.0001 LV-time to peak (ms) Radial 297.3 (279.3, 337.3) 280.9 (255.8, 296.7) .0074 Circumferential 285.1 (258.0, 347.7) 280.7 (257.4, 297.6) .06 Longitudinal 287.3 (264.7, 319.0) 267.3 (243.7, 293.2) .0094
Get Radiology Tree app to read full this article<
Left Ventricle
Get Radiology Tree app to read full this article<
Time-to-Peak Strain
Get Radiology Tree app to read full this article<
Discussion
Get Radiology Tree app to read full this article<
Get Radiology Tree app to read full this article<
Get Radiology Tree app to read full this article<
Get Radiology Tree app to read full this article<
Get Radiology Tree app to read full this article<
Get Radiology Tree app to read full this article<
Get Radiology Tree app to read full this article<
Limitations
Get Radiology Tree app to read full this article<
Conclusion
Get Radiology Tree app to read full this article<
References
1. Chin K.M., Kim N.H., Rubin L.J.: The right ventricle in pulmonary hypertension. Coron Artery Dis 2005; 16: pp. 13-18.
2. Lewczuk J., Piszko P., Jagas J., et. al.: Prognostic factors in medically treated patients with chronic pulmonary embolism. Chest 2001; 119: pp. 818-823.
3. Hoeper M.M., Madani M.M., Nakanishi N., et. al.: Chronic thromboembolic pulmonary hypertension. Lancet Respir Med 2014; 2: pp. 573-582.
4. Kim N.H., Delcroix M., Jenkins D.P., et. al.: Chronic thromboembolic pulmonary hypertension. J Am Coll Cardiol 2013; 62: pp. D92-D99.
5. Cannon J.E., Su L., Kiely D.G., et. al.: Dynamic risk stratification of patient long-term outcome after pulmonary endarterectomy: results from the United Kingdom national cohort. Circulation 2016; 133: pp. 1761-1771.
6. Champion H.C., Michelakis E.D., Hassoun P.M.: Comprehensive invasive and noninvasive approach to the right ventricle-pulmonary circulation unit: state of the art and clinical and research implications. Circulation 2009; 120: pp. 992-1007.
7. Marcu C.B., Beek A.M., Van Rossum A.C.: Cardiovascular magnetic resonance imaging for the assessment of right heart involvement in cardiac and pulmonary disease. Heart Lung Circ 2006; 15: pp. 362-370.
8. Shehata M.L., Harouni A.A., Skrok J., et. al.: Regional and global biventricular function in pulmonary arterial hypertension: a cardiac MR imaging study. Radiology 2013; 266: pp. 114-122.
9. Grothues F., Moon J.C., Bellenger N.G., et. al.: Interstudy reproducibility of right ventricular volumes, function, and mass with cardiovascular magnetic resonance. Am Heart J 2004; 147: pp. 218-223.
10. Benza R., Biederman R., Murali S., et. al.: Role of cardiac magnetic resonance imaging in the management of patients with pulmonary arterial hypertension. J Am Coll Cardiol 2008; 52: pp. 1683-1692.
11. Harrild D.M., Han Y., Geva T., et. al.: Comparison of cardiac MRI tissue tracking and myocardial tagging for assessment of regional ventricular strain. Int J Cardiovasc Imaging 2012; 8: pp. 2009-2018.
12. Moore C.C., McVeigh E.R., Zerhouni E.A.: Noninvasive measurement of three-dimensional myocardial deformation with tagged magnetic resonance imaging during graded local ischemia. J Cardiovasc Magn Reson 1999; 1: pp. 207-222.
13. Neizel M., Lossnitzer D., Korosoglou G., et. al.: Strain-encoded (SENC) magnetic resonance imaging to evaluate regional heterogeneity of myocardial strain in healthy volunteers: comparison with conventional tagging. J Magn Reson Imaging 2009; 29: pp. 99-105.
14. Schmidt B., Dick A., Treutlein M., et. al.: Intra- and inter-observer reproducibility of global and regional magnetic resonance feature tracking derived strain parameters of the left and right ventricle. Eur J Radiol 2016; 89: pp. 97-105.
15. Lin K., Chowdhary V., Benzuly K.H., et. al.: Reproducibility and observer variability of tissue phase mapping for the quantification of regional myocardial velocities. Int J Cardiovasc Imaging 2016; 32: pp. 1227-1234.
16. Galiè N., Humbert M., Vachiery J.L., et. al.: 2015 ESC/ERS Guidelines for the diagnosis and treatment of pulmonary hypertension: the Joint Task Force for the Diagnosis and Treatment of Pulmonary Hypertension of the European Society of Cardiology (ESC) and the European Respiratory Society (ERS): endorsed by: Association for European Paediatric and Congenital Cardiology (AEPC), International Society for Heart and Lung Transplantation (ISHLT). Eur Heart J 2016; 37: pp. 67-119.
17. Hinrichs J.B., Werncke T., Kaireit T., et. al.: C-arm computed tomography adds diagnostic information in patients with chronic thromboembolic pulmonary hypertension and a positive V/Q SPECT. Rofo 2017; 189: pp. 49-56.
18. Hinrichs J.B., von Falck C., Hoeper M.M., et. al.: Pulmonary artery imaging in patients with chronic thromboembolic pulmonary hypertension: comparison of cone-beam CT and 64-row multidetector CT. J Vasc Interv Radiol 2016; 27: pp. 361-362.
19. Jenkins D.P., Madani M., Mayer E., et. al.: Surgical treatment of chronic thromboembolic pulmonary hypertension. Eur Respir J 2013; 41: pp. 735-742.
20. Cerqueira M.D., Weissmann N.J., Dilsizian V., et. al.: Standardized myocardial segmentation and nomenclature for tomographic imaging of the heart. A statement for healthcare professionals from the Cardiac Imaging Committee of the Council on Clinical Cardiology of the American Heart Association. Int J Cardiovasc Imaging 2002; 18: pp. 539-542.
21. Mauritz G.J., Vonk-Noordegraaf A., Kind T., et. al.: Pulmonary endarterectomy normalizes interventricular dyssynchrony and right ventricular systolic wall stress. J Cardiovasc Magn Reson 2012; 14: pp. 5.
22. Marston N., Brown J.P., Olson N., et. al.: Right ventricular strain before and after pulmonary thromboendarterectomy in patients with chronic thromboembolic pulmonary hypertension. Echocardiography 2015; 32: pp. 1115-1121.
23. Giusca S., Dambrauskaite V., Scheurwegs C., et. al.: Deformation imaging describes right ventricular function better than longitudinal displacement of the tricuspid ring. Heart 2010; 96: pp. 281-288.
24. Cihák R., Kolár F., Pelouch V., et. al.: Functional changes in the right and left ventricle during development of cardiac hypertrophy and after its regression. Cardiovasc Res 1992; 26: pp. 845-850.
25. D’Armini A.M., Zanotti G., Ghio S., et. al.: Reverse right ventricular remodeling after pulmonary endarterectomy. J Thorac Cardiovasc Surg 2007; 133: pp. 162-168.
26. Reesink H.J., Marcus J.T., Jamieson S., et. al.: Reverse right ventricular remodeling after pulmonary endarterectomy in patients with chronic thromboembolic pulmonary hypertension: utility of magnetic resonance imaging to demonstrate restoration of the right ventricle. J Thorac Cardiovasc Surg 2007; 133: pp. 58-64.
27. Ho S.Y., Nihoyannopoulos P.: Anatomy, echocardiography, and normal right ventricular dimensions. Heart 2006; 92: pp. i2-i13.
28. Sengupta P.P., Narula J.: Reclassifying heart failure: predominantly subendocardial, subepicardial and transmural. Heart Fail Clin 2008; 4: pp. 379-382.
29. Schwartzkopff B., Motz W., Frenzel H., et. al.: Structural and functional alterations of the antramyocardial coronary arterioles in patients with arterial hypertension. Circulation 1993; 88: pp. 993-1003.
30. Vogel-Claussen J., Skrok J., Shehata M.L., et. al.: Right and left ventricular myocardial perfusion reserves correlate with right ventricular function and pulmonary hemodynamics in patients with pulmonary arterial hypertension. Radiology 2011; 258: pp. 119-127.
31. Hill M.R., Simon M.A., Valdez-Jasso D., et. al.: Structural and mechanical adaptations of right ventricle free wall myocardium to pressure overload. Ann Biomed Eng 2014; 42: pp. 2451-2465.
32. Shehata M.L., Lossnitzer D., Skrok J., et. al.: Myocardial delayed enhancement in pulmonary hypertension: pulmonary hemodynamics, right ventricular function, and remodeling. AJR Am J Roentgenol 2011; 196: pp. 87-94.
33. Vogel-Claussen J., Shehata M.L., Lossnitzer D., et. al.: Increased right ventricular septomarginal trabeculation mass is a novel marker for pulmonary hypertension: comparison with ventricular mass index and right ventricular mass. Invest Radiol 2011; 46: pp. 567-575.
34. Louie E.K., Rich S., Brundage B.H.: Doppler echocardiographic assessment of impaired left ventricular filling in patients with right ventricular pressure overload due to primary pulmonary hypertension. J Am Coll Cardiol 1986; 8: pp. 1298-1306.
35. Roeleveld R.J., Marcus J.T., Faes T.J., et. al.: Interventricular septal configuration at MR imaging and pulmonary arterial pressure in pulmonary hypertension. Radiology 2005; 234: pp. 710-717.
36. Dittrich H.C., Nicod P., Chow L.C., et. al.: Early changes of right heart geometry after pulmonary thromboendarterectomy. J Am Coll Cardiol 1988; 1: pp. 937-943.
37. Menzel T., Kramm T., Bruckner A., et. al.: Quantitative assessment of right ventricular volumes in severe chronic thromboembolic pulmonary hypertension using transthoracic three-dimensional echocardiography: changes due to pulmonary thromboendarterectomy. Eur J Echocardiogr 2002; 3: pp. 67-72.