
Rationale and Objectives
To evaluate the presence of nonalcoholic fatty liver disease (NAFLD) in eutrophic and obese adolescents with magnetic resonance imaging (MRI) and its relationship to insulin resistance and other potential biomarkers.
Materials and Methods
A total of 50 adolescents (aged 11–17 years), including 24 obese and 26 eutrophic adolescents, were evaluated using MRI exams for NAFLD diagnosis. Blood analysis was performed to measure glucose, insulin, total cholesterol, high-density lipoprotein cholesterol, triglycerides, fibrinogen, aminotransferases, alkaline phosphatase, gamma-gt, and C-reactive protein. The Homeostatic Model Assessment of Insulin Resistance (HOMA-IR) index was also calculated. Laboratory test results and anthropometric assessment were statistically analyzed to determine potential correlation with NAFLD prevalence.
Results
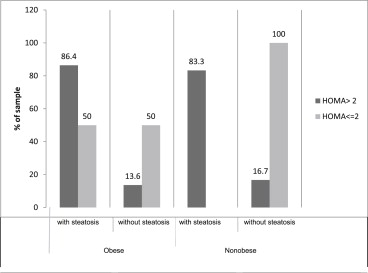
The prevalence of NAFLD among the obese was significantly higher (83.3%; CI 95: 64.5–94.5%) than that of the eutrophic group (19.2%; CI 95: 7.4–37.6%). In multivariate analysis, only HOMA-IR was an independent risk factor for diagnosis NAFLD using MRI. Compared to eutrophic adolescents, the obese adolescents had significantly higher levels for all parameters measured except for total and high-density lipoprotein cholesterol, which were significantly lower.
Conclusion
The prevalence of NAFLD was 19.2% among eutrophic patients and 83.3% among obese patients. Only HOMA-IR was determined to be an independent risk factor for NAFLD.
Nonalcoholic fatty liver disease (NAFLD), a subset of hepatic steatosis, was first described in adult patients in 1980 by Ludwig et al. as a clinicopathologic condition that presents histology findings that correspond with alcoholic hepatitis, but in people who do not drink . Cases of NAFLD that can progress to its most severe nonalcoholic steatohepatitis, cirrhosis, and hepatocellular carcinoma, have risen drastically in the United States, with estimates of 80–100 million Americans currently being affected . In Europe, growth in the percentage of the population afflicted with NAFLD has grown by 10–40% in the past 10 years .Geographically, NAFLD prevalence is particularly high in the United States .
Recent studies have shown an association between NAFLD and childhood obesity , with estimated prevalence rates being lower than 10% for the general population, but 70–75% for the obese juvenile population .
Get Radiology Tree app to read full this article<
Get Radiology Tree app to read full this article<
Get Radiology Tree app to read full this article<
Get Radiology Tree app to read full this article<
Get Radiology Tree app to read full this article<
Materials and methods
Study Population
Get Radiology Tree app to read full this article<
Get Radiology Tree app to read full this article<
Get Radiology Tree app to read full this article<
Get Radiology Tree app to read full this article<
Anthropometric Measurements
Get Radiology Tree app to read full this article<
Get Radiology Tree app to read full this article<
Laboratory Tests
Get Radiology Tree app to read full this article<
Get Radiology Tree app to read full this article<
Get Radiology Tree app to read full this article<
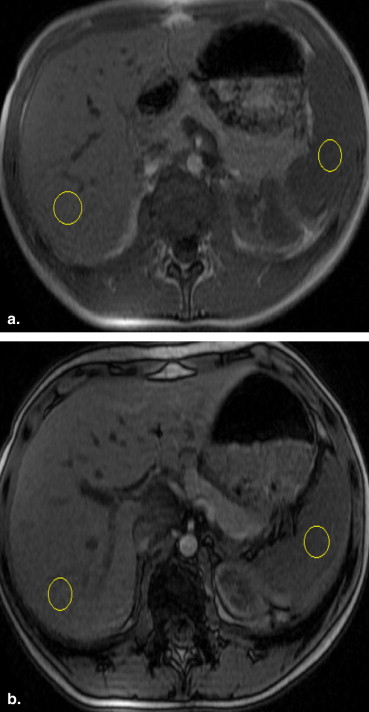
MRI of the Liver
Get Radiology Tree app to read full this article<
Get Radiology Tree app to read full this article<
Get Radiology Tree app to read full this article<

Get Radiology Tree app to read full this article<
Statistical Analysis
Get Radiology Tree app to read full this article<
Get Radiology Tree app to read full this article<
Get Radiology Tree app to read full this article<
Results
Get Radiology Tree app to read full this article<
Table 1
Clinical and Laboratory Characteristics of Obese and Eutrophic Study Groups
Variables ∗ Eutrophic ( n = 26) Obese ( n = 24)P Age (y) 14.7 ± 2.0 14.2 ± 1.9 .379 Male 8 (30.8) 17 (70.8) .011 BMI (kg/m²) 21.1 ± 2.6 32.6 ± 3.8 <.001 AC (cm) 65.8 (15.4) 111.5 (15.8) <.001 Glucose (mg/dL) 86.9 ± 8.4 94.3 ± 7.0 .001 Insulin (μUI/mL) 6.0 (5.3–8.4) 14.9 (11.9–18.5) <.001 Total C (mg/dL) 165.7 ± 28.3 159.7 ± 25.0 .435 HDL C (mg/dL) 49.5 ± 9.7 39.7 ± 8.0 <.001 Fibrinogen (g/L) 2.01 (1.78–2.37) 2.53 (1.93–3.00) .002 Alkaline protein (U/L) 123.5 (96.3–107.3) 215.5 (111.5–295) .020 Gamma GT (U/L) 18 (17–22) 27.5 (20–29) .011 C-reactive protein (mg/L) 0.55 (0.2–1.6) 3.4 (1.08–5.45) .003 Oxaloacetic 16.5 (14–19.8) 20 (16.3–25.5) .011 Triglycerides (mg/dL) 60.5 (47–95) 89 (57.5–129.3) .103 Hepatic FF NMRI 2.95 (1.38–4.35) 7.10 (5.05–12.9) <.001 NAFLD 5 (19.2) 20 (83.3) <.001 HOMA IR 1.21 (1.10–1.89) 3.47 (2.83–4.37) <.001
AC, abdominal circumference; AP, alkaline phosphatase; BMI, body mass index; FF, fat fraction; gamma GT, γ-glutamyl transpeptidase; GOT, glutamic oxaloacetic transaminase; HDL C, high-density lipoprotein cholesterol; HOMA IR, Homeostatic Model Assessment of Insulin Resistance; total C, total cholesterol; NAFLD, nonalcoholic fatty liver disease.
Get Radiology Tree app to read full this article<
Table 2
The Clinical and Laboratory Characteristics of Adolescents with and without NAFLD
Variables ∗ with NAFLD ( n = 25) without NAFLD ( n = 25)P Age (y) 14.2 ± 2.0 14.8 ± 1.9 .275 Male 14 (56.0) 11 (44.0) .572 BMI (kg/m²) 31.1 ± 5.1 22.1 ± 4.6 <.001 AC (cm) 101 (14.0) 71 (12.0) <.001 Glucose (mg/dL) 94.2 ± 6.2 86.6 ± 9.0 .001 Insulin (μUI/mL) 15.2 (12.6–18.3) 5.9 (5.2–7.2) <.001 Total C (mg/dL) 165.1 ± 23.2 160.7 ± 30.0 .564 HDL C (mg/dL) 41.3 ± 9.4 48.3 ± 9.8 .014 Fibrinogen (g/L) 2.5 (2.0–2.95) 1.9 (1.75–2.33) .001 Alkaline P (U/L) 195 (112.5–295) 113 (93.5–227.5) .014 Gamma GT (U/L) 26 (18–29) 20 (17.5–26) .139 C-reactive protein (mg/L) 2.2 (0.45–5.0) 0.7 (0.2–3.4) .113 Oxaloacetic 19 (15.5–23) 17 (14–22) .083 Triglycerides (mg/dL) 88 (58 – 134.5) 60 (46–97) .042 HOMA IR 3.48 (2.87 – 4.34) 1.20 (1.09–1.48) <.001
AC, abdominal circumference; AP, alkaline phosphatase; BMI, body mass index; FF, fat fraction; gamma GT, γ-glutamyl transpeptidase; GOT, glutamic oxaloacetic transaminase; HDL C, high-density lipoprotein cholesterol; HOMA IR, Homeostatic Model Assessment of Insulin Resistance; total C, total cholesterol; NAFLD, nonalcoholic fatty liver disease.
Get Radiology Tree app to read full this article<
Get Radiology Tree app to read full this article<
Get Radiology Tree app to read full this article<
Get Radiology Tree app to read full this article<
Table 3
Multivariate Poisson Regression to Evaluate Predictors Independently Associated with NAFLD
Variables Model 1 Model 2 PR (CI 95%)P PR (CI 95%)P Obese 1.47 (0.73–2.99) .283 NE NE High AC NE NE 1.91 (0.94–3.89) .074 Triglycerides 1.002 (1.000–1.004) .071 1.002 (1.000–1.005) .063 HOMA >2 13.7 (1.40–142.9) .024 13.0 (1.52–111) .019 HDL 1.01 (0.99–1.03) .157 1.01 (0.99–1.04) .214 Fibrinogen 1.12 (0.90–1.41) .316 1.08 (0.89–1.33) .436 AP 1.00 (0.99–1.00) .364 1.001 (0.99–1.003) .214 Aminotransferase 0.99 (0.98–1.01) .306 0.99 (0.97–1.00) .109
AP, alkaline phosphatase; AT, aminotransferase; HDL, high-density lipoprotein; NE, not evaluated, PR, prevalence ratios.
Get Radiology Tree app to read full this article<
Get Radiology Tree app to read full this article<
Get Radiology Tree app to read full this article<
Discussion
Get Radiology Tree app to read full this article<
Get Radiology Tree app to read full this article<
Dual-Echo, Chemical Shift Gradient-Echo MRI to Quantify Hepatic Steatosis: Implications for Living Liver Donation
Get Radiology Tree app to read full this article<
Get Radiology Tree app to read full this article<
Get Radiology Tree app to read full this article<
Get Radiology Tree app to read full this article<
Get Radiology Tree app to read full this article<
Get Radiology Tree app to read full this article<
Get Radiology Tree app to read full this article<
Get Radiology Tree app to read full this article<
Limitations
Get Radiology Tree app to read full this article<
Get Radiology Tree app to read full this article<
Get Radiology Tree app to read full this article<
Get Radiology Tree app to read full this article<
Get Radiology Tree app to read full this article<
Get Radiology Tree app to read full this article<
Acknowledgments
Get Radiology Tree app to read full this article<
References
1. Ludwig J., Viggiano T.R., McGill D.B., et. al.: Nonalcoholic steatohepatitis: Mayo Clinic experiences with a hitherto unnamed disease. Mayo Clin Proc 1980; 55: pp. 434-438.
2. Schwimmer J.B., Deutsch R., Kahen T., et. al.: Prevalence of fatty liver in children and adolescents. Pediatrics 2006; 118: pp. 1388-1393.
3. Lazo M., Clark J.M.: The epidemiology of nonalcoholic fatty liver disease: a global perspective. Semin Liver Dis 2008; 28: pp. 339-350.
4. Torres D.M., Harrison S.A.: Nonalcoholic steatohepatitis and noncirrhotic hepatocellular carcinoma: fertile soil. Semin Liver Dis 2012; 32: pp. 30-38.
5. Lobstein T., Baur L., Uauy R., et. al.: Obesity in children and young people: a crisis in public health. Obes Rev 2004; 5: pp. 4-104.
6. Quirós-Tejeira R.E., Rivera C.A., Ziba T.T., et. al.: Risk for nonalcoholic fatty liver disease in Hispanic youth with BMI > or =95th percentile. J Pediatr Gastroenterol Nutr 2007; 44: pp. 228-236.
7. McGlynn K.A., London W.T.: The global epidemiology of hepatocellular carcinoma: present and future. Clin Liver Dis 2011; 15: pp. 223-243. vii-x
8. Wieckowska A., McCullough A.J., Feldstein A.E.: Noninvasive diagnosis and monitoring of nonalcoholic steatohepatitis: present and future. Hepatology 2007; 46: pp. 582-589.
9. Wieckowska A., Feldstein A.E.: Nonalcoholic fatty liver disease in the pediatric population: a review. Curr Opin Pediatr 2005; 17: pp. 636-641.
10. Franzese A., Vajro P., Argenziano A., et. al.: Liver involvement in obese children. Ultrasonography and liver enzyme levels at diagnosis and during follow-up in an Italian population. Dig Dis Sci 1997; 42: pp. 1428-1432.
11. Chan D.F., Li A.M., Chu W.C., et. al.: Hepatic steatosis in obese Chinese children. Int J Obes Relat Metab Disord 2004; 28: pp. 1257-1263.
12. Brunt E.M.: Pathology of nonalcoholic steatohepatitis. Hepatol Res 2005; 33: pp. 68-71.
13. Brunt E.M., Tiniakos D.G.: Pathology of steatohepatitis. Best Pract Res Clin Gastroenterol 2002; 16: pp. 691-707.
14. Serra J., Castell C., Serra L., et. al.: [Overweight and obesity. Evaluation of the objectives of the Health Plan for Catalonia for the year 2000]. Med Clin (Barc) 2003; 121: pp. 47-50.
15. Pacifico L., Nobili V., Anania C., et. al.: Pediatric nonalcoholic fatty liver disease, metabolic syndrome and cardiovascular risk. World J Gastroenterol 2011; 17: pp. 3082-3091.
16. Strauss S., Gavish E., Gottlieb P., et. al.: Interobserver and intraobserver variability in the sonographic assessment of fatty liver. AJR Am J Roentgenol 2007; 189: pp. W320-W323.
17. Saadeh S., Younossi Z.M., Remer E.M., et. al.: The utility of radiological imaging in nonalcoholic fatty liver disease. Gastroenterology 2002; 123: pp. 745-750.
18. Mancini M., Prinster A., Annuzzi G., et. al.: Sonographic hepatic-renal ratio as indicator of hepatic steatosis: comparison with (1)H magnetic resonance spectroscopy. Metabolism 2009; 58: pp. 1724-1730.
19. Yeckel C.W., Weiss R., Dziura J., et. al.: Validation of insulin sensitivity indices from oral glucose tolerance test parameters in obese children and adolescents. J Clin Endocrinol Metab 2004; 89: pp. 1096-1101.
20. Weiss R., Dziura J., Burgert T.S., et. al.: Obesity and the metabolic syndrome in children and adolescents. N Engl J Med 2004; 350: pp. 2362-2374.
21. Matthews D.R., Hosker J.P., Rudenski A.S., et. al.: Homeostasis model assessment: insulin resistance and beta-cell function from fasting plasma glucose and insulin concentrations in man. Diabetologia 1985; 28: pp. 412-419.
22. Schwartz B., Jacobs D.R., Moran A., et. al.: Measurement of insulin sensitivity in children: comparison between the euglycemic-hyperinsulinemic clamp and surrogate measures. Diabetes Care 2008; 31: pp. 783-788.
23. Pacifico L., Martino M.D., Catalano C., et. al.: T1-weighted dual-echo MRI for fat quantification in pediatric nonalcoholic fatty liver disease. World J Gastroenterol 2011; 17: pp. 3012-3019.
24. Westphalen A.C., Qayyum A., Yeh B.M., et. al.: Liver fat: effect of hepatic iron deposition on evaluation with opposed-phase MR imaging. Radiology 2007; 242: pp. 450-455.
25. Qayyum A., Goh J.S., Kakar S., et. al.: Accuracy of liver fat quantification at MR imaging: comparison of out-of-phase gradient-echo and fat-saturated fast spin-echo techniques–initial experience. Radiology 2005; 237: pp. 507-511.
26. Fishbein M.H., Gardner K.G., Potter C.J., et. al.: Introduction of fast MR imaging in the assessment of hepatic steatosis. Magn Reson Imaging 1997; 15: pp. 287-293.
27. Hamer O.W., Aguirre D.A., Casola G., et. al.: Fatty liver: imaging patterns and pitfalls. Radiographics 2006; 26: pp. 1637-1653.
28. Hussain H.K., Chenevert T.L., Londy F.J., et. al.: Hepatic fat fraction: MR imaging for quantitative measurement and display–early experience. Radiology 2005; 237: pp. 1048-1055.
29. Angulo P.: Nonalcoholic fatty liver disease. N Engl J Med 2002; 346: pp. 1221-1231.
30. Choji T.: [Evaluation of fatty liver changes and fatty degeneration in liver tumors by 1H-MRS]. Nihon Igaku Hoshasen Gakkai Zasshi 1993; 53: pp. 1408-1414.
31. Schwimmer J.B., McGreal N., Deutsch R., et. al.: Influence of gender, race, and ethnicity on suspected fatty liver in obese adolescents. Pediatrics 2005; 115: pp. e561-e565.
32. Marchesini G., Bugianesi E., Forlani G., et. al.: Nonalcoholic fatty liver, steatohepatitis, and the metabolic syndrome. Hepatology 2003; 37: pp. 917-923.
33. Neuschwander-Tetri B.A.: Nonalcoholic steatohepatitis and the metabolic syndrome. Am J Med Sci 2005; 330: pp. 326-335.
34. Schwimmer J.B., Pardee P.E., Lavine J.E., et. al.: Cardiovascular risk factors and the metabolic syndrome in pediatric nonalcoholic fatty liver disease. Circulation 2008; 118: pp. 277-283.
35. Patton H.M., Yates K., Unalp-Arida A., et. al.: Association between metabolic syndrome and liver histology among children with nonalcoholic fatty liver disease. Am J Gastroenterol 2010; 105: pp. 2093-2102.
36. Springer F., Machann J., Schwenzer N.F., et. al.: Quantitative assessment of intrahepatic lipids using fat-selective imaging with spectral-spatial excitation and in-/opposed-phase gradient echo imaging techniques within a study population of extremely obese patients: feasibility on a short, wide-bore MR scanner. Invest Radiol 2010; 45: pp. 484-490.
37. Fabbrini E., Magkos F., Mohammed B.S., et. al.: Intrahepatic fat, not visceral fat, is linked with metabolic complications of obesity. Proc Natl Acad Sci U S A 2009; 106: pp. 15430-15435.
38. Kumashiro N., Erion D.M., Zhang D., et. al.: Cellular mechanism of insulin resistance in nonalcoholic fatty liver disease. Proc Natl Acad Sci U S A 2011; 108: pp. 16381-16385.
39. Kelley D.E., McKolanis T.M., Hegazi R.A., et. al.: Fatty liver in type 2 diabetes mellitus: relation to regional adiposity, fatty acids, and insulin resistance. Am J Physiol Endocrinol Metab 2003; 285: pp. E906-E916.
40. Schwimmer J.B., Deutsch R., Rauch J.B., et. al.: Obesity, insulin resistance, and other clinicopathological correlates of pediatric nonalcoholic fatty liver disease. J Pediatr 2003; 143: pp. 500-505.
41. Mandato C., Lucariello S., Licenziati M.R., et. al.: Metabolic, hormonal, oxidative, and inflammatory factors in pediatric obesity-related liver disease. J Pediatr 2005; 147: pp. 62-66.
42. Guzzaloni G., Grugni G., Minocci A., et. al.: Liver steatosis in juvenile obesity: correlations with lipid profile, hepatic biochemical parameters and glycemic and insulinemic responses to an oral glucose tolerance test. Int J Obes Relat Metab Disord 2000; 24: pp. 772-776.
43. Browning J.D., Szczepaniak L.S., Dobbins R., et. al.: Prevalence of hepatic steatosis in an urban population in the United States: impact of ethnicity. Hepatology 2004; 40: pp. 1387-1395.
44. Pacifico L., Celestre M., Anania C., et. al.: MRI and ultrasound for hepatic fat quantification: relationships to clinical and metabolic characteristics of pediatric nonalcoholic fatty liver disease. Acta Paediatr 2007; 96: pp. 542-547.
45. Deivanayagam S., Mohammed B.S., Vitola B.E., et. al.: Nonalcoholic fatty liver disease is associated with hepatic and skeletal muscle insulin resistance in overweight adolescents. Am J Clin Nutr 2008; 88: pp. 257-262.