
Rationale and Objectives
The objective of this study was to determine how metabolite values (total N-acetyl aspartate [tNAA], glutamate plus glutamine [Glx], total choline [tCho], myoinositol [mI], and total creatine [tCr]) vary across brain regions in healthy subjects. This study was implemented to create an internal reference database for patients with psychiatric disorders and epilepsy.
Materials and Methods
Using the multivoxel technique with a voxelwise phantom calibration on a 3-T magnetic resonance imaging scanner, metabolite levels of 29 healthy controls (13 men, 16 women; average age, 29 years) were obtained from the hippocampi, basal ganglia, insula cortex, cingulum, and precuneus. Additionally, gray and white matter metabolite values were obtained from the frontal and parietal lobes.
Results
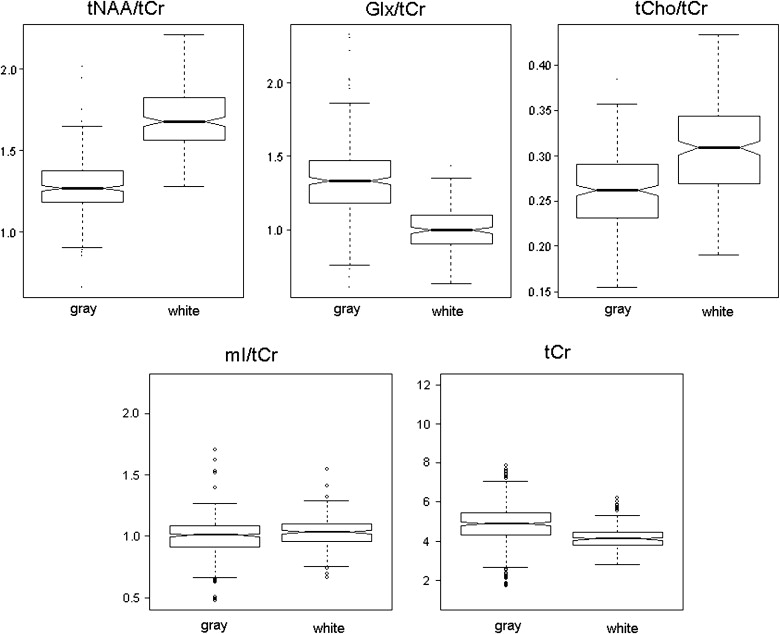
No significant effect of gender was noticed. The total magnitude of variation was greatest for Glx, followed by tNAA, mI, tCho, and tCr. Glx/tCr, Glx, and tCr were increased in gray matter, while tNAA/tCr, tCho/tCr, respectively tNAA and tCho, were elevated in white matter. These findings indicate (1) anterior-to-posterior increases of tNAA/tCr and Glx/tCr, respectively tNAA and Glx, along the midline in gray matter (cingulum); (2) increased tNAA/tCr, respectively tNAA, in white matter in the fiber tracts of the precentral region; (3) an accentuated anterior-to-posterior increase of tCr in the insula cortex; and (4) an anterior-to-posterior decrease of tCho/tCr and tCho in white matter.
Conclusions
There are significant metabolic differences within tissue types and within tissue types at different locations; therefore, the spectra and metabolite values presented should provide a useful internal reference for both clinical and research studies.
Detailed knowledge about regional variation in brain metabolites is essential for an accurate interpretation of the results of proton magnetic resonance spectroscopy ( 1 H-MRS) in various brain diseases, such as epilepsy and psychiatric disorders . As for most laboratory tests, it is a prerequisite for an assessment of true metabolic disturbances and may contribute to a better functional understanding of certain diseases.
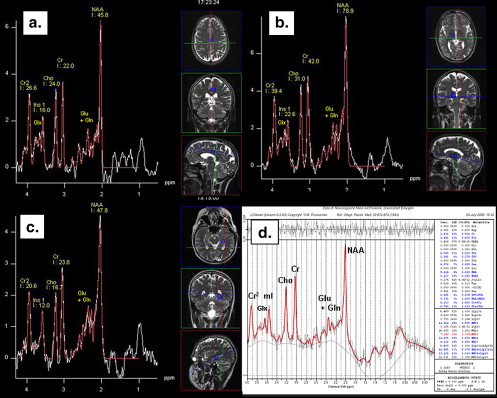
Commonly distinguishable metabolites include total N-acetyl aspartate (tNAA), total choline (tCho), myoinositol (mI), glutamate (Glu) plus glutamine (Gln) (Glu + Gln = Glx), and total creatine (tCr). In clinical settings, metabolite ratios are often used rather than absolute metabolite values because of variations in susceptibility, coil loading, tissue composition, and changes in receiver gain . Earlier proton magnetic resonance spectroscopic studies of the human brain have implemented the single-voxel technique, acquiring a single spectrum from a definite volume of tissue as an integral . This acquisition is fairly fast (3 minutes), and a spectrum is easily obtained, but it provides limited information about the regional distribution of brain metabolites. Multivoxel techniques acquire spectra simultaneously over a wide brain region, thus enabling the analysis of metabolite distribution and eventually covering the whole brain . The multivoxel technique refers to chemical shift imaging, which combines features of magnetic resonance imaging and MRS, yielding data from multiple adjacent voxels covering a large volume of interest in a single measurement.
Get Radiology Tree app to read full this article<
Get Radiology Tree app to read full this article<
Materials and methods
Subjects
Get Radiology Tree app to read full this article<
Multivoxel MRS
Get Radiology Tree app to read full this article<
![Figure 1, Arrangement of three multivoxel spectra (a–f) into symmetric pairs on each side of the midline including the centrum semiovale (white matter), the cingulum (Ci), the precuneus (PC), the insula cortex (I), the basal ganglia (thalamus [T] and putamen [P]), and the hippocampus (H). (b,d,f) Reference lines and correct positioning. Pre, precentral gyrus.](https://storage.googleapis.com/dl.dentistrykey.com/clinical/MultivoxelMagneticResonanceSpectroscopyofCerebralMetabolitesinHealthyAdultsat3Tesla/0_1s20S1076633209004292.jpg)
Get Radiology Tree app to read full this article<
Get Radiology Tree app to read full this article<
Postprocessing
Get Radiology Tree app to read full this article<
Statistical Analysis
Get Radiology Tree app to read full this article<
Results
Influence of Sex on Brain Metabolites in Different Brain Regions
Get Radiology Tree app to read full this article<
Right and Left Hemispheric Metabolite Differences
Get Radiology Tree app to read full this article<
Metabolite Differences Between Gray and White Matter
Get Radiology Tree app to read full this article<
Get Radiology Tree app to read full this article<
Total and Regional Metabolite Magnitudes of Variation
Get Radiology Tree app to read full this article<
Get Radiology Tree app to read full this article<
Intraregional Metabolite Variation in Gray and White Matter and Hippocampus
Get Radiology Tree app to read full this article<
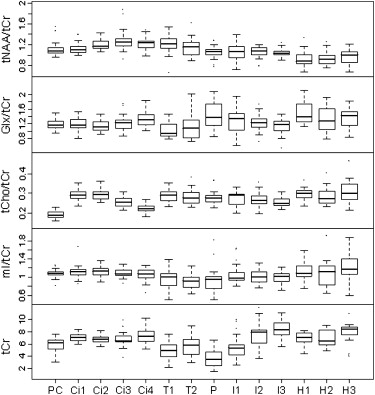
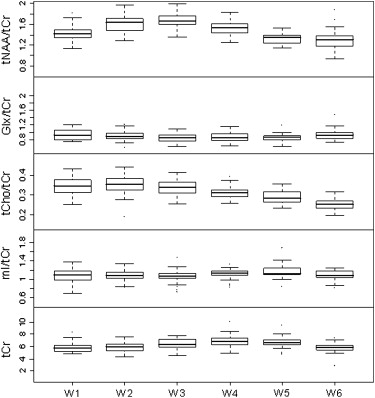
Table 1
Summary of Significant Intraregional Variations in Gray and White Matter and the Hippocampus
Metabolite Ratios to Cr Individual Metabolite Values Voxel tNAA/tCr Glx/tCr tCho/tCr mI/tCr tNAA Glx tCho mI tCr Cingulum ( k = 6) ↑ 81% ↑ 77% ↓ 96% ↑ 92% ↑ 71% ↓ 96% Thalamus ( k = 1) Insula cortex ( k = 3) ↑ 95% ↑ 85% ↑ 90% ↑ 85% Hippocampus ( k = 3) ↑ 94% White matter (centrum semiovale) ( k = 15) CR ↑ 88% ↓ 85% CR ↑ 83% ↓ 62% CR ↑ 88% CR ↑ 88%
CR ↑, significant increase in the fiber tracts of the precentral region; Glx, glutamate plus glutamine; mI, myoinositol; tCho, total choline; tCr, total creatine; tNAA, total N-acetyl aspartate; ↑, significant increase from anterior to posterior; ↓, significant decrease from anterior to posterior.
Analysis of variance with Bonferroni’s correction with P i < P / k ( P = .05); k is the number of comparisons. The percentages of subjects showing the trend in the individual values are shown.
Get Radiology Tree app to read full this article<
Get Radiology Tree app to read full this article<
Get Radiology Tree app to read full this article<
Interregional Metabolite Variation
Get Radiology Tree app to read full this article<
Discussion
Get Radiology Tree app to read full this article<
Get Radiology Tree app to read full this article<
Get Radiology Tree app to read full this article<
Get Radiology Tree app to read full this article<
Get Radiology Tree app to read full this article<
Get Radiology Tree app to read full this article<
Get Radiology Tree app to read full this article<
Get Radiology Tree app to read full this article<
Get Radiology Tree app to read full this article<
Get Radiology Tree app to read full this article<
Get Radiology Tree app to read full this article<
Conclusion
Get Radiology Tree app to read full this article<
Get Radiology Tree app to read full this article<
References
1. Castillo M., Kwock L., Mukherji S.K.: Clinical applications of proton MR spectroscopy. AJNR Am J Neuroradiol 1996; 17: pp. 1-15.
2. Desseilles M., Ng-Vu T., Schabus M., et. al.: Neuroimaging insights into the pathophysiology of sleep disorders. Sleep 2008; 31: pp. 777-794.
3. Fayed N., Davila J., Oliveros A., et. al.: Utility of different MR modalities in mild cognitive impairment and its use as a predictor of conversion to probable dementia. Acad Radiol 2008; 15: pp. 1089-1098.
4. Fojtikova D., Brazdil M., Horky J., et. al.: Magnetic resonance spectroscopy of the thalamus in patients with typical absence epilepsy. Seizure 2006; 15: pp. 533-540.
5. Helms G., Ciumas C., Kyaga S., et. al.: Increased thalamus levels of glutamate and glutamine (Glx) in patients with idiopathic generalised epilepsy. J Neurol Neurosurg Psychiatry 2006; 77: pp. 489-494.
6. Lenkinski R.E.: Dementias and neuroimaging. Acad Radiol 2008; 15: pp. 1087-1088.
7. Lin K, Carrete JH, Lin J, et al. Magnetic resonance spectroscopy reveals an epileptic network in juvenile myoclonic epilepsy. Epilepsia. In press.
8. Savic I., Osterman Y., Helms G.: MRS shows syndrome differentiated metabolite changes in human-generalized epilepsies. Neuroimage 2004; 21: pp. 163-172.
9. Safriel Y., Pol-Rodriguez M., Novotny E.J., et. al.: Reference values for long echo time MR spectroscopy in healthy adults. AJNR Am J Neuroradiol 2005; 26: pp. 1439-1445.
10. Bonavita S., Di S.F., Tedeschi G.: Proton MRS in neurological disorders. Eur J Radiol 1999; 30: pp. 125-131.
11. Gussew A., Rzanny R., Scholle H.C., et. al.: Quantitation of glutamate in the brain by using MR proton spectroscopy at 1.5 T and 3 T [article in German]. Rofo 2008; 180: pp. 722-732.
12. Hammen T., Stefan H., Eberhardt K.E., et. al.: Clinical applications of 1H-MR spectroscopy in the evaluation of epilepsies—what do pathological spectra stand for with regard to current results and what answers do they give to common clinical questions concerning the treatment of epilepsies?. Acta Neurol Scand 2003; 108: pp. 223-238.
13. Hammen T., Kerling F., Schwarz M., et. al.: Identifying the affected hemisphere by (1)H-MR spectroscopy in patients with temporal lobe epilepsy and no pathological findings in high resolution MRI. Eur J Neurol 2006; 13: pp. 482-490.
14. Natt O., Bezkorovaynyy V., Michaelis T., et. al.: Use of phased array coils for a determination of absolute metabolite concentrations. Magn Reson Med 2005; 53: pp. 3-8.
15. Brown M.A.: Time-domain combination of MR spectroscopy data acquired using phased-array coils. Magn Reson Med 2004; 52: pp. 1207-1213.
16. Baker E.H., Basso G., Barker P.B., et. al.: Regional apparent metabolite concentrations in young adult brain measured by (1)H MR spectroscopy at 3 Tesla. J Magn Reson Imaging 2008; 27: pp. 489-499.
17. Pouwels P.J., Frahm J.: Regional metabolite concentrations in human brain as determined by quantitative localized proton MRS. Magn Reson Med 1998; 39: pp. 53-60.
18. Schuff N., Ezekiel F., Gamst A.C., et. al.: Region and tissue differences of metabolites in normally aged brain using multislice 1H magnetic resonance spectroscopic imaging. Magn Reson Med 2001; 45: pp. 899-907.
19. Ebel A., Maudsley A.A.: Detection and correction of frequency instabilities for volumetric 1H echo-planar spectroscopic imaging. Magn Reson Med 2005; 53: pp. 465-469.
20. Doyle T.J., Bedell B.J., Narayana P.A.: Relative concentrations of proton MR visible neurochemicals in gray and white matter in human brain. Magn Reson Med 1995; 33: pp. 755-759.
21. Lim K.O., Spielman D.M.: Estimating NAA in cortical gray matter with applications for measuring changes due to aging. Magn Reson Med 1997; 37: pp. 372-377.
22. Pfefferbaum A., Adalsteinsson E., Spielman D., et. al.: In vivo spectroscopic quantification of the N-acetyl moiety, creatine, and choline from large volumes of brain gray and white matter: effects of normal aging. Magn Reson Med 1999; 41: pp. 276-284.
23. Hetherington H.P., Pan J.W., Mason G.F., et. al.: Quantitative 1H spectroscopic imaging of human brain at 4.1 T using image segmentation. Magn Reson Med 1996; 36: pp. 21-29.
24. Lundbom N., Barnett A., Bonavita S., et. al.: MR image segmentation and tissue metabolite contrast in 1H spectroscopic imaging of normal and aging brain. Magn Reson Med 1999; 41: pp. 841-845.
25. Noworolski S.M., Nelson S.J., Henry R.G., et. al.: High spatial resolution 1H-MRSI and segmented MRI of cortical gray matter and subcortical white matter in three regions of the human brain. Magn Reson Med 1999; 41: pp. 21-29.
26. Sailasuta N., Ernst T., Chang L.: Regional variations and the effects of age and gender on glutamate concentrations in the human brain. Magn Reson Imaging 2008; 26: pp. 667-675.
27. Chang L., Jiang C.S., Ernst T.: Effects of age and sex on brain glutamate and other metabolites. Magn Reson Imaging 2009; 27: pp. 142-145.
28. Pouwels P.J., Brockmann K., Kruse B., et. al.: Regional age dependence of human brain metabolites from infancy to adulthood as detected by quantitative localized proton MRS. Pediatr Res 1999; 46: pp. 474-485.
29. Kreis R., Ernst T., Ross B.D.: Development of the human brain: in vivo quantification of metabolite and water content with proton magnetic resonance spectroscopy. Magn Reson Med 1993; 30: pp. 424-437.
30. Horska A., Kaufmann W.E., Brant L.J., et. al.: In vivo quantitative proton MRSI study of brain development from childhood to adolescence. J Magn Reson Imaging 2002; 15: pp. 137-143.
31. Provencher S.W.: Automatic quantitation of localized in vivo 1H spectra with LCModel. NMR Biomed 2001; 14: pp. 260-264.
32. Zaaraoui W., Fleysher L., Fleysher R., et. al.: Human brain-structure resolved T(2) relaxation times of proton metabolites at 3 Tesla. Magn Reson Med 2007; 57: pp. 983-989.
33. Hammen T., Stadlbauer A., Tomandl B., et. al.: Short TE single-voxel 1H-MR spectroscopy of hippocampal structures in healthy adults at 1.5 Tesla—how reproducible are the results?. NMR Biomed 2005; 18: pp. 195-201.
34. Provencher S.W.: Estimation of metabolite concentrations from localized in vivo proton NMR spectra. Magn Reson Med 1993; 30: pp. 672-679.
35. Helms G.: A precise and user-independent quantification technique for regional comparison of single volume proton MR spectroscopy of the human brain. NMR Biomed 2000; 13: pp. 398-406.
36. Nagae-Poetscher L.M., Bonekamp D., Barker P.B., et. al.: Asymmetry and gender effect in functionally lateralized cortical regions: a proton MRS imaging study. J Magn Reson Imaging 2004; 19: pp. 27-33.
37. Komoroski R.A., Heimberg C., Cardwell D., et. al.: Effects of gender and region on proton MRS of normal human brain. Magn Reson Imaging 1999; 17: pp. 427-433.
38. Degaonkar M.N., Pomper M.G., Barker P.B.: Quantitative proton magnetic resonance spectroscopic imaging: regional variations in the corpus callosum and cortical gray matter. J Magn Reson Imaging 2005; 22: pp. 175-179.
39. Pouwels P.J., Frahm J.: Differential distribution of NAA and NAAG in human brain as determined by quantitative localized proton MRS. NMR Biomed 1997; 10: pp. 73-78.
40. Blakely R.D., Coyle J.T.: The neurobiology of N-acetylaspartylglutamate. Int Rev Neurobiol 1988; 30: pp. 39-100.
41. Urenjak J., Williams S.R., Gadian D.G., et. al.: Proton nuclear magnetic resonance spectroscopy unambiguously identifies different neural cell types. J Neurosci 1993; 13: pp. 981-989.
42. Vermathen P., Laxer K.D., Matson G.B., et. al.: Hippocampal structures: anteroposterior N-acetylaspartate differences in patients with epilepsy and control subjects as shown with proton MR spectroscopic imaging. Radiology 2000; 214: pp. 403-410.
43. Mouritzen D.A.: The density of neurons in the human hippocampus. Neuropathol Appl Neurobiol 1979; 5: pp. 249-264.
44. Babb T.L., Brown W.J., Pretorius J., et. al.: Temporal lobe volumetric cell densities in temporal lobe epilepsy. Epilepsia 1984; 25: pp. 729-740.
45. Choi C.G., Frahm J.: Localized proton MRS of the human hippocampus: metabolite concentrations and relaxation times. Magn Reson Med 1999; 41: pp. 204-207.
46. Choi C.G., Ko T.S., Lee H.K., et. al.: Localized proton MR spectroscopy of the allocortex and isocortex in healthy children. AJNR Am J Neuroradiol 2000; 21: pp. 1354-1358.
47. Rockel A.J., Hiorns R.W., Powell T.P.: The basic uniformity in structure of the neocortex. Brain 1980; 103: pp. 221-244.
48. Arslanoglu A., Bonekamp D., Barker P.B., et. al.: Quantitative proton MR spectroscopic imaging of the mesial temporal lobe. J Magn Reson Imaging 2004; 20: pp. 772-778.
49. Barker P.B., Szopinski K., Horska A.: Metabolic heterogeneity at the level of the anterior and posterior commissures. Magn Reson Med 2000; 43: pp. 348-354.
50. Moffett J.R., Namboodiri M.A., Neale J.H.: Enhanced carbodiimide fixation for immunohistochemistry: application to the comparative distributions of N-acetylaspartylglutamate and N-acetylaspartate immunoreactivities in rat brain. J Histochem Cytochem 1993; 41: pp. 559-570.