
Rationale and Objectives
To investigate a multimodality computer-aided diagnosis (CAD) scheme that combines image information from full-field digital mammography (FFDM) and dynamic contrast-enhanced magnetic resonance imaging (DCE-MRI) for computerized breast cancer classification.
Materials and Methods
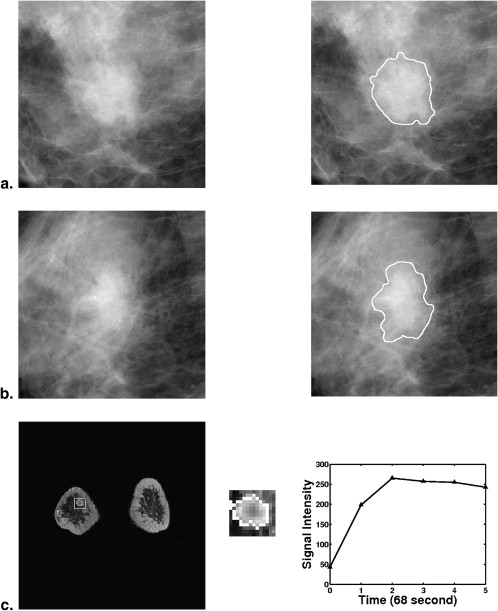
From a retrospective FFDM database with 432 lesions (255 malignant, 177 benign) and a retrospective DCE-MRI database including 476 lesions (347 malignant, 129 benign), we constructed a multimodality dataset of 213 lesions (168 malignant, 45 benign). Each lesion was present on both FFDM and DCE-MRI images and deemed to be a difficult case given the necessity of having both clinical imaging exams. Using a manually indicated lesion location (ie, a seed point on FFDM images or a region of interest on DCE-MRI images, the computer automatically segmented the mass lesions and extracted lesion features). A subset of features was selected using linear stepwise feature selection and merged by a Bayesian artificial neural network to yield an estimate of the probability of malignancy. Receiver operating characteristic (ROC) analysis was used to evaluate the performance of the selected features in distinguishing between malignant and benign lesions.
Results
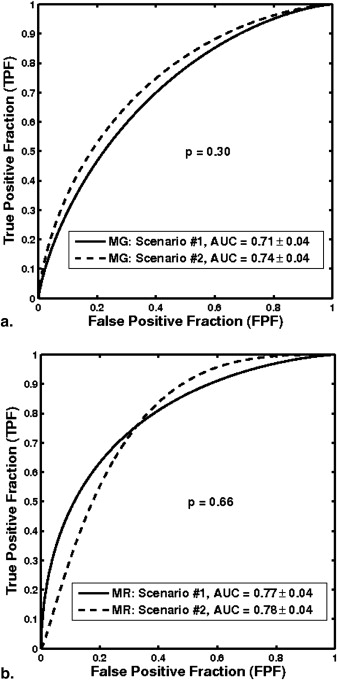
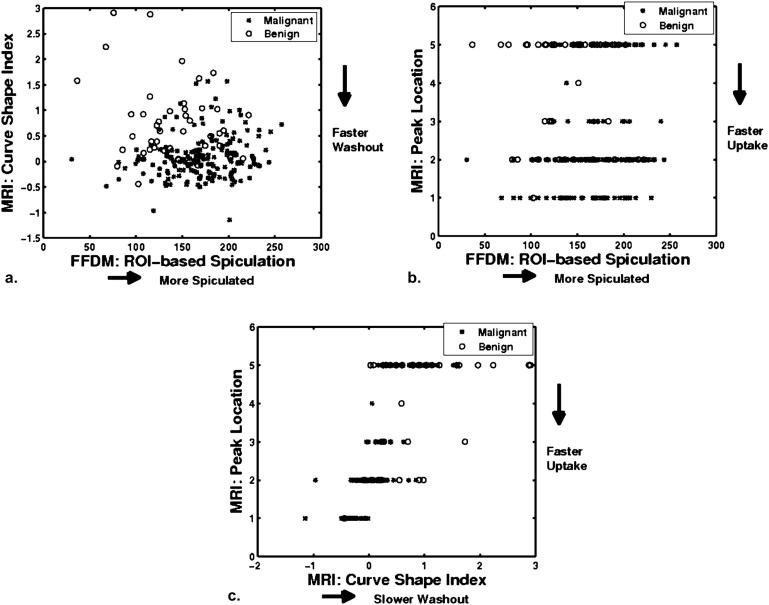
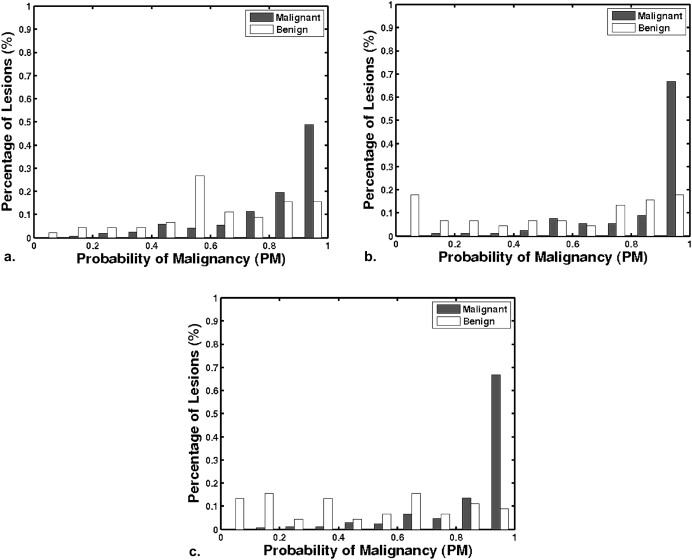
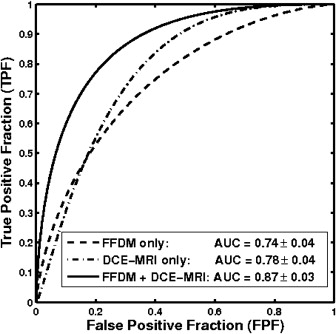
With leave-one-lesion-out cross-validation on the multimodality dataset, the mammography-only features yielded an area under the ROC curve (AUC) of 0.74 ± 0.04, and the DCE-MRI-only features yielded an AUC of 0.78 ± 0.04. The combination of these two modalities, which included a spiculation feature from mammography and two kinetic features from DCE-MRI, yielded an AUC of 0.87 ± 0.03. The improvement of combining multimodality information was statistically significant as compared to the use of single modality information alone.
Conclusions
A CAD scheme that combines features extracted from FFDM and DCE-MRI images may be advantageous to single-modality CAD in the task of differentiating between malignant and benign lesions.
Breast cancer is a leading cause of mortality in American women, with an estimated 192,370 new cancer cases and 40,170 deaths in the United States in 2009 . Although there are limited methods for curing breast cancer, recent statistics show that there has been a steady decrease in the annual death rate from breast cancer among women, from 32.69 in 1991 to 24.00 in 2005 (per 100,000 population). This decrease accounts for nearly 40% of decreases in cancer death rates for women and largely reflects improvements in early detection and treatment .
Medical imaging plays a crucial role in reducing breast cancer mortality, with contributions to early detection through screening, diagnosis, image-guided biopsy, treatment planning, and treatment response monitoring . As the primary imaging modality for early detection and diagnosis of breast cancer, mammography has achieved significant success and has reduced the mortality from breast cancer by 15%–35% . However, about 15%–20% of cancers are still missed, and 65%–85% of breast biopsies are performed on benign lesions . Consequently, complementary imaging modalities, such as breast dynamic contrast-enhanced magnetic resonance imaging (DCE-MRI) and breast sonography (ie, breast ultrasound imaging), are being investigated to improve the accuracy of breast cancer diagnosis.
Get Radiology Tree app to read full this article<
Get Radiology Tree app to read full this article<
Get Radiology Tree app to read full this article<
Get Radiology Tree app to read full this article<
Materials and methods
Database
Get Radiology Tree app to read full this article<
Get Radiology Tree app to read full this article<
Get Radiology Tree app to read full this article<
Get Radiology Tree app to read full this article<
Get Radiology Tree app to read full this article<
Computerized Classification Methods
Get Radiology Tree app to read full this article<
Get Radiology Tree app to read full this article<
Get Radiology Tree app to read full this article<
Get Radiology Tree app to read full this article<
Performance Evaluation and Statistical Analysis
Get Radiology Tree app to read full this article<
Get Radiology Tree app to read full this article<
Results
Classification Performance of Single-Modality CAD
Get Radiology Tree app to read full this article<
Classification Performance of Single-modality CAD on the Multimodality Subset
Get Radiology Tree app to read full this article<
Get Radiology Tree app to read full this article<
Get Radiology Tree app to read full this article<
Get Radiology Tree app to read full this article<
Classification performance of multimodality CAD
Get Radiology Tree app to read full this article<
Get Radiology Tree app to read full this article<
Get Radiology Tree app to read full this article<
Get Radiology Tree app to read full this article<
Get Radiology Tree app to read full this article<
Table 1
Classification Performance of the Multimodality CAD Method in a Leave-one-lesion-out Cross-validation for the Task of Differentiating Malignant and Benign Lesions, and the Comparison with the Performance of Single-modality CAD
Modality_AUC M_ ± SE_AUC S_ ± SE_P_ Value Significance Level 95% CI of ▵ AUC FFDM and DCE-MRI 0.87 ± 0.03 — — — — FFDM (scenario 1) — 0.71 ± 0.04 <10 −4 0.0125 [0.09, 0.23] FFDM (scenario 2) — 0.74 ± 0.04 .002 0.0250 [0.05, 0.20] DCE-MRI (scenario 1) — 0.77 ± 0.04 .009 0.0500 [0.03, 0.15] DCE-MRI (scenario 2) — 0.78 ± 0.04 .004 0.0375 [0.02, 0.13]
CAD, computer-aided diagnosis; FFDM, full-field digital mammography; DCE-MRI, dynamic contrast-enhanced magnetic resonance imaging.
The value after “±” is the standard error (SE) associated with each AUC . The two-tailed P value and 95% CI of ▵ AUC were calculated by ROCKIT. The significance level column represents the significance level of individual tests adjusted with Holm t -test (overall significance level α T = 0.05).
Get Radiology Tree app to read full this article<
Discussion
Get Radiology Tree app to read full this article<
Get Radiology Tree app to read full this article<
Get Radiology Tree app to read full this article<
Get Radiology Tree app to read full this article<
Get Radiology Tree app to read full this article<
Get Radiology Tree app to read full this article<
Get Radiology Tree app to read full this article<
Conclusion
Get Radiology Tree app to read full this article<
Acknowledgment
Get Radiology Tree app to read full this article<
Get Radiology Tree app to read full this article<
Get Radiology Tree app to read full this article<
References
1. Jemal A., Siegel R., Ward E., et. al.: Cancer statistics, 2009. CA Cancer J Clin 2009; 59: pp. 225-249.
2. Heywang-Kobrunner S.H., Dershaw D.D., Schreer I.: Diagnostic breast imaging: mammography, sonography, magnetic resonance imaging, and interventional procedures.2001.Thieme Medical PublisherNew York
3. Kuhl C.K.: The current status of breast MR imaging: part II: clinical applications. Radiology 2007; 244: pp. 672-691.
4. Humphrey L.L., Helfand M., Chan B., et. al.: Breast cancer screening: a summary of the evidence for the U.S. preventive services task force. Ann Intern Med 2002; 137: pp. 347-360.
5. Institute of Medicine: Saving women’s lives: Integration and innovation: a framework for progress in early detection and diagnosis of breast cancer.2005.Washington D National Academic Press
6. Harms S.E.: Technical report of the international working group on breast MRI. J Magn Reson Imaging 1999; 10: 980–980
7. Bird R.E., Wallace T.W., Yankaskas B.C.: Analysis of cancers missed at screening mammography. Radiology 1992; 184: pp. 613-617.
8. Beam C.A., Layde P.M., Sullivan D.C.: Variability in the interpretation of screening mammography by US radiologists: findings from a national sample. Arch Intern Med 1996; 156: pp. 209-213.
9. Lehman C.D., Gatsonis C., Kuhl C.K., et. al.: MRI evaluation of the contralateral breast in women with recently diagnosed breast cancer. N Engl J Med 2007; 356: pp. 1295-1303.
10. Kuhl C.K., Schrading S., Bieling H.B., et. al.: MRI for diagnosis of pure ductal carcinoma in situ: A prospective observational study. Lancet 2007; 370: pp. 485-492.
11. Peters N.H., Rinkes I.H.B., Zuithoff N.P., et. al.: Meta-analysis of mr imaging in the diagnosis of breast lesions. Radiology 2008; 246: pp. 116-124.
12. Giger M.L., Chan H.P., Boone J.: Anniversary paper: history and status of CAD and quantitative image analysis: the role of medical physics and AAPM. Med Phys 2008; 35: pp. 5799-5820.
13. Elter M., Horsch A.: CADx of mammographic masses and clutered microcalcifications: a review. Med Phys 2009; 36: pp. 2052-2068.
14. Gale A.G., Roebuck E.J., Riley P., et. al.: Computer aids to mammographic diagnosis. Br J Radiol 1987; 60: pp. 887-891.
15. Swett H.A., Miller P.A.: ICON: a computer-based approach to differential diagnosis in radiology. Radiology 1987; 163: pp. 555-558.
16. Huo Z., Giger M.L., Vyborny C.J., et. al.: Automated computerized classification of malignant and benign masses on digitized mammograms. Acad Radiol 1998; 5: pp. 155-168.
17. Garra B.S., Krasner B.H., Horii S.C., et. al.: Improving the distinction between benign and malignant breast lesions: the value of sonographic texture analysis. Ultrason Imaging 1993; 15: pp. 267-285.
18. Huber S., Delorme S., Knopp M.V., et. al.: Breast tumors: computer-assisted quantitative assessment with color Doppler US. Radiology 1994; 192: pp. 797-801.
19. Giger M.L., Al-Hallaq H., Huo Z., et. al.: Computerized analysis of lesions in ultrasound images of the breast. Acad Radiol 1999; 6: pp. 665-674.
20. Horsch K., Giger M.L., Venta L.A., et. al.: Computerized diagnosis of breast lesions on ultrasound. Med Phys 2002; 29: pp. 157-164.
21. Gilhuijs K.G.A., Giger M.L., Bick U.: Automated analysis of breast lesions in three dimensions using dynamic magnetic resonance imaging. Med Phys 1998; 25: pp. 1647-1654.
22. Penn A.I., Bolinger L., Schnall M.D., et. al.: Discrimination of MR images of breast masses with fractal-interpolation function models. Acad Radiol 1999; 6: pp. 156-163.
23. Chen W., Giger M.L., Lan L., et. al.: Computerized interpretation of breast MRI: investigation of enhancement-variance dynamics. Med Phys 2004; 31: pp. 1076-1082.
24. Sahiner B., Chan H., Petrick N., et. al.: Improvement of mammographic mass characterization using spiculation measures and morphological features. Med Phys 2001; 28: pp. 1455-1465.
25. Varela C., Timp S., Karssemeijer N.: Use of border information in the 25. Classification of mammographic masses. Phys Med Biol 2006; 51: pp. 425-441.
26. Huang S., Chang R., Chen D., et. al.: Characterization of spiculation on ultrasound lesions. IEEE Trans Med Imaging 2004; 23: pp. 111-121.
27. Sahiner B., Chan H., Roubidoux M.A., et. al.: Computerized characterization of breast masses on three-dimensional ultrasound volumes. Med Phys 2004; 31: pp. 744-754.
28. Chen W., Giger M.L., Bick U., et. al.: Automatic identification and classification of characteristic kinetic curves of breast lesions on DCE-MRI. Med Phys 2006; 33: pp. 2878-2887.
29. Zheng Y., Baloch B., Englander S., et. al.: Segmentation and classification of breast tumor using dynamic contrast-enhanced MR images. In: Medical image computing and computer-assisted intervention. MICCAI 2007; 4792: pp. 393-401.
30. Williams T.C., DeMartini W.B., Partridge S.C., et. al.: Breast MR imaging: computer-aided evaluation program for discriminating benign from malignant lesions. Radiology 2007; 244: pp. 94-103.
31. Drukker K., Horsch K., Giger M.L.: Multimodality computerized diagnosis of breast lesions using mammography and sonography. Acad Radiol 2005; 12: pp. 970-979.
32. Jesneck J.L., Lo J.Y., Baker J.A.: Breast mass lesions: computer-aided diagnosis methods with mammographic and sonographic descriptors. Radiology 2007; 244: pp. 390-398.
33. Horsch K., Giger M.L., Vyborny C.J., et. al.: Classification of breast lesions with multimodality computer-aided diagnosis: observer study results on an independent clinical data set. Radiology 2006; 240: pp. 357-368.
34. Horsch K., Giger M.L., Metz C.E.: Potential effect of different radiologist reporting methods on studies showing benefit of CAD. Acad Radiol 2008; 15: pp. 139-152.
35. Sahiner B., Chan H.-P., Hadjiiski L.M., et. al.: Multimodality CADx: ROC study of the effect on radiologists’ accuracy in characterizing breast masses on mammograms and 3D ultrasound images. Acad Radiol 2009; 16: pp. 810-818.
36. Li H., Giger M.L., Yuan Y., et. al.: Evaluation of computer-aided diagnosis on a large clinical full-field digital mammographic dataset. Acad Radiol 2008; 15: pp. 1437-1445.
37. Yuan Y., Giger M.L., Li H., et. al.: A dual-stage method for lesion segmentation on digital mammograms. Med Phys 2007; 34: pp. 4180-4193.
38. Huo Z., Giger M.L., Vyborny C.J., et. al.: Analysis of spiculation in the computerized classification of mammographic masses. Med Phys 1995; 22: pp. 1569-1579.
39. Chen W., Giger M.L., Bick U.: A fuzzy c-mean (FCM)-based approach for computerized segmentation of breast lesions in dynamic contrast-enhanced MR images. Acad Radiol 2006; 13: pp. 63-72.
40. Chan T.F., Vese L.A.: Active contours without edges. IEEE Trans Image Processing 2001; 10: pp. 266-277.
41. Kupinski M.A., Giger M.L.: Automated seeded lesion segmentation on digital mammograms. IEEE Trans Med Imaging 1998; 17: pp. 510-517.
42. Lachenbruch P.A.: Discriminant analysis.1975.HafnerLondon, UK
43. Bishop C.M.: Neural networks for pattern recognition.1995.Oxford UniversityOxford, UK
44. Kupinski M.A., Edwards D.C., Giger M.L., et. al.: Ideal observer approximation using Bayesian classification neural networks. IEEE Trans Med Imaging 2001; 20: pp. 886-899.
45. Li Q., Doi K.: Reduction of bias and variance for evaluation of computer-aided diagnostic schemes. Med Phys 2006; 33: pp. 868-875.
46. Metz C.E.: ROC methology in radiologic imaging. Invest Radiol 1986; 21: pp. 720-733.
47. Metz C.E., Herman B.A., Shen J.: Maximum likelihood estimation of receiver operating characteristic ROC curves from continuously-distributed data. Stat Med 1998; 17: pp. 1033-1053.
48. Metz C.E., Herman B.A., Roe C.A.: Statistical comparison of two ROC-curve estimates obtained from partially-paired datasets. Med Decision Making 1998; 18: pp. 110-121.
49. Glantz S.A.: Primer of biostatistics.2002.McGraw-HillNew York
50. Kuhl C.K., Schild H.H.: Dynamic imaging interpretation of MRI of the breast. J Magn Reson Imaging 2000; 12: pp. 965-974.
51. Japkowicz N., Stephen S.: The class imbalance problem: a systematic study. Intell Data Anal 2002; 6: pp. 429-449.
52. Weiss G.M., Provost F.: Learning when training data are costly: The effect of class distribution on tree induction. J Artificial Intell Res 2003; 19: pp. 315-354.