
Rationale and Objectives
Treatment of brain neoplasms can greatly benefit from better delineation of bulk neoplasm boundary and the extent and degree of more subtle neoplastic infiltration. Magnetic resonance imaging (MRI) is the primary imaging modality for evaluation before and after therapy, typically combining conventional sequences with more advanced techniques such as perfusion-weighted imaging and diffusion tensor imaging (DTI). The purpose of this study is to quantify the multiparametric imaging profile of neoplasms by integrating structural MRI and DTI via statistical image analysis methods to potentially capture complex and subtle tissue characteristics that are not obvious from any individual image or parameter.
Materials and Methods
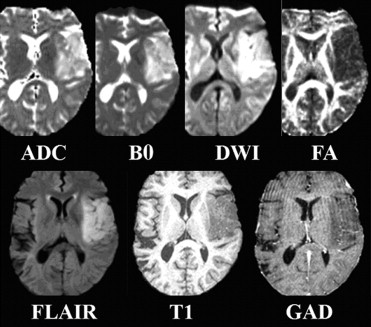
Five structural MRI sequences, namely, B0, diffusion-weighted images, fluid-attenuated inversion recovery, T1-weighted, and gadolinium-enhanced T1-weighted, and two scalar maps computed from DTI (ie, fractional anisotropy and apparent diffusion coefficient) are used to create an intensity-based tissue profile. This is incorporated into a nonlinear pattern classification technique to create a multiparametric probabilistic tissue characterization, which is applied to data from 14 patients with newly diagnosed primary high-grade neoplasms who have not received any therapy before imaging.
Results
Preliminary results demonstrate that this multiparametric tissue characterization helps to better differentiate among neoplasm, edema, and healthy tissue, and to identify tissue that is likely to progress to neoplasm in the future. This has been validated on expert assessed tissue.
Conclusion
This approach has potential applications in treatment, aiding computer-assisted surgery by determining the spatial distributions of healthy and neoplastic tissue, as well as in identifying tissue that is relatively more prone to tumor recurrence.
Treatment of brain neoplasms varies with their type, grade, location, and extent, and often includes a combination of surgical resection and chemoradiation. This can greatly benefit from better delineation of bulk neoplasm boundary, as well as knowledge of the extent and degree of neoplastic infiltration. The true boundary of many neoplasms is difficult to identify with conventional approaches, especially in gliomas that are diffuse and infiltrative. Relatively advanced imaging strategies, such as perfusion-weighted imaging (PWI), magnetic resonance spectroscopy (MRS), and diffusion tensor imaging (DTI), have improved evaluation in this regard, but remain limited. Tissue characterization is difficult because neoplasms are often heterogeneous, and different histopathologic grades can be present throughout an individual neoplasm. Because the treatment planning of brain neoplasms typically seeks to reduce risk for severe functional loss, large portions of brain neoplasms may remain untreated or suboptimally treated such that time to recurrence shortens and prognosis worsens.
Clinical decisions regarding glioma treatments rely, in part, on magnetic resonance imaging (MRI) before and after surgery as well as follow-up during and after chemoradiation. Routine MRI sequences such as fluid-attenuated inversion recovery (FLAIR) and contrast-enhanced T1-weighted MR images are used to obtain estimates of enhancing and nonenhancing tissue, as well as of edema (ED) or gliosis. However, this process is time and labor intensive, susceptible to inter-rater variability, and often inaccurate, especially in the setting of treatment-related necrosis versus recurrence/progression. Clinical decision making has been aided by the efforts of the medical image analysis community in developing MRI-based automated tumor detection and segmentation ( ).
Get Radiology Tree app to read full this article<
Get Radiology Tree app to read full this article<
Get Radiology Tree app to read full this article<
Materials and methods
Get Radiology Tree app to read full this article<
Data Acquisition
Get Radiology Tree app to read full this article<
Creation of tissue abnormality map
Get Radiology Tree app to read full this article<
Get Radiology Tree app to read full this article<
Creation of recurrence maps
Get Radiology Tree app to read full this article<
Get Radiology Tree app to read full this article<
Get Radiology Tree app to read full this article<
Preprocessing
Get Radiology Tree app to read full this article<
Design of Tissue Abnormality Feature Vector
Get Radiology Tree app to read full this article<
vx→−→=[I(ADC)x→,I(B0)x→,I(DWI)x→,I(FA)x→,I(FLAIR)x→,I(T1)x→,I(GAD)x→]T v
x
→
→
=
[
I
x
→
(
A
D
C
)
,
I
x
→
(
B
0
)
,
I
x
→
(
D
W
I
)
,
I
x
→
(
F
A
)
,
I
x
→
(
F
L
A
I
R
)
,
I
x
→
(
T
1
)
,
I
x
→
(
G
A
D
)
]
T
where I(M)x→ I
x
→
(
M
) denotes the intensity of image of modality M at voxel x→ x
→ . These feature vectors are defined at each voxel in the training samples. To render this feature vector more robust to noise, we incorporate neighborhood information by using four of its neighbors. Seven-dimensional intensity features for these 5 voxels are stacked into a long vector (35-dimensional), which is then used as a feature vector.
Get Radiology Tree app to read full this article<
Selection of the training samples
Get Radiology Tree app to read full this article<
Get Radiology Tree app to read full this article<
Creation of tissue classifiers and tissue probability maps
Get Radiology Tree app to read full this article<
Intrapatient Classification
Get Radiology Tree app to read full this article<
Interpatient Classification
Get Radiology Tree app to read full this article<
Design of Recurrence Map
Get Radiology Tree app to read full this article<
Get Radiology Tree app to read full this article<
Results
Get Radiology Tree app to read full this article<
Get Radiology Tree app to read full this article<
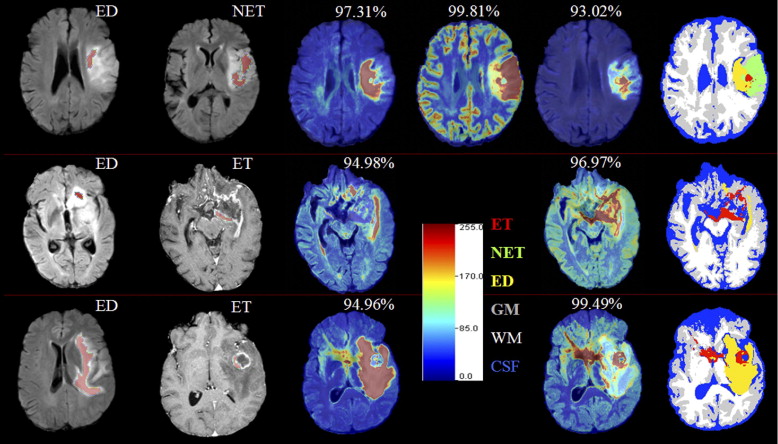
Intrapatient Tissue Classification
Get Radiology Tree app to read full this article<
Table 1
Average ( avg ) Classification Rates and their Standard Deviation ( stdev ) of the Classification Rates, Sensitivity, and Specificity, Over All Subjects for Intrapatient and Interpatient Framework Using Bayesian and SVM Classifications
Classification Rates Sensitivity Tumor vs. Healthy Specificity Tumor vs. Healthy ED ET NET CSF GM WM Bayesian classification (intrapatient)Avg 97.03 96.39 93.05 89.68 74.86 82.95 91.84 99.57Stdev 3.18 3.4 11.82 21.72 6.95 7.73 6.01 0.63 Bayesian classification (interpatient)Avg 53.86 86.56 51.11 82.31 66.78 76.06 75.62 94.57Stdev 47.59 27.74 43.86 15.82 9.22 15.05 36.14 6.12 SVM classification (interpatient)Avg 93.38 88.79 34.01 91.34 72.21 85.33 87.54 97.03Stdev 8.75 29.03 38.71 7.9 12.08 9.45 15.58 3.26
CSF, cerebrospinal fluid; ED, edema; ET, enhancing neoplasm/tumor; GM, gray matter; NET, nonenhancing neoplasm/tumor; SVM, support vector machines; WM, white matter.
Get Radiology Tree app to read full this article<
Interpatient Tissue Classification
Get Radiology Tree app to read full this article<
Get Radiology Tree app to read full this article<
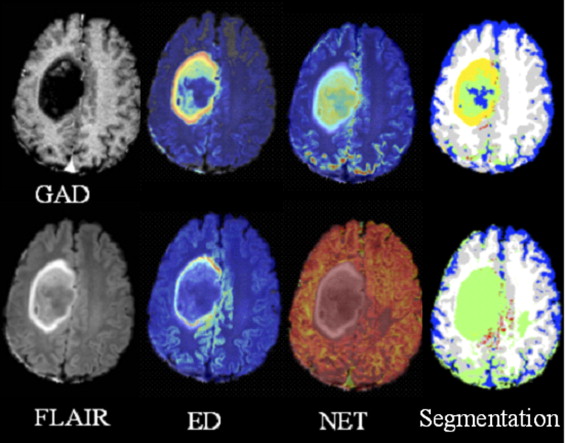
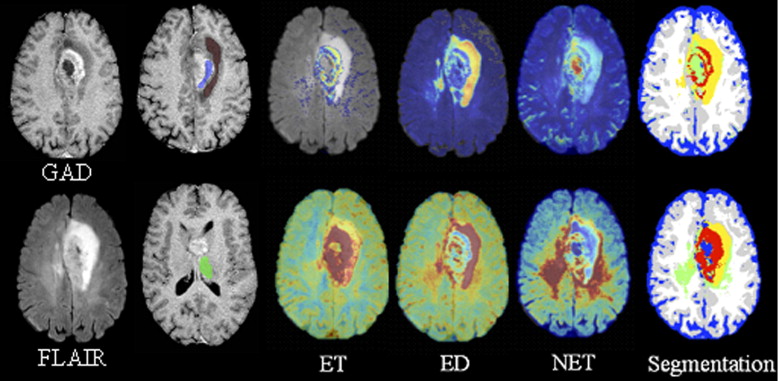
Table 2
Classification Rates Sensitivity and Specificity of Applying the SVM and Bayesian Interpatient Classification Framework to the Two Patients Shown in Figures 4 and 5
Patient in Figure Classification Rates Sensitivity Tumor vs. Healthy Specificity Tumor vs. Healthy ED ET NET CSF GM WM Fig. 4 SVM 79.78 NA 56.61 78.11 81.99 84.36 71.07 99.49 Bayes 2.28 NA 100 37.01 56.25 60.58 99.98 77.6 Fig. 5 SVM 100 11.56 NA 99.9 54.66 96.16 81.59 99.97 Bayes 100 99.03 NA 97.87 72.84 61.26 99.02 98.11
CSF, cerebrospinal fluid; ED, edema; ET, enhancing neoplasm/tumor; GM, gray matter; NET, nonenhancing neoplasm/tumor; SVM, support vector machines; WM, white matter.
Overall, the SVM classification performs better than the Bayesian. The low classification rates of healthy tissue are due to these samples being selected through an automated segmentation method, which may have led to errors in training.
Get Radiology Tree app to read full this article<
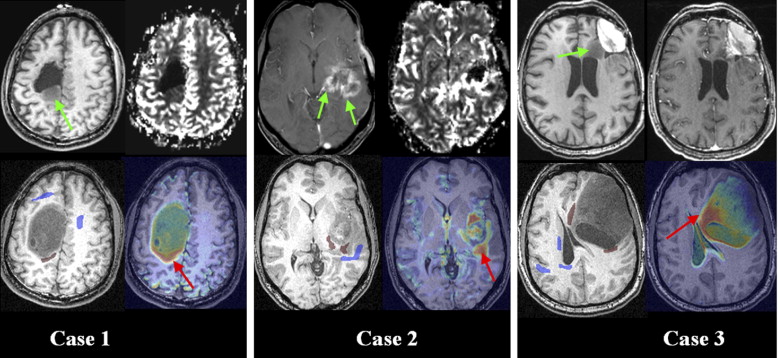
Analyzing Patterns of Tumor Recurrence
Get Radiology Tree app to read full this article<
Discussion
Get Radiology Tree app to read full this article<
Get Radiology Tree app to read full this article<
Get Radiology Tree app to read full this article<
Get Radiology Tree app to read full this article<
Conclusions
Get Radiology Tree app to read full this article<
References
1. Prastawa M., Bullitt E., Ho S., et. al.: A brain tumor segmentation framework based on outlier detection. Med Image Anal 2004; 8: pp. 275-283.
2. Schmidt M, Levner I, Greiner R, et al. Segmenting brain tumors using alignment-based features. The Fourth International Conference on Machine Learning and Applications, Los Angeles, CA, December 2005.
3. Kaus M.R., Warfield S.K., Nabavi A., et. al.: Automated segmentation of MR images of brain tumors. Radiology 2001; 218: pp. 586-591.
4. Just M., Thelen M.: Tissue characterization with T1, T2 and proton density values: results in 160 patients with brain tumors. Radiology 1988; 169: pp. 779-785.
5. Fletcher-Heath L.M., Hall L.O., Goldgof D.B., et. al.: Automatic segmentation of non-enhancing brain tumors in magnetic resonance images. Artif Intell Med 2001; 21: pp. 43-63.
6. Clark M., Hall L., Goldgof D., et. al.: Automatic tumor segmentation using knowledge-based techniques. IEEE Trans Med Imaging 1998; 17: pp. 187-201.
7. Young R.J., Knopp E.A.: Brain MRI: tumor evaluation. J Magn Res Imaging 2006; 24: pp. 709-724.
8. Bordignon K.C., Neto M.C., Ramina R., et. al.: Patterns of neuroaxis dissemination of gliomas: suggestion of a classification based on magnetic resonance imaging findings. Surg Neurol 2006; 65: pp. 472-477.
9. Talos I.-F., Zou K.H., Ohno-Machado L., et. al.: Supratentorial low grade glioma resectability: statistical predictive analysis based on anatomic MR features and tumor characteristics. Radiology 2006; 239: pp. 506-513.
10. Aronen H.J., Gazit I.E., Louis D.N., et. al.: Cerebral blood volume maps of gliomas: comparison with tumor grade and histological findings. Radiology 1994; 191: pp. 41-51.
11. Krabbe K., Gideon P., Wagn P., et. al.: MR diffusion imaging of human intracranial tumors. Neuroradiology 1997; 39: pp. 483-489.
12. Provenzale J.M., Mukundan S., Baroriak D.P.: Diffusion-weighted and perfusion MR imaging for brain tumor characterization and assessment of treatment. Radiology 2006; 239: pp. 632-649.
13. Bihan D.L., Mangin J.-F., Poupon C., et. al.: Diffusion tensor imaging: concepts and applications. J Magnet Reson Imaging 2001; 13: pp. 534-546.
14. Nimsky C., Ganslandt O., Hastreiter P., et. al.: Intraoperative diffusion tensor MR imaging: shifting of white matter tracts during neuro-surgical procedures—initial experience. Radiology 2005; 234: pp. 218-225.
15. Field A.S., Alexander A.L.: Diffusion tensor imaging in cerebral tumor diagnosis and therapy. Top Magnet Reson Imaging 2004; 15: pp. 315-324.
16. Stieltjes B., Schluter M., Didinger B., et. al.: Diffusion tensor imaging in primary brain tumors: reproducible quantitative analysis of corpus callosum infiltration and contralateral involvement using a probabilistic mixture model. Neuroimage 2006; 31: pp. 531-542.
17. Stadlbauer A., Nimsky C., Buslei R., et. al.: Diffusion tensor imaging and optimized fiber tracking in glioma patients: histopathologic evaluation of tumor-invaded white matter structures. Neuroimage 2007; 34: pp. 949-956.
18. Tummala R.P., Chu R.M., Liu H., et. al.: Application of diffusion tensor imaging to magnetic-resonance-guided brain tumor resection. Pediatr Neurosurg 2003; 39: pp. 39-43.
19. Mori S., Fredericksen K., Zijl P.C.M., et. al.: Brain white matter anatomy of tumor patients evaluated with diffusion tensor imaging. Ann Neurol 2002; 51: pp. 377-380.
20. Jellison B.J., Field A.S., Medow J., et. al.: Diffusion tensor imaging of cerebral white matter: a pictorial review of physics, fiber tract anatomy, and tumor imaging patterns. Am J Neuroradiol 2004; 25: pp. 356-369.
21. Sundgren P.C., Fan X., Weybright P., et. al.: Differentiation of recurrent brain tumor versus radiation injury using diffusion tensor imaging in patients with new contrast-enhancing lesions. Magnet Reson Imaging 2006; 24: pp. 1131-1142.
22. Hein P.A., Eskey C.J., Dunn J.F., et. al.: Diffusion-weighted imaging in the follow-up of treated high-grade gliomas: tumor recurrence versus radiation injury. AJNR Am J Neuroradiol 2004; 25: pp. 201-209.
23. Smith S.M., Jenkinson M., Woolrich M.W., et. al.: Advances in functional and structural MR image analysis and implementation as FSL. Neuroimage 2004; 23: pp. 208-219.
24. Jenkinson M., Smith S.: A global optimisation method for robust affine registration of brain images. Med Image Anal 2001; 5: pp. 143-156.
25. Zacharaki E.I., Shen D., Mohamed A., et. al.: Registration of brain images with tumors: towards the construction of statistical atlases for therapy planning.2006.ISBIArlington, VA
26. Zhang Y., Brady M., Smith S.: Segmentation of brain MR images through a hidden Markov random field model and the expectation maximization algorithm. IEEE Trans Med Imaging 2001; 20: pp. 45-57.
27. Schölkopf B., Smola A.J.: Learning with kernels: support vector machines, regularization, optimization and beyond (adaptive computation and machine learning).2001.The MIT PressCambridge, MA
28. LaConte S., Strother S., Cherkassky V., et. al.: Support vector machines for temporal classification of block design fMRI data. NeuroImage 2005; 26: pp. 317-329.
29. Davatzikos C., Shen D.G., Wu X., et. al.: Whole-brain morphometric study of schizophrenia reveals a spatially complex set of focal abnormalities. JAMA Arch Gen Psychiatry 2005; 62: pp. 1218-1227.
30. McLachlan G.J.: Discriminant analysis and statistical pattern recognition.2004.Wiley-InterscienceNew York (Wiley Series in Probability and Statistics).
31. Platt J.: Probabilistic outputs for support vector machines and comparison to regularized likelihood methods.Smola A.J.Bartlett P.Schölkop B.Schuúrmans D.Advances in large margin classifiers.2000.MIT PressCambridge, MA:pp. 61-74.