
Rationale and Objectives
Meta-analyses of diagnostic accuracy studies produce summary estimates of sensitivity and specificity. Cancer staging relies on staging systems and meta-analysis is often performed after dichotomization of the staging results. For each dichotomization, summary estimates of sensitivity and specificity can be calculated by repeated bivariate random-effects analyses. In this process, staging information is lost and under- and overstaging can not be adequately expressed.
Materials and Methods
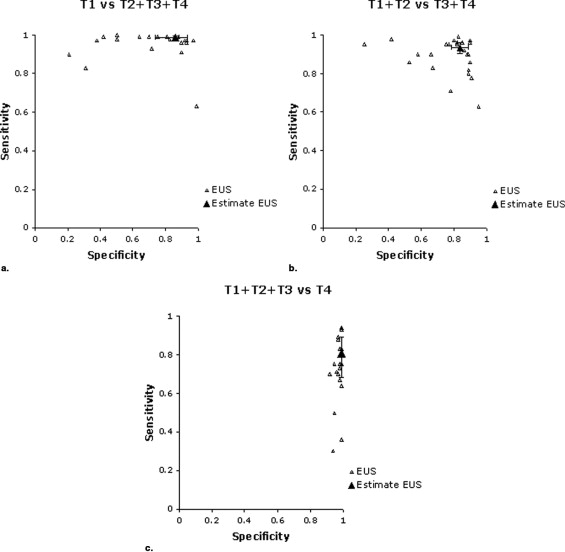
We propose a new multivariate random-effects approach, which is an extension of the bivariate random-effects approach. To illustrate the principles and outcomes of both approaches, we used data from a meta-analysis evaluating endoluminal ultrasonography in staging of rectal cancer. In the multivariate approach, results on correct staging and under- and overstaging were calculated. In addition, the results from this analysis were used to calculate sensitivity and specificity estimates for each dichotomization and these estimates were compared with the results of the repeated bivariate analyses.
Results
By the multivariate analysis, results on correct staging and under- and overstaging were obtained. The sensitivity and specificity estimates for the dichotomizations, calculated from the results of this multivariate approach, were also comparable with the sensitivity and specificity estimates obtained by the repeated bivariate analyses.
Conclusions
The multivariate random-effects approach can be a useful meta-analytic method for summarizing cancer staging data presented in diagnostic accuracy studies.
Systematic reviews of diagnostic test accuracy studies are undertaken to collect the available evidence, to evaluate the quality of published studies, and to account for variation in findings between studies ( ).
The diagnostic accuracy of a test is often quantified in terms of its sensitivity and specificity. When results from several studies of a diagnostic test are available, pooling of the results in a meta-analysis can be done in several ways. Several authors ( ) have shown the potential of a bivariate random-effects approach, and others ( ) have proposed a hierarchical summary receiver operating characteristic to obtain estimates of sensitivity and specificity. These two models are very closely related ( ).
Get Radiology Tree app to read full this article<
Get Radiology Tree app to read full this article<
Get Radiology Tree app to read full this article<
Methods
The Bivariate Random-Effects Approach
Get Radiology Tree app to read full this article<
Principle
Dichotomizing data for bivariate analysis
Get Radiology Tree app to read full this article<
Table 1
Endoluminal Ultrasonography Data Compared With Reference Standard
Reference Standard T1 T2 T3 T4 Endoluminal ultrasonography T1 n 11 n 12 n 13 n 14 T2 n 21 n 22 n 23 n 24 T3 n 31 n 32 n 33 n 34 T4 n 41 n 42 n 43 n 44 Sum n 1 n 2 n 3 n 4
Get Radiology Tree app to read full this article<
Get Radiology Tree app to read full this article<
The bivariate analysis
Get Radiology Tree app to read full this article<
Get Radiology Tree app to read full this article<
Get Radiology Tree app to read full this article<
Get Radiology Tree app to read full this article<
Get Radiology Tree app to read full this article<
Outcomes of the bivariate random-effects approach
Get Radiology Tree app to read full this article<
Get Radiology Tree app to read full this article<
Multivariate random-effects approach
Get Radiology Tree app to read full this article<
Principle
Get Radiology Tree app to read full this article<
Table 2
Example of a 4 × 4 Table Containing the 16 Proportions
Reference Standard T1 T2 T3 T4 Endoluminal ultrasonography T1 p 11 p 12 p 13 p 14 T2 p 21 p 22 p 23 p 24 T3 p 31 p 32 p 33 p 34 T4 p 41 p 42 p 43 p 44 Sum 1 1 1 1
p 11 is defined as p 11 = n 11 /n 1 , p 21 = n 21 /n 1 , and p 12 = n 12 /n 2 , and so on ( Table 1 ).
Get Radiology Tree app to read full this article<
Get Radiology Tree app to read full this article<
Get Radiology Tree app to read full this article<
Get Radiology Tree app to read full this article<
Get Radiology Tree app to read full this article<
Outcomes of the Multivariate Random-Effects Approach
Get Radiology Tree app to read full this article<
Get Radiology Tree app to read full this article<
Results
Get Radiology Tree app to read full this article<
Get Radiology Tree app to read full this article<
Bivariate Random-Effects Approach
Get Radiology Tree app to read full this article<
Get Radiology Tree app to read full this article<
Get Radiology Tree app to read full this article<
Get Radiology Tree app to read full this article<
Multivariate Random-Effects Approach
Get Radiology Tree app to read full this article<
Table 3
Staging Results Obtained by the Multivariate Approach
T Stage on Reference Standard T1 T2 T3 T4 Endoluminal ultrasonography T1 0.88 (0.82–0.91) 0.08 (0.04–0.10) 0.02 (0–0.03) 0.00 (0–0) T2 0.10 (0.07–0.15) 0.63 (0.59–0.71) 0.08 (0.05–0.11) 0.01 (0–0.04) T3 0.02 (0.01–0.04) 0.28 (0.22–0.34) 0.90 (0.89–0.93) 0.20 (0.12–0.28) T4 0 (0–0.01) 0.01 (0–.015) 0.01 (0–0.02) 0.78 (0.69–0.87)
Proportions per stage are presented with 95% confidence intervals in parentheses.
Get Radiology Tree app to read full this article<
Get Radiology Tree app to read full this article<
Comparison of Both Approaches
Get Radiology Tree app to read full this article<
Table 4
Comparison of the Results of the Bivariate and Multivariate Approaches
Dichotomization Sensitivity Specificity Bivariate Multivariate Bivariate Multivariate T1 versus T2 + T3 + T4 0.99 (0.97–0.995) 0.97 (0.967–0.974) 0.86 (0.74–0.93) 0.88 (0.833–0.918) T1 + T2 versus T3 + T4 0.94 (0.91–0.96) 0.95 (0.939–0.968) 0.84 (0.76–0.89) 0.85 (0.821–0.885) T1 + T2 + T3 versus T4 0.81 (0.68–0.89) 0.78 (0.699–0.854) 0.99 (0.98–0.996) 0.99 (0.988–0.995)
Get Radiology Tree app to read full this article<
Discussions
Get Radiology Tree app to read full this article<
Get Radiology Tree app to read full this article<
Get Radiology Tree app to read full this article<
Get Radiology Tree app to read full this article<
Get Radiology Tree app to read full this article<
Get Radiology Tree app to read full this article<
Get Radiology Tree app to read full this article<
Get Radiology Tree app to read full this article<
Get Radiology Tree app to read full this article<
Get Radiology Tree app to read full this article<
Get Radiology Tree app to read full this article<
Appendix 1
Get Radiology Tree app to read full this article<
ρ11=ea11ea11+ea21+ea31+1,ρ21=ea21ea11+ea21+ea31+1. ρ
11
=
e
a
11
e
a
11
+
e
a
21
+
e
a
31
+
1
,
ρ
21
=
e
a
21
e
a
11
+
e
a
21
+
e
a
31
+
1
.
ρ31=ea31ea11+ea21+ea31+1,ρ41=1ea11+ea21+ea31+1, ρ
31
=
e
a
31
e
a
11
+
e
a
21
+
e
a
31
+
1
,
ρ
41
=
1
e
a
11
+
e
a
21
+
e
a
31
+
1
,
depending on the parameters: a 11 , a 21 , a 31. The proportions (ρ 12 , ρ 22 , ρ 32 , ρ 42 ), (ρ 13 , ρ 23 , ρ 33 , ρ 43 ), and (ρ 14 , ρ 24 , ρ 34 , ρ 44), are transformed similarly depending on parameters (a 12 , a 22 , a 32 ), (a 13 , a 23 , a 33 ), and (a 14 , a 24 , a 34 ), respectively. We will assume that in our model, these 12 parameters (a 11 , a 21 , a 31, a 12 , a 22 , a 32, a 13 , a 23 , a 33 , a 14 , a 24 , a 34 ) follow a 12-variate normal distribution with means (μ 11 , μ 21 , μ 31, μ 12 , μ 22 , μ 32, μ 13 , μ 23 , μ 33 , μ 14 , μ 24 , μ 34 ) and covariance matrix Σ.
Σ=⎛⎝⎜⎜⎜⎜⎜⎜⎜⎜⎜⎜⎜⎜⎜⎜⎜⎜⎜⎜⎜⎜⎜⎜⎜⎜⎜⎜σ21………..σ22……….σ23………σ24……..σ25..σ5,8….σ26……σ27…..σ28….σ29…σ210.σ10,12σ211.σ212.⎞⎠⎟⎟⎟⎟⎟⎟⎟⎟⎟⎟⎟⎟⎟⎟⎟⎟⎟⎟⎟⎟⎟⎟⎟⎟⎟⎟ Σ
=
(
σ
1
2
.
σ
2
2
.
.
σ
3
2
.
.
.
σ
4
2
.
.
.
.
σ
5
2
.
.
.
.
.
σ
6
2
.
.
.
.
.
.
σ
7
2
.
.
.
.
σ
5
,
8
.
.
σ
8
2
.
.
.
.
.
.
.
.
σ
9
2
.
.
.
.
.
.
.
.
.
σ
10
2
.
.
.
.
.
.
.
.
.
.
σ
11
2
.
.
.
.
.
.
.
.
.
σ
10
,
12
.
σ
12
2
.
)
Get Radiology Tree app to read full this article<
Get Radiology Tree app to read full this article<
Appendix 2
Get Radiology Tree app to read full this article<
Get Radiology Tree app to read full this article<
Get Radiology Tree app to read full this article<
Get Radiology Tree app to read full this article<
Appendix 3
Get Radiology Tree app to read full this article<
Study Number T1 by Reference Standard T2 by Reference Standard T3 by Reference Standard T4 by Reference Standard EUS T1 T2 T3 T4 T1 T2 T3 T4 T1 T2 T3 T4 T1 T2 T3 T4 Herzog 1993 19 3 0 0 1 17 8 0 0 0 67 0 0 0 0 2 Nielsen 1993 0 0 0 0 0 2 3 0 0 0 14 0 0 0 2 7 Houvenaeghel 1993 2 3 1 1 2 5 1 0 2 2 12 0 0 0 0 1 Hulsmans 1994 1 0 2 0 1 4 16 1 0 1 25 0 0 0 1 3 Kim 1994 1 0 0 0 0 3 1 0 0 1 25 1 0 0 1 1 Adams 1995 59 0 0 0 1 2 0 0 0 0 0 0 0 0 0 0 Starck 1995 1 1 0 0 0 8 1 0 0 2 21 0 0 0 0 0 Fedyaev 1995 0 0 0 0 0 30 3 0 0 2 41 2 0 0 3 28 Kaneko 1996 3 1 0 0 0 9 1 0 0 3 21 0 0 0 0 0 Pegios 1996 6 1 0 0 0 13 3 0 0 3 51 1 0 0 7 15 Osti 1997 3 0 0 0 0 11 7 0 0 4 32 0 0 0 0 6 Sailer 1997 43 10 0 0 1 12 16 0 0 1 61 5 0 1 2 8 Hunerbein 1997 17 1 0 0 0 19 4 0 1 3 18 0 0 1 0 6 Maier 1997 4 2 0 0 0 15 6 0 0 2 45 0 0 0 4 2 Akasu 1997 32 1 1 0 4 19 11 0 0 4 78 2 0 0 3 9 Massari 1998 13 0 1 0 0 16 2 0 2 2 32 0 0 0 0 7 Scialpi 1999 0 0 0 0 0 0 0 0 0 0 16 1 0 0 1 3 Barbaro 1999 0 0 0 0 0 9 1 0 0 1 15 0 0 0 0 2 Carmody 2000 11 4 0 0 1 7 2 0 0 0 11 0 0 0 0 0 Gualdi 2000 2 0 0 0 0 5 5 0 0 1 13 0 0 0 0 0 Blomqvist 2000 1 1 3 1 4 3 4 0 0 4 25 0 0 0 0 3 Akahoshi 2000 9 1 0 0 0 2 1 0 0 5 20 0 0 0 0 1 Akasu 2000 74 4 2 0 8 40 26 0 0 6 149 0 0 0 0 0 Hunerbein 2000 16 0 0 0 0 10 1 0 0 1 1 0 0 0 0 1 Steele 2002 5 5 2 0 0 7 5 1 0 3 12 1 0 0 3 1 Garcia-Aquilar 2002 226 24 0 0 24 104 37 2 3 25 92 2 0 0 2 4
Get Radiology Tree app to read full this article<
References
1. Cook D.J., Greengold N.L., Ellrodt A.G., et. al.: The relation between systematic reviews and practice guidelines. Ann Intern Med 1997; 127: pp. 210-216.
2. Cook D.J., Mulrow C.D., Haynes R.B.: Systematic reviews: synthesis of best evidence for clinical decisions. Ann Intern Med 1997; 126: pp. 376-380.
3. Gallagher E.J.: Systematic reviews: a logical methodological extension of evidence-based medicine. Acad Emerg Med 1999; 6: pp. 1255-1260.
4. Deville W.L., Buntinx F., van der Windt D.A., et. al.: Didactic guidelines for conducting systematic reviews of studies evaluating the accuracy of diagnostic tests.Knottnerus J.A.The evidence base of diagnosis.2001.BMJ Publishing GroupLondon:
5. Deeks J.J.: Systematic reviews in health care: systematic reviews of evaluations of diagnostic and screening tests. BMJ 2001; 323: pp. 157-162.
6. Khan K.S.: Systematic reviews of diagnostic tests: a guide to methods and application. Best Pract Res Clin Obstet Gynaecol 2005; 19: pp. 37-46.
7. van Houwelingen H.C., Arends L.R., Stijnen T.: Advanced methods in meta-analysis: multivariate approach and meta-regression. Stat Med 2002; 21: pp. 589-624.
8. Arends L.R., Voko Z., Stijnen T.: Combining multiple outcome measures in a meta-analysis: an application. Stat Med 2003; 22: pp. 1335-1353.
9. Reitsma J.B., Glas A.S., Rutjes A.W., et. al.: Bivariate analysis of sensitivity and specificity produces informative summary measures in diagnostic reviews. J Clin Epidemiol 2005; 58: pp. 982-990.
10. Rutter C.M., Gatsonis C.A.: A hierarchical regression approach to meta-analysis of diagnostic test accuracy evaluations. Stat Med 2001; 20: pp. 2865-2884.
11. Harbord R.M., Deeks J.J., Egger M., et. al.: A unification of models for meta-analysis of diagnostic accuracy studies. Biostatistics 2007; 8: pp. 239-251.
12. Steele S.R., Martin M.J., Place R.J.: Flexible endorectal ultrasound for predicting pathologic stage of rectal cancers. Am J Surg 2002; 184: pp. 126-130.
13. Garcia-Aguilar J., Pollack J., Lee S.H., et. al.: Accuracy of endorectal ultrasonography in preoperative staging of rectal tumors. Dis Colon Rectum 2002; 45: pp. 10-15.
14. Herzog U., von Flue M., Tondelli P., Schuppisser J.P.: How accurate is endorectal ultrasound in the preoperative staging of rectal cancer?. Dis Colon Rectum 1993; 36: pp. 127-134.
15. Hadfield M.B., Nicholson A.A., MacDonald A.W., et. al.: Preoperative staging of rectal carcinoma by magnetic resonance imaging with a pelvic phased-array coil. Br J Surg 1997; 84: pp. 529-531.
16. Drew P.J., Farouk R., Turnbull L.W., et. al.: Preoperative magnetic resonance staging of rectal cancer with an endorectal coil and dynamic gadolinium enhancement. Br J Surg 1999; 86: pp. 250-254.
17. Bipat S., Glas A.S., Slors F.J., et. al.: Rectal cancer: local staging and assessment of lymph node involvement with endoluminal US, CT, and MR imaging—a meta-analysis. Radiology 2004; 232: pp. 773-783.
18. Akaike H.: A new look at the statistical model identification. IEEE Trans Automat Control 1974; 19: pp. 716-723.
19. Langer C., Liersch T., Markus P., et. al.: Transanal endoscopic microsurgery (TEM) for minimally invasive resection of rectal adenomas and “low-risk” carcinomas (uT1, G1 - 2). Z Gastroenterol 2002; 40: pp. 67-72.
20. Burghardt J., Buess G.: Transanal endoscopic microsurgery (TEM): a new technique and development during a time period of 20 years. Surg Technol Int 2005; 14: pp. 131-137.
21. Marijnen C.A., Nagtegaal I.D., Kapiteijn E., et. al.: Radiotherapy does not compensate for positive resection margins in rectal cancer patients: report of a multicenter randomized trial. Int J Radiat Oncol Biol Phys 2003; 55: pp. 1311-1320.
22. Goldberg S., Klas J.V.: Total mesorectal excision in the treatment of rectal cancer: a view from the USA. Semin Surg Oncol 1998; 15: pp. 87-90.
23. Wiig J.N., Carlsen E., Soreide O.: Mesorectal excision for rectal cancer: a view from Europe. Semin Surg Oncol 1998; 15: pp. 78-86.
24. Loizzi V., Cormio G., Loverro G., et. al.: Chemoradiation: a new approach for the treatment of cervical cancer. Int J Gynecol Cancer 2003; 13: pp. 580-586.
25. Panici P.B., Cutillo G., Angioli R.: Modulation of surgery in early invasive cervical cancer. Crit Rev Oncol Hematol 2003; 48: pp. 263-270.
26. duPont N.C., Monk B.J.: Chemotherapy in the management of cervical carcinoma. Clin Adv Hematol Oncol 2006; 4: pp. 279-286.
27. Duenas-Gonzalez A., Cetina L., Mariscal I., et. al.: Modern management of locally advanced cervical carcinoma. Cancer Treat Rev 2003; 29: pp. 389-399.
28. Kelsen D.P., Ginsberg R., Pajak T.F., et. al.: Chemotherapy followed by surgery compared with surgery alone for localized esophageal cancer. N Engl J Med 1998; 339: pp. 1979-1984.
29. Hulscher J.B., van Sandick J.W., de Boer A.G., et. al.: Extended transthoracic resection compared with limited transhiatal resection for adenocarcinoma of the esophagus. N Engl J Med 2002; 347: pp. 1662-1669.
30. Hulscher J.B., Tijssen J.G., Obertop H., et. al.: Transthoracic versus transhiatal resection for carcinoma of the esophagus: a meta-analysis. Ann Thorac Surg 2001; 72: pp. 306-313.
31. Mazhar D., Ngan S., Waxman J.: Improving outcomes in early prostate cancer: part II—neoadjuvant treatment. BJU Int 2006; 98: pp. 731-734.
32. Mazhar D., Ngan S., Waxman J.: Improving outcomes in early prostate cancer: Part I—adjuvant treatment. BJU Int 2006; 98: pp. 725-730.
33. Pisansky T.M.: External-beam radiotherapy for localized prostate cancer. N Engl J Med 2006; 355: pp. 1583-1591.
34. Engelbrecht M.R., Jager G.J., Laheij R.J., et. al.: Local staging of prostate cancer using magnetic resonance imaging: a meta-analysis. Eur Radiol 2002; 12: pp. 2294-2302.
35. van Westreenen H.L., Westerterp M., Bossuyt P.M., et. al.: Systematic review of the staging performance of 18F-fluorodeoxyglucose positron emission tomography in esophageal cancer. J Clin Oncol 2004; 22: pp. 3805-3812.
36. Cerfolio R.J., Ojha B., Bryant A.S., et. al.: The accuracy of integrated PET-CT compared with dedicated PET alone for the staging of patients with nonsmall cell lung cancer. Ann Thorac Surg 2004; 78: pp. 1017-1023.