
Rationale and Objectives
Early detection of lung cancer can be problematic. Although current imaging methods can identify lung cancers, they are limited in the size of detectable nodules. There is also lack of evidence that these methods can correctly classify nodules <7 mm as malignant because lung cancer can be mimicked in appearance by benign lesions that lower specificity. Therefore, there is a need for enhanced sensitivity/specificity of detection for small lung cancers.
Materials and Methods
We have developed a nanosized (∼100 nm) immunoliposome complex for delivery of molecular medicines to tumors. In this complex, an anti-transferrin receptor single-chain antibody fragment (TfRscFv) decorates the surface of a cationic liposome encapsulating the payload. We have previously shown that this systemically administered complex (scL) selectively targets, and efficiently delivers its payload into, tumor cells. We have also encapsulated the magnetic resonance imaging (MRI) contrast agent gadopentetate dimeglumine (“gad-d”) within this complex, resulting in increased resolution and image intensity in a mouse model of primary cancer. Here we examine the ability of the scL-gad-d complex to increase the sensitivity of detection of lung metastases.
Results
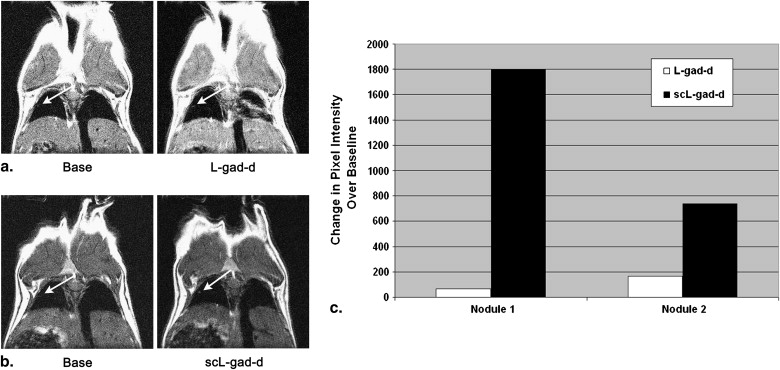
These MRI studies show that the scL-gad-d nanocomplex is able to improve detection, and increase enhancement of, small lung cancers (400 μm and as small as 100 μm) compared to that of uncomplexed gad-d.
Conclusions
Because of its tumor targeting specificity, deliver of an MRI contrast agent via this nanocomplex has potential for use as an agent that can identify small lung cancers, thus improving early detection and possibly increasing survival.
Lung cancer is the second leading cause of cancer and the leading cause of cancer deaths for both men and women, with the number of cases in women on the rise. The American Cancer Society estimates that in 2008 there will be more than 215,000 new cases of lung cancer in the United States with more than 161,000 related deaths . The ratio of deaths to new cases (0.75) is significantly higher than the 0.4 ratio for cancer in general, indicating the dire prognosis of individuals who develop lung cancer and the importance of new approaches for early detection and diagnosis.
Currently the principal methods used for early identification of primary lung carcinoma are chest radiography and chest computed tomography (CT). Although both methods are somewhat effective in identifying curable lung cancer , they possess a major drawback in that they commonly result in false positives (ie, nodular areas that could indicate lung cancer, but are, in fact, scars or focal inflammatory/infectious processes) . For small lung nodules, this is a frequent occurrence and a serious problem. Although there are various diagnostic methods to distinguish between true malignancies and false positives , for small lung nodules, the primary method is to obtain serial images over time to assess growth, a very inefficient and costly process. Moreover, a recent report has associated the higher radiation dose from CT with an increased risk of cancer . Consequently, the need for multiple CT scans to confirm diagnosis may have a negative impact. There is also a risk entailed by delay in diagnosis. Cases with delays of 1 year have been associated with a change in stage (although delays of less than 6 months have not). This change in stage implies a worse prognosis . Furthermore, some small non–small-cell lung cancers can metastasize early .
Get Radiology Tree app to read full this article<
Get Radiology Tree app to read full this article<
Get Radiology Tree app to read full this article<
Methods
Get Radiology Tree app to read full this article<
Cell Lines
Get Radiology Tree app to read full this article<
Complex Formation
Get Radiology Tree app to read full this article<
Animal Models
Get Radiology Tree app to read full this article<
Get Radiology Tree app to read full this article<
Animal Imaging
Get Radiology Tree app to read full this article<
Get Radiology Tree app to read full this article<
Get Radiology Tree app to read full this article<
Statistics
Get Radiology Tree app to read full this article<
Results
Enhanced Contrast in a Nodule 16 Pixels in Diameter with scL-gad-d
Get Radiology Tree app to read full this article<
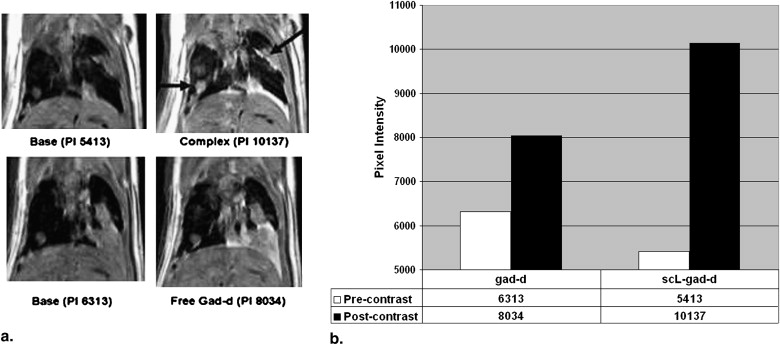
Get Radiology Tree app to read full this article<
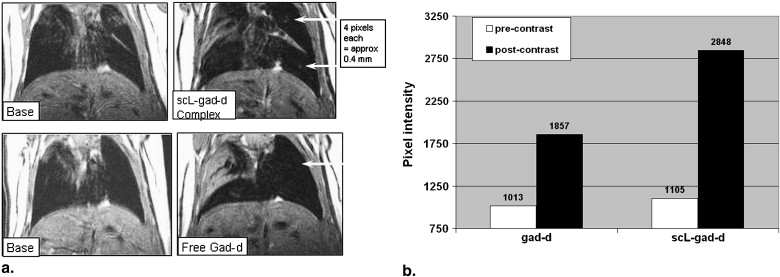
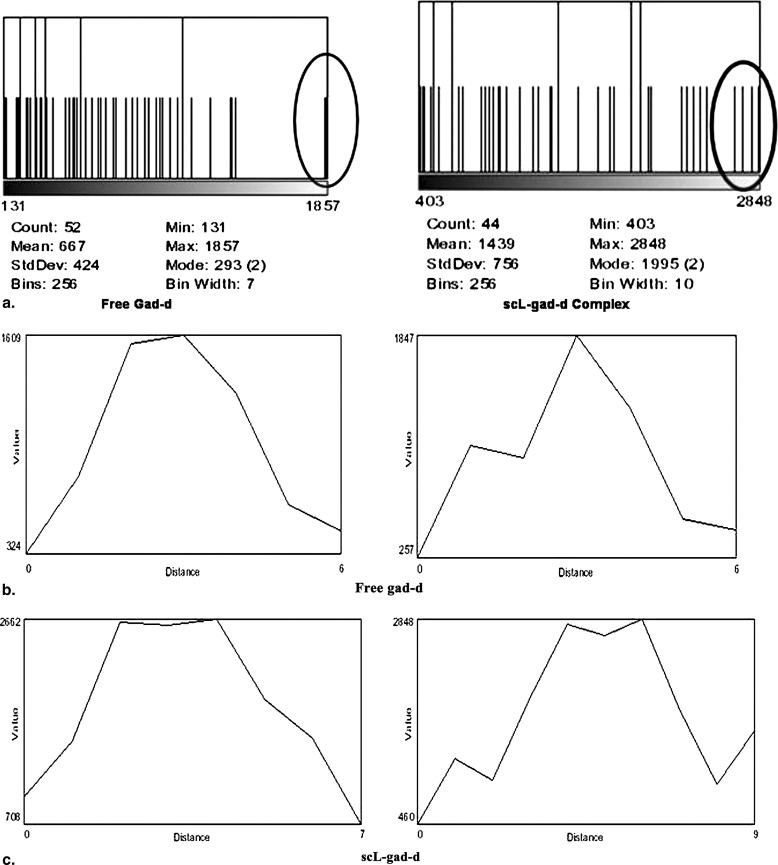
Enhanced Contrast in Nodules 4 Pixels in Diameter with scL-gad-d
Get Radiology Tree app to read full this article<
Get Radiology Tree app to read full this article<
Get Radiology Tree app to read full this article<
Get Radiology Tree app to read full this article<
Get Radiology Tree app to read full this article<
Get Radiology Tree app to read full this article<
Get Radiology Tree app to read full this article<
Get Radiology Tree app to read full this article<
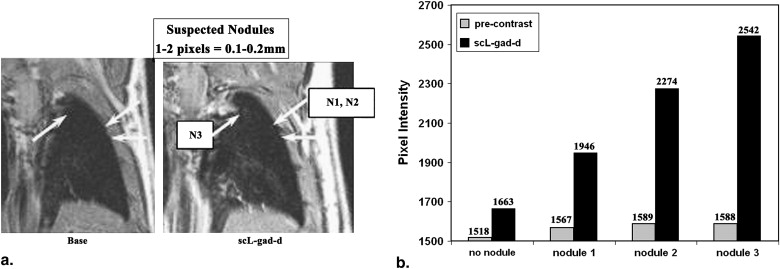
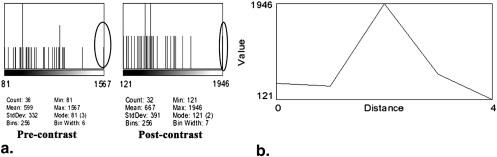
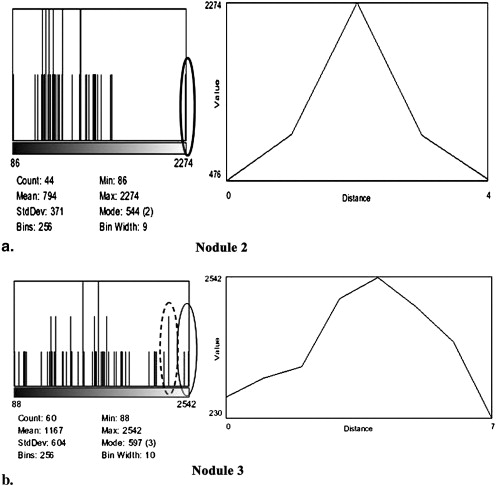
Visualization of Nodules 1–2 Pixels in Diameter by scL-gad-d
Get Radiology Tree app to read full this article<
Get Radiology Tree app to read full this article<
Get Radiology Tree app to read full this article<
Get Radiology Tree app to read full this article<
Get Radiology Tree app to read full this article<
Get Radiology Tree app to read full this article<
Get Radiology Tree app to read full this article<
Get Radiology Tree app to read full this article<
Table 1
Pixel Intensities of the Three Nodules Shown in Figure 4 a
Mean SD Maximum Z-Score Expected Pixel Frequency at and above this Z-Score Nodule 1 Pre-contrast 599 332 1567 2.92 4 per 1000 Post–scL-gad-d 667 391 1946 3.27 5 per 10,000 Nodule 2 Pre-contrast 591 299 1589 3.34 4 per 10,000 Post–scL-gad-d 665 339 2274 4.75 1 per 100,000 Nodule 3 Pre-contrast 566 278 1588 3.68 1 per 10,000 Post–scL-gad-d 981 515 2542 3.03 1 per 1000
gad-d, gadopentetate dimeglumine; scL, immunoliposome complex; SD standard deviation.
The Z-scores show that the maximum pixel intensity in the location of the visualized nodules is always at least 2.9 SD above the mean, indicating that the presumed 1–4 pixel nodules are not likely to be due to image noise.
Get Radiology Tree app to read full this article<
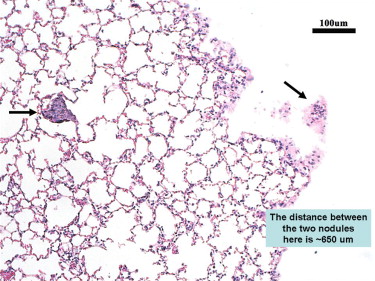
Histology Studies
Get Radiology Tree app to read full this article<
Get Radiology Tree app to read full this article<
Comparison between Targeted and Untargeted Complex
Get Radiology Tree app to read full this article<
Get Radiology Tree app to read full this article<
Discussion
Get Radiology Tree app to read full this article<
Get Radiology Tree app to read full this article<
Get Radiology Tree app to read full this article<
Get Radiology Tree app to read full this article<
Get Radiology Tree app to read full this article<
Get Radiology Tree app to read full this article<
Get Radiology Tree app to read full this article<
Get Radiology Tree app to read full this article<
Get Radiology Tree app to read full this article<
Get Radiology Tree app to read full this article<
Get Radiology Tree app to read full this article<
Conclusions
Get Radiology Tree app to read full this article<
Acknowledgments
Get Radiology Tree app to read full this article<
Get Radiology Tree app to read full this article<
References
1. American Cancer Society. Cancer facts and figures 2008. Available online at: http://www.cancer.org .
2. Gohagan J., Marcus P., Fagerstrom R., et. al.: Writing Committee LSSRG. Baseline findings of a randomized feasibility trial of lung cancer screening with spiral CT scan vs chest radiograph: the Lung Screening Study of the National Cancer Institute. Chest 2004; 126: pp. 114-121.
3. Gohagan J.K., Marcus P.M., Fagerstrom R.M., et. al.: Final results of the Lung Screening Study, a randomized feasibility study of spiral CT versus chest X-ray screening for lung cancer. Lung Cancer 2005; 47: pp. 9-15.
4. International Early Lung Cancer Action Program, Henschke C.I., Yankelevitz D.F., et. al.: Survival of patients with stage I lung cancer detected on CT screening. N Engl J Med 2006; 355: pp. 1763-1771.
5. Stitik F.P., Tockman M.S.: Radiographic screening in the early detection of lung cancer. Radiol Clin N Am 1978; 16: pp. 347-366.
6. Stitik F.P., Tockman M.S., Khouri N.: Chest radiology.Miller A.B.Screening for cancer.1985.Academic PressNew York:pp. 163-191.
7. Swensen S.J., Jett J.R., Hartman T.E., et. al.: Lung cancer screening with CT: Mayo Clinic experience. Radiology 2003; 226: pp. 756-761.
8. Swensen S.J., Jett J.R., Hartman T.E., et. al.: CT screening for lung cancer: five-year prospective experience. Radiology 2005; 235: pp. 259-265.
9. Pinsky P.F., Marcus P.M., Kramer B.S., et. al.: Diagnostic procedures after a positive spiral computed tomography lung carcinoma screen. Cancer 2005; 103: pp. 157-163.
10. Brenner D.J., Hall E.J.: Computed tomography: an increasing source of radiation exposure. N Engl J Med 2007; 357: pp. 2277-2284.
11. Bozcuk H., Martin C.: Does treatment delay affect survival in non-small cell lung cancer? A retrospective analysis from a single UK centre. Lung Cancer 2001; 34: pp. 243-252.
12. Pita-Fernandez S., Montero-Martinez C., Pertega-Diaz S., et. al.: Relationship between delayed diagnosis and the degree of invasion and survival in lung cancer. J Clin Epidemiol 2003; 56: pp. 820-825.
13. Quarterman R.L., McMillan A., Ratcliffe M.B., et. al.: Effect of preoperative delay on prognosis for patients with early stage non-small cell lung cancer. [see comment] J Thorac Cardiovasc Surg 2003; 125: pp. 108-113.
14. Kashiwabara K., Koshi S., Itonaga K., et. al.: Outcome in patients with lung cancer found on lung cancer mass screening roentgenograms, but who did not subsequently consult a doctor. Lung Cancer 2003; 40: pp. 67-72.
15. Yoshimoto A., Tsuji H., Takazakura E., et. al.: Reasons for the delays in the definitive diagnosis of lung cancer for more than one year from the recognition of abnormal chest shadows. Intern Med 2002; 41: pp. 95-102.
16. Aragoneses F.G., Moreno N., Leon P., et. al.: Influence of delays on survival in the surgical treatment of bronchogenic carcinoma. Lung Cancer 2002; 36: pp. 59-63.
17. Myrdal G., Lambe M., Hillerdal G., et. al.: Effect of delays on prognosis in patients with non-small cell lung cancer. Thorax 2004; 59: pp. 45-49.
18. Tammemagi M., Freedman M.T., Oken M., et. al.: Factors associated with human small aggressive non-small cell lung cancer. Cancer Epidemiol Biomark Prevent 2007; 16: pp. 2082-2089.
19. Bach P.B., Jett J.R., Pastorino U., et. al.: Computed tomography screening and lung cancer outcomes. JAMA 2007; 297: pp. 953-961.
20. Pirollo K.F., Dagata J., Wang P., et. al.: A tumor-targeted nanodelivery system to improve early MRI detection of cancer. Mole Imaging 2006; 5: pp. 41-52.
21. Xu L., Pirollo K., Tang W.-H., et. al.: Transferrin-liposome-mediated systemic p53 gene therapy in combination with radiation results in regression of human head and neck cancer xenografts. Human Gene Ther 1999; 10: pp. 2941-2952.
22. Xu L., Pirollo K., Rait A., et. al.: Systemic p53 gene therapy in combination with radiation results in human tumor regression. Tumor Target 1999; 4: pp. 92-104.
23. Xu L., Tang W., Huang C., et. al.: Anti-transferrin receptor ScFv-targeted immunolipoplexes for systemic cancer gene therapy. Mole Med 2001; 10: pp. 723-734.
24. Xu L., Huang C.-C., Huang W.-Q., et. al.: Systemic tumor-targeted gene delivery by anti-transferrin receptor scFv-immunoliposomes. Mole Cancer Ther 2002; 1: pp. 337-346.
25. Rait A.S., Pirollo K.F., Xiang L., et. al.: Tumor-targeting, systemically delivered antisense HER-2 chemosensitizes human breast cancer xenografts irrespective of HER-2 levels. Mol Med 2002; 8: pp. 475-486.
26. Rait A.S., Pirollo K.F., Ulick D., et. al.: HER-2-targeted antisense oligonucleotide results in sensitization of head and neck cancer cells to chemotherapeutic agents. Ann N Y Acad Sci 2003; 1002: pp. 78-89.
27. Pirollo K.F., Zon G., Rait A., et. al.: Tumor-targeting nanoimmunoliposome complex for short interfering RNA delivery. Human Gene Ther 2006; 17: pp. 117-124.
28. Pirollo K.F., Rait A., Zhou Q., et. al.: Materializing the potential of small interfering RNA via a tumor-targeting nanodelivery system. Cancer Res 2007; 67: pp. 2938-2943.
29. Yu W., Pirollo K.F., Yu B., et. al.: Enhanced transfection efficiency of a systemically delivered tumor-targeting immunolipoplex by inclusion of a pH-sensitive histidylated oligolysine peptide. Nucl Acids Res 2004; 32: pp. e48.
30. Keer H.N., Kozlowski J.M., Tsai Y.C., et. al.: Elevated transferrin receptor content in human prostate cancer cell lines assessed in vitro and in vivo. J Urol 1990; 143: pp. 381-385.
31. Rossi M.C., Zetter B.R.: Selective stimulation of prostatic carcinoma cell proliferation by transferrin. Proc Natl Acad Sci U S A 1992; 89: pp. 6197-6201.
32. Elliott R.L., Elliott M.C., Wang F., et. al.: Breast carcinoma and the role of iron metabolism. A cytochemical, tissue culture, and ultrastructural study. Ann N Y Acad Sci 1993; 698: pp. 159-166.
33. Thorstensen K., Romslo I.: The transferrin receptor: its diagnostic value and its potential as therapeutic target. Scand J Clin Lab Investig Suppl 1993; 215: pp. 113-120.
34. Miyamoto T., Tanaka N., Eishi Y., et. al.: Transferrin receptor in oral tumors. Int J Oral Maxillofac Surg 1994; 23: pp. 430-433.
35. Whitney J.F., Clark J.M., Griffin T.W., et. al.: Transferrin receptor expression in nonsmall cell lung cancer. Histopathol Clin Correlates 1995; 76: pp. 20-25.
36. Chakrabarty A., Hillman G.G., Maughan R.L., et. al.: Influence of tumor site on the therapy of murine kidney cancer. Anticancer Res 1994; 14: pp. 373-378.
37. Salup R.R., Herberman R.B., Chirigos M.A., et. al.: Therapy of peritoneal murine cancer with biological response modifiers. J Immunopharmacol 1985; 7: pp. 417-436.
38. Oken M.M., Marcus P.M., Hu P., et. al.: Baseline chest radiograph for lung cancer detection in the randomized Prostate, Lung, Colorectal and Ovarian Cancer Screening Trial. J Natl Cancer Inst 2005; 97: pp. 1832-1839.
39. Centers for Disease Control and Prevention (CDC) : Recent trends in mortality rates for four major cancers, by sex and race/ethnicity—United States, 1990–1998. MMWR Morbid Mortal Wkly Rep 2002; 51: pp. 49-53.
40. Mountain C.F.: Revisions in the International System for Staging Lung Cancer. Chest 1997; 111: pp. 1710-1717.
41. Swensen S.J.: Functional CT: lung nodule evaluation. Radiographics 2000; 20: pp. 1178-1181.
42. Swensen S.J., Viggiano R.W., Midthun D.E., et. al.: Lung nodule enhancement at CT: multicenter study. Radiology 2000; 214: pp. 73-80.
43. Swensen S.J., Brown L.R., Colby T.V., et. al.: Pulmonary nodules: CT evaluation of enhancement with iodinated contrast material. Radiology 1995; 194: pp. 393-398.
44. Swensen S.J., Brown L.R., Colby T.V., et. al.: Lung nodule enhancement at CT: prospective findings. Radiology 1996; 201: pp. 447-455.
45. Jeong Y.J., Lee K.S., Jeong S.Y., et. al.: Solitary pulmonary nodule: characterization with combined wash-in and washout features at dynamic multi-detector row CT. Radiology 2005; 237: pp. 675-683.
46. Zhang M., Kono M.: Solitary pulmonary nodules: evaluation of blood flow patterns with dynamic CT. Radiology 1997; 205: pp. 471-478.
47. Maki D.D., Gefter W.B., Alavi A.: Recent advances in pulmonary imaging. Chest 1999; 116: pp. 1388-1402.
48. Page D.: The strange courtship of astronomy and mammography. Digital Imaging Mag December 1995;