
Rationale and Objectives
The purpose of the present study was to evaluate a near-infrared (NIR) laser breast imaging system (Computed Tomography Laser Mammography [CTLM]) as an adjunct to mammography by means of receiver-operating characteristic (ROC) analysis. The NIR technique used in this study is based on the absorption of NIR light by hemoglobin. Malignant tumors can be detected by imaging their neovascularization.
Materials and Methods
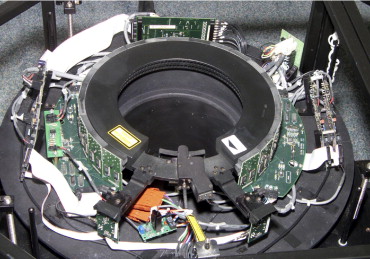
Eighty-two patients were examined by both CTLM and mammography. Seventy-nine of the 82 patients underwent biopsies, and three patients had 2-year follow up. Three-dimensional scans were acquired with an NIR laser computed tomographic scanner (the CTLM system) at a slice thickness of 4 mm. Mammograms were analyzed alone and together with CTLM images.
Results
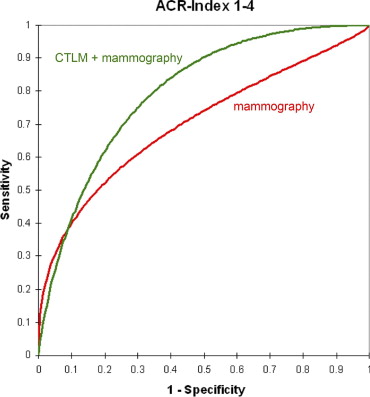
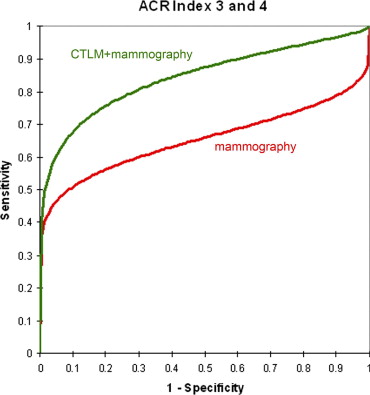
Histology revealed 37 benign and 42 malignant lesions. For the combination of mammography and CTLM, the area under the ROC curve was significantly larger than for mammography alone. In addition, it was shown that the difference in area under the ROC curve between the combination of both methods and mammography alone was considerably larger for dense breasts than for radiolucent breasts, although these differences were not statistically significant.
Conclusion
CTLM, used as an adjunct, may serve as a feasible tool to improve the diagnostic capabilities of mammography.
Breast cancer is the most frequent malignancy in women worldwide ( ). Statistically, in the United States, one in seven women will develop breast cancer during her lifetime ( ). Diagnostic mammography has been shown to have an average sensitivity for the detection of cancer of 75%, and 60 to 80 of every 100 biopsies are negative for cancer. In specific cases, magnetic resonance imaging (MRI) can solve some of these problems, increasing sensitivity to about 95%, but with a presently significantly lower specificity than mammography ( ). In addition, MRI examinations are still very expensive. For these reasons, a different approach to breast imaging is desirable.
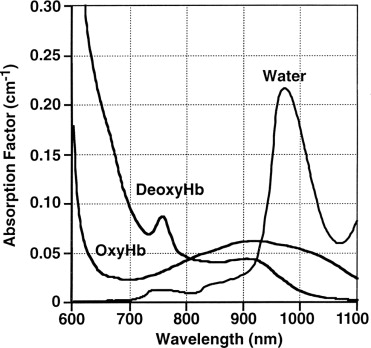
In theory, optical methods based on near-infrared (NIR) imaging have high potential to become valuable diagnostic tools in breast imaging ( ). There are several reasons for this. First, the breast is fully accessible for imaging with optical methods because of its surface location, relatively small size, and absence of bony structures. Second, at 800 nm, it is possible to exploit the difference in absorption between total hemoglobin and water or fat as an intrinsic contrast. Hemoglobin will then act as a natural contrast medium, and computed laser tomography of the breast will therefore produce a “hemoglobin angiogram,” revealing the normal vascular structures of the breast. In addition, because all tumors require new blood vessels to survive and grow (neoangiogenesis), NIR tomographic imaging can detect tumors within the breast. Third, no ionizing radiation is needed, and the majority of optical systems work without compression, factors that increase its acceptance by patients. Finally, the method is rather inexpensive and easily deployed.
Get Radiology Tree app to read full this article<
Materials and methods
Get Radiology Tree app to read full this article<
Technique
Get Radiology Tree app to read full this article<
Get Radiology Tree app to read full this article<
Get Radiology Tree app to read full this article<
Get Radiology Tree app to read full this article<
Get Radiology Tree app to read full this article<
Get Radiology Tree app to read full this article<
Get Radiology Tree app to read full this article<
Get Radiology Tree app to read full this article<
Patients
Get Radiology Tree app to read full this article<
Table 1
Seventy-nine of 82 Patients Included in This Study Had Biopsies on the Basis of Findings on Mammography, Ultrasound, Magnetic Resonance Imaging, Physical Examination, or a Combination of These Methods; Three Patients with Benign Findings Were Included on the Basis of 2-Year Follow-up
Basis for Biopsy Number of Patients Mammography 47 Ultrasound 5 Mammography and ultrasound 7 Physical examination and mammography 10 MRI 5 Physical examination and ultrasound 2 Physical examination and MRI 2 Mammography and MRI 1
MRI, magnetic resonance imaging.
Get Radiology Tree app to read full this article<
Get Radiology Tree app to read full this article<
Analysis
Get Radiology Tree app to read full this article<
Get Radiology Tree app to read full this article<
Get Radiology Tree app to read full this article<
Reading Mammograms and CTLM Studies
Get Radiology Tree app to read full this article<
Statistical Analysis
Get Radiology Tree app to read full this article<
Results
Histology
Get Radiology Tree app to read full this article<
Table 2
Histologic Findings in the 79 Patients Who Were Biopsied; There Were 42 Malignant Cases in Total
Finding Number of Lesions Size (mm), Mean ± SD Malignant findings 16.7 ± 14.1 Invasive ductal carcinoma 29 Invasive lobular carcinoma 4 19.3 ± 7.0 Mucinous carcinoma 1 10 High-grade DCIS 6 22.4 ± 23.9 Low-grade DCIS 2 36.5 ± 47.4 Benign findings Fibrocystic changes 12 Fibrosis 9 Fibroadenoma 7 17.0 ± 11.0 Benign calcifications 3 Papilloma 2 Atypical ductal hyperplasia 2 Hamartoma 1 Chronic mastitis 1 Follow-up 3
DCIS, ductal carcinoma in situ; SD, standard deviation.
Get Radiology Tree app to read full this article<
Mammography
Get Radiology Tree app to read full this article<
Statistical Analysis
Get Radiology Tree app to read full this article<
Get Radiology Tree app to read full this article<
Get Radiology Tree app to read full this article<
Get Radiology Tree app to read full this article<
Get Radiology Tree app to read full this article<
![Figure 5, The difference in the area under the receiver-operating characteristic curve between mammography and the combination of Computed Tomography Laser Mammography (CTLM) and mammography was not statistically significant for radiolucent breasts (American College of Radiology [ACR] Breast Imaging Reporting and Data System density 1 or 2).](https://storage.googleapis.com/dl.dentistrykey.com/clinical/NearinfraredLaserComputedTomographyoftheBreast/4_1s20S1076633208004558.jpg)
Get Radiology Tree app to read full this article<
Get Radiology Tree app to read full this article<
Cases
Get Radiology Tree app to read full this article<
Case 1: Ductal Carcinoma in Situ and Invasive Ductal Carcinoma
Get Radiology Tree app to read full this article<
Get Radiology Tree app to read full this article<
Case 2: Invasive Ductal Carcinoma
Get Radiology Tree app to read full this article<
Get Radiology Tree app to read full this article<
Case 3: Cystosarcoma Phyllodes and Fibroadenoma
Get Radiology Tree app to read full this article<
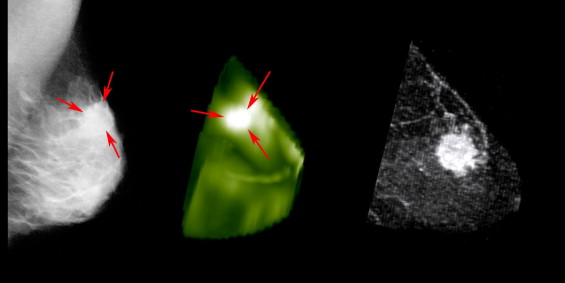
![Figure 8, Comparison of near-infrared mammography (Computer Tomography Laser Mammography [CTLM], three-dimensional surface rendering) (left) , magnetic resonance imaging (MRI; T 2 -weighted) (center) , and the operation specimen (right) . Both CTLM and MRI showed the larger mass that was located medially (M). The smaller mass, located laterally (L), was seen only on MRI and did not appear on near-infrared mammography. Histologic examination revealed a malignant phyllodes tumor as the larger mass and a fibroadenoma as the smaller mass. The structures at the base of the breast in the near-infrared image are probably caused by large vessels and dense glandular tissue.](https://storage.googleapis.com/dl.dentistrykey.com/clinical/NearinfraredLaserComputedTomographyoftheBreast/7_1s20S1076633208004558.jpg)
Get Radiology Tree app to read full this article<
Get Radiology Tree app to read full this article<
Get Radiology Tree app to read full this article<
Discussion
Get Radiology Tree app to read full this article<
Get Radiology Tree app to read full this article<
Get Radiology Tree app to read full this article<
Get Radiology Tree app to read full this article<
Study Limitations
Get Radiology Tree app to read full this article<
Get Radiology Tree app to read full this article<
Get Radiology Tree app to read full this article<
Conclusion
Get Radiology Tree app to read full this article<
References
1. Parkin D.M., Fernandez L.M.: Use of statistics to assess the global burden of breast cancer. Breast J 2006; 12: pp. S70-S80.
2. Bray F., McCarron P., Parkin D.M.: The changing global patterns of female breast cancer incidence and mortality. Breast Cancer Res 2004; 6: pp. 229-239.
3. Parkin D.M., Bray F., Ferlay J., Pisani P.: Global cancer statistics, 2002. CA Cancer J Clin 2005; 55: pp. 74-108.
4. Smigal C., Jemal A., Ward E., et. al.: Trends in breast cancer by race and ethnicity: update 2006. CA Cancer J Clin 2006; 56: pp. 168-183.
5. Jemal A., Siegel R., Ward E., et. al.: Cancer statistics, 2008. CA Cancer J Clin 2008; 58: pp. 71-96.
6. Saslow D., Boetes C., Burke W., et. al.: American Cancer Society guidelines for breast screening with MRI as an adjunct to mammography. CA Cancer J Clin 2007; 57: pp. 75-89.
7. Gibson A.P., Hebden J.C., Arridge S.R.: Recent advances in diffuse optical imaging. Phys Med Biol 2005; 50: pp. R1-R43.
8. Hielscher A.H.: Optical tomographic imaging of small animals. Curr Opin Biotechnol 2005; 16: pp. 79-88.
9. Ntziachristos V., Chance B.: Probing physiology and molecular function using optical imaging: applications to breast cancer. Breast Cancer Res 2001; 3: pp. 41-46.
10. Drexler B., Davis J.L., Schofield G.: Diaphanography in the diagnosis of breast cancer. Radiology 1985; 157: pp. 41-44.
11. Brenner R.J.: X-ray mammography and diaphanography in screening for breast cancer. J Reprod Med 1982; 27: pp. 679-684.
12. Grosenick D., Moesta K.T., Moller M., et. al.: Time-domain scanning optical mammography: I. Phys Med Biol 2005; 50: pp. 2429-2449.
13. Taroni P., Torricelli A., Spinelli L., et. al.: Time-resolved optical mammography between 637 and 985 nm: clinical study on the detection and identification of breast lesions. Phys Med Biol 2005; 50: pp. 2469-2488.
14. Srinivasan S., Pogue B.W., Jiang S., et. al.: In vivo hemoglobin and water concentrations, oxygen saturation, and scattering estimates from near-infrared breast tomography using spectral reconstruction. Acad Radiol 2006; 13: pp. 195-202.
15. Zhou C., Choe R., Shah N., et. al.: Diffuse optical monitoring of blood flow and oxygenation in human breast cancer during early stages of neoadjuvant chemotherapy. J Biomed Opt 2007; 12: pp. 051903.
16. Ntziachristos V., Yodh A.G., Schnall M., Chance B.: Concurrent MRI and diffuse optical tomography of breast after indocyanine green enhancement. Proc Natl Acad Sci U S A 2000; 97: pp. 2767-2772.
17. Corlu A., Choe R., Durduran T., et. al.: Diffuse optical tomography with spectral constraints and wavelength optimization. Appl Opt 2005; 44: pp. 2082-2093.
18. Alacam B., Yazici B., Chance B., Nioka S.: Characterization of breast tumors with NIR methods using optical indices. Conf Proc IEEE Eng Med Biol Soc 2007; 1: pp. 5186-5189.
19. Alacam B., Yazici B., Intes X., Nioka S., Chance B.: Pharmacokinetic-rate images of indocyanine green for breast tumors using near-infrared optical methods. Phys Med Biol 2008; 53: pp. 837-859.
20. O’Leary M.A.: Imaging with diffuse photon density waves.1996.University of Pennsylvania PressPhiladelphia, PA
21. Chance B.: Near-infrared images using continuous, phase-modulated, and pulsed light with quantitation of blood and blood oxygenation. Ann N Y Acad Sci 1998; 838: pp. 29-45.
22. Torricelli A., Spinelli L., Pifferi A., Taroni P., Cubeddu R., Danesini G.: Use of a nonlinear perturbation approach for in vivo breast lesion characterization by multiwavelength time-resolved optical mammography. Opt Express 2003; 11: pp. 853-867.
23. Nioka S., Chance B.: NIR spectroscopic detection of breast cancer. Technol Cancer Res Treat 2005; 4: pp. 497-512.
24. Star W.M.: Diffusion theory of light transport.Welch A.J.van Gemert M.J.C.Optical-thermal response of laser-irradiated tissue.1995.Plenum PressNew York:pp. 131-206.
25. Grable R.J., Rohler D.P., Sastry K.L.A.: Optical tomography breast imaging. Proc SPIE 1997; 2979: pp. 197-210.
26. Rohler DP, Sastry KLA, Ross S. Method for reconstructing the image of an object scanned with a laser imaging apparatus. US Patent #6,130,958; 2000.
27. Floery D., Helbich T.H., Riedl C.C., et. al.: Characterization of benign and malignant breast lesions with computed tomography laser mammography (CTLM): initial experience. Invest Radiol 2005; 40: pp. 328-335.
28. Grosenick D., Wabnitz H., Moesta K.T., et. al.: Concentration and oxygen saturation of haemoglobin of 50 breast tumours determined by time-domain optical mammography. Phys Med Biol 2004; 49: pp. 1165-1181.
29. Franceschini M.A., Moesta K.T., Fantini S., et. al.: Frequency-domain techniques enhance optical mammography: initial clinical results. Proc Natl Acad Sci U S A 1997; 94: pp. 6468-6473.
30. Pogue B.W., Poplack S.P., McBride T.O., et. al.: Quantitative hemoglobin tomography with diffuse near-infrared spectroscopy: pilot results in the breast. Radiology 2001; 218: pp. 261-266.
31. Shah N., Cerussi A., Eker C., et. al.: Noninvasive functional optical spectroscopy of human breast tissue. Proc Natl Acad Sci U S A 2001; 98: pp. 4420-4425.
32. Cerussi A.E., Berger A.J., Bevilacqua F., et. al.: Sources of absorption and scattering contrast for near-infrared optical mammography. Acad Radiol 2001; 8: pp. 211-218.
33. Weissleder R.: Molecular imaging in cancer. Science 2006; 312: pp. 1168-1171.
34. Intes X., Ripoll J., Chen Y., Nioka S., Yodh A.G., Chance B.: In vivo continuous-wave optical breast imaging enhanced with Indocyanine Green. Med Phys 2003; 30: pp. 1039-1047.
35. Boehm T., Hochmuth A., Malich A., Reichenbach J.R., Fleck M., Kaiser W.A.: Contrast-enhanced near-infrared laser mammography with a prototype breast scanner: feasibility study with tissue phantoms and preliminary results of imaging experimental tumors. Invest Radiol 2001; 36: pp. 573-581.
36. Tomandl B., Doinghaus K., Schulz-Wendtland R.: Laser mammography with near-infrared light. Rontgenpraxis 1995; 48: pp. 197-201.
37. Gotz L., Heywang-Kobrunner S.H., Schutz O., Siebold H.: Optical mammography in preoperative patients. Aktuelle Radiol 1998; 8: pp. 31-33.
38. Wells W.A., Daghlian C.P., Tosteson T.D., et. al.: Analysis of the microvasculature and tissue type ratios in normal vs. benign and malignant breast tissue. Anal Quant Cytol Histol 2004; 26: pp. 166-174.
39. Pisano E.D., Gatsonis C., Hendrick E., et. al.: Diagnostic performance of digital versus film mammography for breast-cancer screening. N Engl J Med 2005; 353: pp. 1773-1783.