
Rationale and Objectives
To evaluate the diagnostic performance of a neural network ensemble-based computer-aided diagnosis (CAD) scheme for classifying lung nodules on thin-section computed tomography (CT).
Materials and Methods
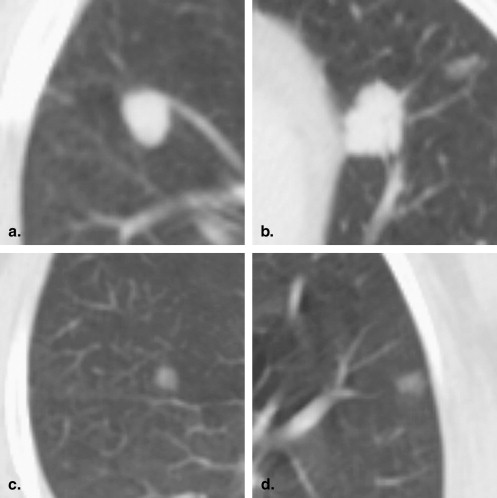
Thirty-two CT images that depicted 19 malignant nodules and 13 benign nodules were used. One of three possible classifications (probably benign, uncertain, and probably malignant) for each nodule was determined by using a neural network ensemble-based CAD scheme. The images were presented to three senior radiologists (each with more than 10 years of thoracic radiology experience) who were asked to determine the classification for each nodule blindly. The radiologists made their diagnostic decisions solely based on images and excluded any external data. The performance of the CAD scheme and of the radiologists was evaluated with receiver operating characteristic (ROC) analysis and agreement analysis.
Results
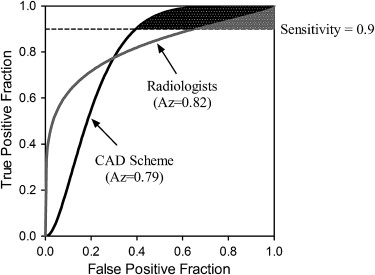
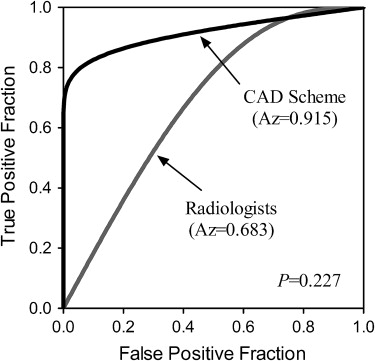
Areas under the ROC curve (Az values) for the CAD scheme and the radiologist group were 0.79 and 0.82, respectively, and the partial areas under the ROC curves at a range of sensitivity values greater than or equal to 90% were 0.051 and 0.020 ( P = .203), respectively. The weighted Kappa coefficients between the CAD scheme and each radiologist were 0.657, 0.431, and 0.606, respectively. For the diagnosis of the 11 small nodules (with diameters not greater than 10 mm), areas under the ROC curves of the CAD scheme and the radiologist group were 0.915 and 0.683 ( P = .227), respectively.
Conclusions
The diagnostic performance of the neural network ensemble-based CAD scheme is similar to that of senior radiologists for classifying lung nodules on thin-section CT. Furthermore, the CAD scheme has certain advantages in diagnosing small lung nodules.
Several investigations have shown that early detection of lung cancer may allow more timely therapeutic intervention and thus a more favorable prognosis for the patient . At present, computed tomography (CT) imaging is regarded as the most effective means for the early detection of asymptomatic lung cancer. Although CT imaging technology has provided increasingly clear images, it remains very difficult for radiologists to distinguish benign from malignant lesions, and the interpretation of a large number of CT images is a time-consuming task for radiologists. Therefore, a number of investigators are developing computer-aided diagnostic (CAD) schemes to facilitate the differentiation between benign and malignant lung nodules on CT images . For development of a CAD scheme, it is necessary to develop efficient computer algorithms. These computer algorithms are tested typically by means of the leave-one-out technique. Shah et al calculated 75 features that measured the attenuation, shape, and texture of the nodule in CT images. These features were then input into a feature selection step and four different classifiers (linear discriminant analysis, quadratic discriminant, logistic regression, and recursive partitioning) to determine if the diagnosis could be predicted from the feature vector. A leave-one-out testing resulted in the areas under the receiver operating characteristic (ROC) curve of range from 0.68 to 0.92. Silva et al applied Moran’s index and Geary’s coefficient in linear discriminators to the diagnosis of lung nodules as malignant or benign in computerized tomography images. A leave-one-out procedure was used to provide a less biased estimate of the classifiers’ performance. The two analyzed functions and its combinations provided more than 90% of accuracy and an area under ROC curve above 0.85, indicating a promising ability to discriminate between the benign and malignant nodules.
The basic concept of a CAD scheme is to provide a computer output to assist a radiologist’s image readings. Therefore, for the development of a successful CAD scheme, it is necessary not only to develop computer algorithms, but also to investigate how useful the computer output would be for radiologists in making their diagnosis and how to maximize the effect of the computer output on their diagnosis . Matsuki et al developed a computerized scheme using the artificial neural network (ANN) to distinguish benign from malignant nodules based on 7 clinical parameters and 16 radiologic findings. The average area under the ROC curve for all radiologists increased from 0.831 to 0.959 ( P < .001) with the use the ANN output, when differentiating 56 benign nodules from 99 malignant nodules on high-resolution CT, indicating that the diagnostic accuracy of radiologists could be improved by the computerized scheme. Awai et al assessed the diagnostic performance of ten board-certified radiologists with 8–26 years of experience and 9 radiology residents with 1–4 years of experience in distinguishing between benign and malignant nodules (33 nodules in all) first without and then with the CAD output. The mean areas under the ROC curve achieved without and with the CAD system were 0.910 and 0.944, respectively, for the 10 board-certified radiologists ( P = .190), and 0.768 and 0.901, respectively, for the 9 radiology residents ( P = .009). It could be concluded that the use of the CAD system significantly improved the diagnostic performance of radiology residents for assessment of the malignancy of pulmonary nodules; however, it did not improve that of board-certified radiologists.
Get Radiology Tree app to read full this article<
Get Radiology Tree app to read full this article<
Get Radiology Tree app to read full this article<
Materials and methods
Database
Get Radiology Tree app to read full this article<
Get Radiology Tree app to read full this article<
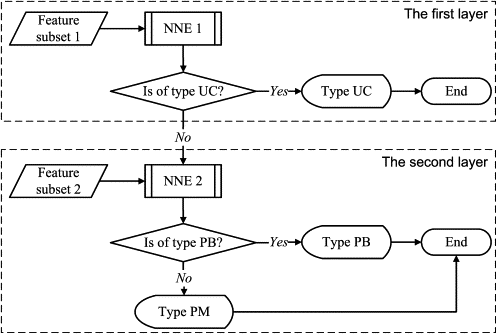
CAD Scheme for Diagnosis of Lung Nodules
Get Radiology Tree app to read full this article<
Get Radiology Tree app to read full this article<
Get Radiology Tree app to read full this article<
Get Radiology Tree app to read full this article<
Get Radiology Tree app to read full this article<
Get Radiology Tree app to read full this article<
Observer Performance Study
Get Radiology Tree app to read full this article<
Data Analysis
Get Radiology Tree app to read full this article<
Results
Training Performance of the CAD Scheme
Get Radiology Tree app to read full this article<
Diagnostic Accuracy of the CAD Scheme
Get Radiology Tree app to read full this article<
Table 1
Diagnosis Results for Radiologists and the CAD Scheme ( n )
Radiologist A Radiologist B Radiologist C CAD Scheme Pathology Result PB UC PM PB UC PM PB UC PM PB UC PM Benign (13) 7 4 2 7 2 4 6 4 3 7 2 4 Malignant (19) 3 3 13 2 3 14 3 0 16 1 3 15 Total (32) 10 7 15 9 5 18 9 4 19 8 5 19
CAD, computer-aided diagnosis; PB, probably benign; UC, uncertain; PM, probably malignant.
For the CAD scheme, 10 nodules had been misclassified, that is, four benign nodules were determined to be probably malignant nodules and two were uncertain; one malignant nodule was determined to be a probably benign nodule and three were uncertain. These kinds of diagnosis results were considered to be inconsistencies with the pathology diagnosis.
Get Radiology Tree app to read full this article<
Get Radiology Tree app to read full this article<
Get Radiology Tree app to read full this article<
Get Radiology Tree app to read full this article<
Get Radiology Tree app to read full this article<
Get Radiology Tree app to read full this article<
Get Radiology Tree app to read full this article<
Agreement of Diagnosis Results between the CAD Scheme and Radiologists
Get Radiology Tree app to read full this article<
Table 2
Crosstabs of Agreement between the CAD Scheme and Radiologists ( n )
Radiologist A Radiologist B Radiologist C Radiologist Group CAD Scheme PB UC PM PB UC PM PB UC PM PB UC PM PB 6 2 0 4 1 3 5 2 1 6 1 1 UC 3 2 0 3 2 0 3 1 1 3 2 0 PM 1 3 15 2 2 15 1 1 17 1 2 16 Weighted Kappa 0.657 0.431 0.606 0.653
CAD, computer-aided diagnosis; PB, probably benign; UC, uncertain; PM, probably malignant.
Get Radiology Tree app to read full this article<
Get Radiology Tree app to read full this article<
Diagnosis Results for Special Nodules
Diagnosis for small nodules (diameter ≤10 mm)
Get Radiology Tree app to read full this article<
Table 3
Diagnosis Results for Small Nodules (Diameter ≤10 mm) for Radiologist Group and the CAD Scheme ( n )
Radiologist Group CAD Scheme Pathology Result PB UC PM PB UC PM Benign (7) 5 1 1 6 1 0 Malignant (4) 2 1 1 1 0 3 Total (11) 7 2 2 7 1 3
CAD, computer-aided diagnosis; PB, probably benign; UC, uncertain; PM, probably malignant.
Get Radiology Tree app to read full this article<
Diagnosis for metastases
Get Radiology Tree app to read full this article<
Get Radiology Tree app to read full this article<
Get Radiology Tree app to read full this article<
Discussion
Get Radiology Tree app to read full this article<
Get Radiology Tree app to read full this article<
Get Radiology Tree app to read full this article<
Get Radiology Tree app to read full this article<
Get Radiology Tree app to read full this article<
Acknowledgments
Get Radiology Tree app to read full this article<
Get Radiology Tree app to read full this article<
References
1. Flehinger B.J., Kimmel M., Melamed M.R.: The effect of surgical treatment on survival from early lung cancer: implication for screening. Chest 1992; 101: pp. 1013-1018.
2. Sobue T., Suzuki R., Matsuda M., et. al.: Survival for clinical stage I lung cancer not surgically treated. Cancer 1992; 69: pp. 685-692.
3. Mittinen O.S.: Screening for lung cancer. Radiol Clin N Am 2000; 38: pp. 479-496.
4. Matsuki Y., Nakamura K., Watanabe H., et. al.: Usefulness of an artificial neural network for differentiating benign from malignant pulmonary nodules on high resolution CT: evaluation with receiver operating characteristic analysis. Am J Roentgenol 2002; 178: pp. 657-663.
5. Shiraishi J., Abe H., Engelmann R., et. al.: Computer-aided diagnosis to distinguish benign from malignant solitary pulmonary nodules on radiographs: ROC analysis of radiologists’ performance—initial experience. Radiology 2003; 227: pp. 469-474.
6. Sluimer I.C., van Waes P.F., Viergever M.A., et. al.: Computer-aided diagnosis in high resolution CT of the lungs. Med Phys 2003; 30: pp. 3081-3090.
7. Aoyama M., Li Q., Katsuragawa S., et. al.: Computerized scheme for determination of the likelihood measure of malignancy for pulmonary nodules on low-dose CT images. Med Phys 2003; 30: pp. 387-394.
8. Li F., Aoyama M., Shiraishi J., et. al.: Radiologists’ performance for differentiating benign from malignant lung nodules on high-resolution CT using computer-estimated likelihood of malignancy. Am J Roentgenol 2004; 183: pp. 1209-1215.
9. Li Q., Li F., Suzuki K., et. al.: Computer-aided diagnosis in thoracic CT. Semin Ultrasound CT 2005; 26: pp. 357-363.
10. Shah S.K., McNitt-Gray M.F., Rogers S.R., et. al.: Computer-aided diagnosis of the solitary pulmonary nodule. Acad Radiol 2005; 12: pp. 570-575.
11. Suzuki K., Li F., Sone S., et. al.: Computer-aided diagnostic scheme for distinction between benign and malignant nodules in thoracic low-dose CT by use of massive training artificial neural network. IEEE T Med Imaging 2005; 24: pp. 1138-1150.
12. Shiraishi J., Abe H., Li F., et. al.: Computer-aided diagnosis for the detection and classification of lung cancers on chest radiographs: ROC analysis of radiologists’ performance. Acad Radiol 2006; 13: pp. 995-1003.
13. Awai K.: Pulmonary Nodules: estimation of malignancy at thin-section helical CT—effect of computer-aided diagnosis on performance of radiologists. Radiology 2006; 239: pp. 276-284.
14. Chen H., Wang X.H., Ma D.Q., et. al.: Neural network-based computer-aided diagnosis in distinguishing malignant from benign solitary pulmonary nodules by computed tomography. Chinese Med J-Peking 2007; 120: pp. 1211-1215.
15. Silva E.C., Silva A.C., Paiva A.C., et. al.: Diagnosis of lung nodule using Moran’s index and Geary’s coefficient in computerized tomography images. Pattern Anal Applic 2008; 11: pp. 89-99.
16. Yeh C., Lin C.L., Wu M.T., et. al.: A neural network-based diagnostic method for solitary pulmonary nodules. Neurocomputing 2008; 72: pp. 612-624.
17. Way T.W.: Computer-aided diagnosis of pulmonary nodules in thoracic computed tomography.2008.Doctoral Dissertation, University of Michigan 138–165
18. Way T.W., Sahiner B., Chan H.P., et. al.: Computer-aided diagnosis of pulmonary nodules on CT scans: improvement of classification performance with nodule surface features. Med Phys 2009; 36: pp. 3086-3098.
19. Doi K.: Current status and future potential of computer-aided diagnosis in medical imaging. Br J Radiol 2005; 78: pp. S3-S19.
20. Armato S.G., McLennan G., McNitt-Gray M.F., et. al.: Lung image database consortium: developing a resource for the medical imaging research community. Radiology 2004; 232: pp. 739-748.
21. National Biomedical Imaging Archive. Available at: https://imaging.nci.nih.gov/ncia Accessed May 21, 2009
22. Canny J.: A computational approach to edge detection. IEEE T Pattern Anal 1986; 8: pp. 679-698.
23. Giorgio G., Fabio R.: Design of effective neural network ensembles for image classification purposes. Image Vision Comput 2001; 19: pp. 699-707.
24. Lam L., Suen C.Y.: Application of majority voting to pattern recognition: an analysis of its behavior and performance. IEEE T Syst Man Cy A 1997; 27: pp. 553-568.
25. Partridge D.: Network generalization differences quantified. Neural Networks 1996; 9: pp. 263-271.
26. Asuncion A., Newman D.J.: UCI Machine Learning Repository. Available at: http://www.ics.uci.edu/∼mlearn/MLRepository.html Accessed July 21, 2008
27. Metz C.E., Herman B.A., Shen J.H.: Maximum likelihood estimation of receiver operating characteristic (ROC) curves from continuously-distributed data. Stat Med 1998; 17: pp. 1033-1053.
28. Pan X., Metz C.E.: The “proper” binormal model: parametric ROC curve estimation with degenerate data. Acad Radiol 1997; 4: pp. 380-389.
29. McClish D.K.: Analyzing a portion of the ROC curve. Med Decis Making 1989; 9: pp. 190-195.
30. Obuchowski N.A.: Receiver operating characteristic curves and their use in radiology. Radiology 2003; 229: pp. 3-8.
31. Jiang Y., Metz C.E., Nishikawa R.M.: A receiver operating characteristic partial area index for highly sensitive diagnostic tests. Radiology 1996; 201: pp. 745-750.
32. Daly L., Bourke G.J.: Interpretation and uses of medical statistics.5th ed.2000.Wiley-BlackwellHoboken, NJ 410
33. Das R., Turkoglu I., Sengur A.: Diagnosis of valvular heart disease through neural networks ensembles. Comput Meth Prog Bio 2009; 39: pp. 185-191.
34. Osowski S., Markiewicz T., Hoai L.T.: Recognition and classification system of arrhythmia using ensemble of neural networks. Measurement 2008; 41: pp. 610-617.
35. Daskalakis A., Kostopoulos S., Spyridonos P., et. al.: Design of a multi-classifier system for discriminating benign from malignant thyroid nodules using routinely H&E-stained cytological images. Comput Biol Med 2008; 38: pp. 196-203.
36. Zhou Z.H., Jiang Y., Yang Y.B., et. al.: Lung cancer cell identification based on artificial neural network ensembles. Artif Intell Med 2002; 24: pp. 25-36.
37. Shah S.K., McNitt-Gray M.F., De Zoysa K.R., et. al.: Solitary pulmonary nodule diagnosis on CT: results of an observer study. Acad Radiol 2005; 12: pp. 496-501.
38. Erasmus J.J., McAdams H.P., Connolly J.E.: Solitary pulmonary nodules. Part II. Evaluation of the indeterminate nodule. Radio Graphics 2000; 20: pp. 59-66.
39. Swensen S.J., Viggiano R.W., Midthun D.E., et. al.: Lung nodule enhancement at CT: multicenter study. Radiology 2000; 214: pp. 73-80.
40. Yi C.A., Lee K.S., Kim E.A., et. al.: Solitary pulmonary nodules: dynamic enhanced multi-detector row CT study and comparison with vascular endothelial growth factor and microvessel density. Radiology 2004; 233: pp. 191-199.
41. Jeong Y.J., Lee K.S., Jeong S.Y., et. al.: Solitary pulmonary nodule: characterization with combined washin and washout features at dynamic multi-detector row CT. Radiology 2005; 237: pp. 675-683.
42. Lowe V.J., Fletcher J.W., Gobar L., et. al.: Prospective investigation of positron emission tomography in lung nodules. J Clin Oncol 1998; 16: pp. 1075-1084.