
Rationale and Objectives
Magnetic resonance spectroscopy is a noninvasive imaging technique that allows for reliable assessment of microscopic changes in brain cytoarchitecture, neuronal injuries, and neurochemical changes resultant from traumatic insults. We aimed to evaluate the acute alteration of neurometabolites in complicated and uncomplicated mild traumatic brain injury (mTBI) patients in comparison to control subjects using proton magnetic resonance spectroscopy (1H magnetic resonance spectroscopy).
Material and Methods
Forty-eight subjects (23 complicated mTBI [cmTBI] patients, 12 uncomplicated mTBI [umTBI] patients, and 13 controls) underwent magnetic resonance imaging scan with additional single voxel spectroscopy sequence. Magnetic resonance imaging scans for patients were done at an average of 10 hours (standard deviation 4.26) post injury. The single voxel spectroscopy adjacent to side of injury and noninjury regions were analysed to obtain absolute concentrations and ratio relative to creatine of the neurometabolites. One-way analysis of variance was performed to compare neurometabolite concentrations of the three groups, and a correlation study was done between the neurometabolite concentration and Glasgow Coma Scale.
Results
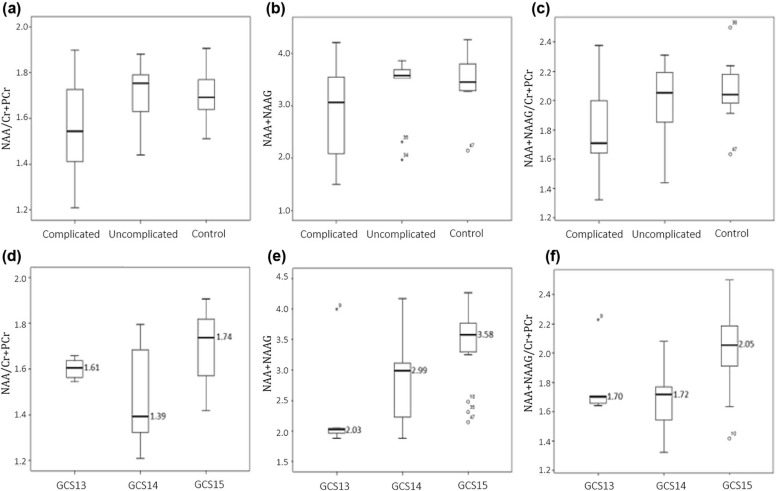
Significant difference was found in ratio of N -acetylaspartate to creatine (NAA/Cr + PCr) (χ 2 (2) = 0.22, P < .05) between the groups. The sum of NAA and N -acetylaspartylglutamate (NAAG) also shows significant differences in both the absolute concentration (NAA + NAAG) and ratio to creatine (NAA + NAAG/Cr + PCr) between groups (χ 2 (2) = 4.03, P < .05and (χ 2 (2) = 0.79, P < .05)). NAA values were lower in cmTBI and umTBI compared to control group. A moderate weak positive correlation were found between Glasgow Coma Scale with NAA/Cr + PCr ( ρ = 0.36, P < .05 and NAA + NAAG/Cr + PCr ( ρ = 0.45, P < .05)), whereas a moderate correlation was seen with NAA + NAAG ( ρ = 0.38, P < .05).
Conclusion
Neurometabolite alterations were already apparent at onset of both complicated and uncomplicated traumatic brain injury. The ratio of NAA and NAAG has potential to serve as a biomarker reflecting injury severity in a quantifiable manner as it discriminates between the complicated and uncomplicated cases of mTBI.
Introduction
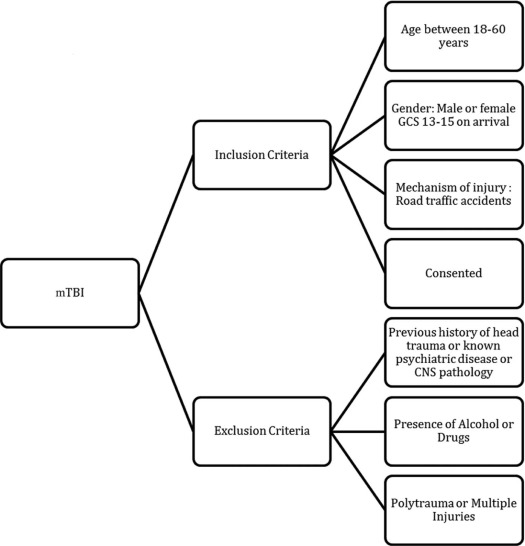
Deranged metabolites-induced cellular energy crisis is a common occurrence in traumatic head injury . The cascading events post trauma may lead to terminal membrane depolarization with excessive release of excitatory neurotransmitters , lysis of the cell membranes and apoptosis, disrupting various neural connectivity networks and consequentially affecting neurocognitive function or performance . Injury severity in mild traumatic brain injury (mTBI) could be categorized into complicated or uncomplicated. A complicated mTBI is differentiated from an uncomplicated mTBI by the presence of a closed depressed skull fracture or trauma-related intracranial abnormality or lesion .
The advent of advanced magnetic resonance imaging (MRI) techniques in recent years have enabled reliable assessment of microscopic changes in brain cytoarchitecture, neuronal injuries, and neurochemical changes resultant from traumatic insults. While conventional computed tomography scans and structural magnetic resonance sequences are usually unable to detect such physiological and biochemical changes occurring at cellular level , magnetic resonance spectroscopy (MRS) is capable of evaluating metabolic perturbation associated with mTBI in vivo.
Get Radiology Tree app to read full this article<
Get Radiology Tree app to read full this article<
Methods
Participant Recruitment
Get Radiology Tree app to read full this article<
Get Radiology Tree app to read full this article<
Get Radiology Tree app to read full this article<
Magnetic Resonance Imaging Acquisition
Get Radiology Tree app to read full this article<


Get Radiology Tree app to read full this article<
Brain Spectra Analysis
Get Radiology Tree app to read full this article<
Spectra Inclusion Criteria
Get Radiology Tree app to read full this article<
Get Radiology Tree app to read full this article<
Statistical Analysis
Get Radiology Tree app to read full this article<
Results
Patient Demography and Clinical Variables
Get Radiology Tree app to read full this article<
Table 1
Demographic Information According to Study Groups (cmTBI, umTBI, and Control)
Type of Injury Demographic/Clinical Presentation cmTBI umTBI Control (n = 23) (n = 12) (n = 13) Age (year) 28.96 (SD 10.2) 28.25 (SD 7.34) 27.15 (SD 4.88) Education (years) 10.96 (SD 1.97) 12.25 (SD 2.70) 16.31 (SD 3.28)
% % % Gender Male 87 83.3 61.5 Female 13 16.7 38.5 GCS on admission GCS 13 21.7 0 n/a GCS 14 39.1 0 n/a GCS 15 39.1 100 n/a Loss of consciousness Yes 95.7 83.3 n/a No 4.3 16.7 n/a Post traumatic amnesia None 21.7 33.3 n/a <1 h 52.2 33.3 n/a >1 h <24 h 26.1 33.3 n/a Voxel placement Frontal lobe 8 2 1 Parietal lobe 10 8 12 Temporal lobe 4 0 0 Occipital lobe 1 2 0
cmTBI, complicated mild traumatic brain injury; GCS, Glasgow Coma Scale; umTBI, uncomplicated mild traumatic brain injury; SD, standard deviation.
Get Radiology Tree app to read full this article<
Spectra Analysis
Get Radiology Tree app to read full this article<
Get Radiology Tree app to read full this article<
Table 2
Descriptive Summary for Absolute Metabolite Concentrations
Metabolites cmTBI (n = 23)
(ppm) umTBI (n = 12)
(ppm) Control (n = 13)
(ppm)P Values Mean SD Mean SD Mean SD Glu 2.817 0.387 2.988 0.371 2.736 0.272 .313 GPC 0.572 0.147 0.685 0.068 0.660 0.109 .166 Ins 1.633 0.347 1.759 0.147 1.576 0.271 .878 NAA 2.690 0.536 2.862 0.541 3.019 0.284 .058 GPC + PCh 0.585 0.129 0.666 0.046 0.660 0.109 .076 NAA + NAAG 3.097 0.775 3.235 0.708 3.620 0.352 .027 \* Cr + PCr 1.702 0.340 1.693 0.217 1.766 0.225 .591 Glu + Gln 4.195 0.831 4.150 0.422 3.634 0.328 .120 MM09 1.895 0.574 2.20 0.600 2.319 0.477 .173 MM20 3.105 0.826 3.206 0.448 3.614 0.546 .174 MM09 + Lip09 1.98 0.553 2.440 0.354 2.554 0.692 .144 MM20 + Lip20 3.162 0.8 3.215 0.434 3.736 0.608 .264
cmTBI, complicated mild traumatic brain injury; Cr, creatine; Gln, glutamine; Glu, glutamate; GPC, glycerophosphocholine; Ins, inositol; MM09 + Lip09, sum mixture of macromolecules and lipids signals at around 0.9 ppm; MM09, macromolecules at signals around 0.9 ppm; MM20 + Lip20, 2.0 ppm; MM20, macromolecules at signals around 2.0 ppm; NAA, N -acetylasparte; NAAG, N -acetylaspartylglutamate; PCh, phosphocholine; PCr, phosphocreatine; ppm, parts per million; SD, standard deviation; umTBI, uncomplicated mild traumatic brain injury.
Get Radiology Tree app to read full this article<
Table 3
Descriptive Summary for Relative Metabolite Concentrations Over Total Creatine
Metabolites (/Cr + PCr) cmTBI (n = 23)
(ppm) umTBI (n = 12)
(ppm) Control (n = 13)
(ppm)P Values Mean SD Mean SD Mean SD Glu 1.699 0.293 1.782 0.250 1.567 0.215 .222 GPC 0.343 0.1 0.395 0.035 0.374 0.049 .705 Ins 0.978 0.219 1.050 0.101 0.894 0.129 .291 NAA 1.593 0.202 1.68 0.163 1.72 0.125 .025 \* GPC + PCh 0.354 0.097 0.397 0.035 0.374 0.049 .771 NAA + NAAG 1.82 0.282 1.895 0.287 2.059 0.11 .004 \* Glu + Gln 2.464 0.435 2.352 0.376 2.051 0.336 .139 MM09 1.098 0.249 1.278 0.253 1.289 0.216 .402 MM20 1.796 0.332 1.882 0.096 2.028 0.361 .282 MM09 + Lip09 1.149 0.229 1.367 0.191 1.418 0.330 .400 MM20 + Lip20 1.831 0.307 1.889 0.099 2.097 0.399 .619
cmTBI, complicated mild traumatic brain injury; Cr, creatine; Gln, glutamine; Glu, glutamate; GPC, glycerophosphocholine; Ins, inositol; MM09 + Lip09, sum mixture of macromolecules and lipids signals at around 0.9 ppm; MM09, macromolecules at signals around 0.9 ppm; MM20 + Lip20, 2.0 ppm; MM20, macromolecules at signals around 2.0 ppm; NAA, N -acetylasparte; NAAG, N -acetylaspartylglutamate; PCh, phosphocholine; PCr, phosphocreatine; ppm, parts per million; SD, standard deviation; umTBI, uncomplicated mild traumatic brain injury.
Get Radiology Tree app to read full this article<

Table 4
The Post Hoc Test for Absolute Metabolite Concentration NAA + NAAG
I Group J Group Mean Difference (I-J) Std Error Sig 95% CI Lower Bound Upper Bound cmTBI umTBI −0.502 0.255 0.132 −1.12 0.116 Control −0.636 0.248 0.036 \* −1.238 −0.339 umTBI cmTBI 0.502 0.255 0.259 −0.095 0.459 Control −0.134 0.287 0.132 −0.116 1.12
CI, confidence interval; cmTBI, complicated mild traumatic brain injury; NAA, N -acetylasparte; NAAG, N -acetylaspartylglutamate; umTBI, uncomplicated mild traumatic brain injury.
Get Radiology Tree app to read full this article<
Table 5
The Post Hoc Test for Metabolite Ratio NAA + NAAG/Cr + PCr
I Group J Group Mean Difference (I-J) Std Error Sig 95% CI Lower Bound Upper Bound cmTBI umTBI −0.227 0.899 0.039 \* −0.445 0.009 Control −0.279 0.088 0.007 \* −0.491 −0.066 umTBI cmTBI 0.227 0.090 0.039 \* 0.009 0.445 Control −0.052 0.101 0.866 −0.297 0.193
CI, confidence interval; cmTBI, complicated mild traumatic brain injury; NAA + NAAG/Cr + PCr, N -acetylasparte and N -acetylaspartylglutamate/creatine and phosphocreatine; umTBI, uncomplicated mild traumatic brain injury.
Get Radiology Tree app to read full this article<
Get Radiology Tree app to read full this article<
Associations Between Neurometabolites With Injury Complexity and GCS
Get Radiology Tree app to read full this article<
Get Radiology Tree app to read full this article<
Discussion
Get Radiology Tree app to read full this article<
Get Radiology Tree app to read full this article<
Get Radiology Tree app to read full this article<
Get Radiology Tree app to read full this article<
Conclusion
Get Radiology Tree app to read full this article<
Acknowledgments
Get Radiology Tree app to read full this article<
Get Radiology Tree app to read full this article<
References
1. Dean P.J., Otaduy M., Harris L., et. al.: Monitoring long-term effects of mild traumatic brain injury with magnetic resonance spectroscopy: a pilot study. Neuroreport 2013; 24: pp. 677-681.
2. Werner C., Engelhard K.: Pathophysiology of traumatic brain injury. Br J Anaesth 2007; 99: pp. 4-9.
3. William D., Levin H., Eisenberg H.: Mild head injury classification. Neurosurgery 1990; 27: pp. 422-428.
4. Iverson G., Lange R., Wäljas M., et. al.: Outcome from complicated versus uncomplicated mild traumatic brain injury. Rehabil Res Pract 2012; 2012: pp. 415740.
5. George E.O., Roys S., Sours C., et. al.: Longitudinal and prognostic evaluation of mild traumatic brain injury: a 1H-magnetic resonance spectroscopy study. J Neurotrauma 2014; 31: pp. 1018-1028.
6. Yeo R.A., Gasparovic C., Merideth F., et. al.: Longitudinal proton magnetic resonance spectroscopy study of mild traumatic brain injury. J Neurotrauma 2011; 28: pp. 1-11.
7. Kierans A.S., Kirov I.I., Gonen O., et. al.: Myoinositol and glutamate complex neurometabolite abnormality after mild traumatic brain injury. Am J Neurol 2014; 82: pp. 521-528.
8. Govindaraju V., Gauger G.E., Manley G.T., et. al.: Volumetric proton spectroscopic imaging of mild traumatic brain injury. AJNR Am J Neuroradiol 2004; 25:
9. National Center for Injury Prevention and Control : Report to Congress on Mild Traumatic Brain Injury in the United States: Steps to Prevent a Serious Public Health Problem. Atlanta, GA: Centers for Disease Control and Prevention2003.
10. Provencher S.W.: Estimation of metabolite concentrations from localized in vivo proton NMR spectra. Magn Reson Med 1993; 30: pp. 672-679.
11. Cavassila S.D.S., Huegen C., van Ormondt D., et. al.: Cramer-Rao bound expressions for parametric estimation of overlapping peaks: influence of prior knowledge. J Magn Reson Imaging 2000; 143: pp. 311-320.
12. Provencher S.W.: LCModel and LCMGUI User’s Manual.2011.
13. Sidek S., Ramli N., Rahmat K., et. al.: In vivo proton magnetic resonance spectroscopy (1H-MRS) evaluation of the metabolite concentration of optic radiation in primary open angle glaucoma. Eur Radiol 2016; pp. 1-9.
14. Veeramuthu V., Narayanan V., Tan L.K., et. al.: Diffusion tensor imaging parameters in mild traumatic brain injury and its correlation with early neuropsychological impairment: a longitudinal study. J Neurotrauma 2015; 32: pp. 1497-1509.
15. Long P., Moffett J., Namboodiri A., et. al.: N-acetylaspartate (NAA) and N-acetylaspartylglutamate (NAAG) promote growth and inhibit differentiation of glioma stem-like cells. J Biol Chem 2013; 288: pp. 26188-26200.
16. Henry L.C., Tremblay S., Leclerc S., et. al.: Metabolic changes in concussed American football players during the acute and chronic post-injury phases. BMC Neurol 2011; 11: pp. 105.
17. Vagnozzi R., Signoretti S., Cristofori L., et. al.: Assessment of metabolic brain damage and recovery following mild traumatic brain injury: a multicentre, proton magnetic resonance spectroscopic study in concussed patients. Brain 2010; 133: pp. 3232-3242.
18. Signoretti S., Vagnozzi R., Tavazzi B., et. al.: Biochemical and neurochemical sequelae following mild traumatic brain injury: summary of experimental data and clinical implications. Neurosurg Focus 2010; 29: pp. E1.
19. Gasparovic C., Yeo R., Mannell M., et. al.: Neurometabolite concentrations in gray and white matter in mild traumatic brain injury: an 1H–magnetic resonance spectroscopy study. J Neurotrauma 2009; 26: pp. 1635-1643.
20. Moffett J.R., Ross B., Arun P., et. al.: N-Acetylaspartate in the CNS: from neurodiagnostics to neurobiology. Prog Neurobiol 2007; 81: pp. 89-131.
21. Marino S., Zei E., Battaglini M., et. al.: Acute metabolic brain changes following traumatic brain injury and their relevance to clinical severity and outcome. J Neurol Neurosurg Psychiatry 2007; 78: pp. 501-507.
22. Garnett M.R., Blamire A.M., Rajagopalan B., et. al.: Evidence for cellular damage in normal-appearing white matter correlates with injury severity in patients following traumatic brain injury. A magnetic resonance spectroscopy study. Brain 2000; 123: pp. 1403-1409.
23. Sakellaris G., Kotsiou M., Tamiolaki M., et. al.: Prevention of complications related to traumatic brain injury in children and adolescents with creatine administration: an open label randomized pilot study. J Trauma 2006; 61: pp. 322-329.