
Rationale and Objectives
The aims of this study were to explore the relationship between triglyceride (TG) and water in steatotic rat livers and to accordingly test the validity of the currently used steatosis calculation methods from magnetic resonance spectra. The approximations commonly used to derive steatosis degrees from magnetic resonance spectra include the generic types TG/water and TG/(TG + water).
Materials and Methods
Hepatic fat and water content was quantitated by histology, magnetic resonance spectroscopy (MRS), gas chromatography, and dry/wet weight ratio analysis in increasingly (0%–95%) steatotic rats. Correlation analysis was performed to assess the statistical relationships among the steatosis quantification techniques. Subsequently, data were fitted with linear and nonlinear functions to determine the relationship between hepatic water fraction versus hepatic TG content and TG/water ratio versus macrovesicular steatosis degree to test the validity of commonly used steatosis calculation methods.
Results
Histologic analysis of macrovesicular steatosis correlated very strongly with TG content determined by gas chromatography and MRS. A strong positive correlation was also found between gas chromatography–derived and MRS-derived TG content. Biochemical analysis revealed a linear converse relationship between hepatic fat and water content. This relationship was nonlinear when determined by MRS. The MRS-based TG/(TG + water)–type approximations reflected the linear water-fat relationship better than the TG/water–type approximations, particularly when the calculations were performed with a maximum number of TG resonances.
Conclusions
Hepatic fat approximations of the type TG/water overestimate hepatic steatosis degree because hepatic fat accumulation concurs with hepatic water exudation. Consequently, MRS-based approximations should be of the type TG/(TG + water) and contain a maximum number of TG resonances in the denominator.
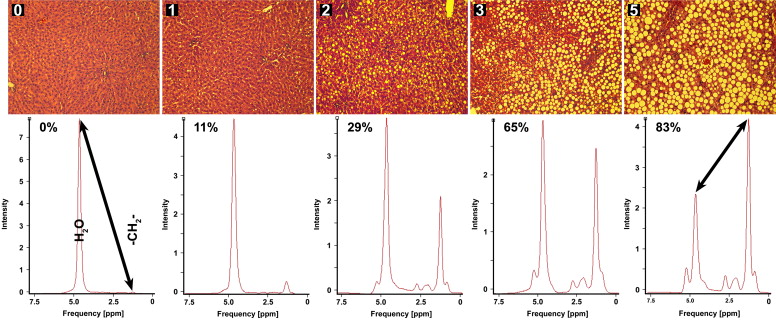
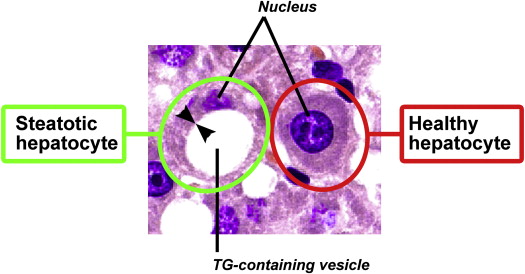
Hydrogen-1 magnetic resonance (MR) spectroscopy (MRS) has proven a viable tool for the noninvasive quantitation of experimental and clinical hepatic steatosis, a condition reflective of aberrant hepatic synthesis and elimination of fat that is characterized by the intracytoplasmic accumulation and vacuolization of triglycerides (TGs) in hepatocytes. When the TG-containing vesicles become large, such that they cause displacement of the nucleus, the condition is referred to as macrovesicular steatosis (MaS). Otherwise, the condition is referred to as microvesicular steatosis. Because of the favorable packing order of TGs (ie, a high degree of rotational freedom) and the absence of adipocytes in the liver, the resonances emanating from the acyl chains of TGs can be selectively and accurately acquired with clinical MR imaging scanners and quantified at relatively high signal-to-noise ratios . Hepatic TG quantification by MRS has been shown to correlate well with other quantification techniques, such as histologic analysis, computed tomography, ultrasound, and MR imaging , underscoring the clinical potential of this modality. An added benefit of MRS compared to ultrasonography or other radiologic techniques in the experimental setting is that MRS provides information on hepatic fatty acid (FA) composition with respect to saturated, mono-olefinic, and polyolefinic FAs. This additional feature makes MRS also useful for fat metabolic and lipidomic studies.
A number of peak ratios, summarized in Table 1 , have been used for the quantification of hepatic TG content on the basis of MR spectra derived from experimental steatosis models and patients. In the majority of cases, the quantitation of hepatic fat content is de facto semiquantitative, inasmuch as a TG/water or TG/(TG + water) ratio is calculated and expressed as a percentage. Actual quantitative data have been extrapolated in a select number of studies , whereby the fat mass per tissue volume is derived from the weighed relative proton density of tissue TGs versus water, the water mass/tissue mass ratio, and the spectral TG/water or TG/(TG + water) ratio acquired in a voxel. The chief assumptions in these computations ( Table 1 ) are that the proportion of body water to tissue is relatively invariant (unless extreme changes in hydration state occur) and that consequently, “steatosis increases only the volume fraction of fat in the liver without modifying the volume ratio between the water phase and the MR-invisible phase” (ie, proteins with very short T2 times) .
Table 1
Overview of the Different Calculation Methods Commonly Used for the Determination of TG Content From MR Spectra Derived From Patients and Animal Models
Study MFS [T] TG Peak Frequency [ppm] TG Quantification 0.8–1.0 1.2–1.4 2.0–2.1 2.2–2.4 5.3 -CH 3 -CH 3 - -CH 2 -CH=CH- -COO-CH 2 - -CH=CH- Clinical studies Szczepaniak et al 1.5 × AUC(-CH 2 -)/AUC(water) Szczepaniak et al 1.5 × × AUC(-CH 2 -, -CH 3 )/[AUC(-CH 2 -, -CH 3 ) + AUC(water)] Rijkelijkhuizen et al 1.5 × × × AUC(-CH 2 -, -CH 3 , -CH 2 -CH=CH-)/AUC(water) Machann et al 1.5 × AUC(-CH 2 -)/(AUC(-CH 2 -) + AUC(water)] d’Assignies et al 1.5 × × × AUC(-CH 2 -, -CH 3 , -CH 2 -CH=CH-)/[AUC(-CH 2 -,-CH 3 ,-CH 2 -CH=CH-) + AUC(water)] Rigazio et al 1.5 × × × × AUC(-CH 2 -, -CH 3 , -CH 2 -CH=CH-, COO-CH 2 -)/[AUC(-CH 2 -, -CH 3 , -CH 2 -CH=CH-, COO-CH 2 -) + AUC(water)] Hwang et al 1.5 × AUC(-CH 2 -)/[AUC(-CH 2 ,-) + {AUC(water) × 0.72}] Borra et al 1.5 × × AUC(-CH 2 -, -CH 3 )/[AUC(-CH 2 -, -CH 3 ) + {AUC(water) × 0.7}] Animal studies: mice Calderan et al 4.7 × × Not specified Garbow et al 4.7 × × × × × AUC(-CH 3 -,-CH 2 -, -CH 2 -CH=CH-, COO-CH 2 -, -CH=CH-)/AUC(water) Animal studies: rats Ling et al 2.0 × × I(-CH 2 -)/I(water) Hockings et al 2.0 × × × AUC(-CH 3 -, -CH 2 -, -CH 2 -CH=CH-)/AUC(water) Lim et al 3.0 × × AUC(-CH 3 -, -CH 2 -)/AUC(water) Herling et al 4.7 × × AUC(-CH 3 -, -CH 2 -)/AUC(water) Animal studies: rabbits Szczepaniak et al 1.5 × AUC(-CH 2 -)/AUC(water) Animal studies: dogs Szczepaniak et al 1.5 × AUC(-CH 2 -)/AUC(water)
AUC, area under the curve; I, intensity; MFS, magnetic field strength; MR, magnetic resonance; TG, triglyceride.
Get Radiology Tree app to read full this article<
Get Radiology Tree app to read full this article<
Get Radiology Tree app to read full this article<
Materials and methods
Experimental Setup and Steatosis Induction
Get Radiology Tree app to read full this article<
1 H-MRS
Get Radiology Tree app to read full this article<
Histology
Get Radiology Tree app to read full this article<
Lipid Extraction and GC
Get Radiology Tree app to read full this article<
Get Radiology Tree app to read full this article<
Get Radiology Tree app to read full this article<
Determination of Water Content
Get Radiology Tree app to read full this article<
Data Normalization
Get Radiology Tree app to read full this article<
Curve Fitting
Get Radiology Tree app to read full this article<
Get Radiology Tree app to read full this article<
∑95x=1{[f(x)=ax+b]−[f(x)=A+Bx+Cx2]}ω, ∑
x
=
1
95
{
[
f
(
x
)
=
a
x
+
b
]
−
[
f
(
x
)
=
A
+
B
x
+
C
x
2
]
}
ω
,
where x represents the histologic MaS degree; f ( x ) = ax + b and f ( x ) = A + Bx + Cx 2 are generic linear and polynomial equations, respectively; and ω indicates that {[ f ( x ) = ax + b ] − [ f ( x ) = A + Bx + Cx 2 ]} comprises natural numbers. The function sums up the difference between y values of the linear and polynomial equations for each steatosis degree ( x ) and expresses the cumulative difference as a number between zero (ie, no difference between the linear fit and the polynomial fits at each steatosis degree) and ∞. Thus, the higher Σ is, the greater the difference between the linear and polynomial fit. Σ was solved per approximation (specified later) for the respective fits.
Get Radiology Tree app to read full this article<
Statistical Analysis
Get Radiology Tree app to read full this article<
Results
Steatosis Induction and TG Profiles in MCD Diet–fed Animals
Get Radiology Tree app to read full this article<
![Figure 1, Fat content determination by histological analysis (a) , gas chromatography (GC) (b) , and 1H-magnetic resonance spectroscopy (MRS) (c) plotted as a function of MCD diet time. Data are plotted as mean ± SD. #, # #, and # # # designate a P-value of ≤ .05, ≤ .01, and ≤ .001 respectively, vs. t = 0 wk; ‡ and ‡‡ designate a P-value of ≤ .05 and ≤ .01, respectively, vs. t = 1 wk. Scatter plots of histology vs. GC (d) , histology vs. MRS (e) , and GC vs. MRS (f) , curve fitted with a linear fit and supplemented by 95% confidence interval bands (dotted lines). Spearman's correlation coefficient (ρ) and the goodness of fit are indicated in the upper left corner. TG content was calculated from MR spectra by AUC(-CH 2 -) [AUC(-CH 2 -) + AUC(water)]. MaS, macrovesicular steatosis.](https://storage.googleapis.com/dl.dentistrykey.com/clinical/NoninvasiveQuantificationofTriglycerideContentinSteatoticRatLiversby1HMRS/0_1s20S1076633211004272.jpg)
Get Radiology Tree app to read full this article<
Get Radiology Tree app to read full this article<
Get Radiology Tree app to read full this article<
TG Accumulation and Water Exudation Is a Nonlinear Process in Increasingly Steatotic Rat Livers
Get Radiology Tree app to read full this article<
![Figure 4, (a) Integrated peak values as determined by magnetic resonance spectroscopy (MRS) (area under the curve [AUC]; arbitrary units) for the water resonance (4.7 ppm) (gray) and the cumulative methylene (-CH 2 -, 1.3 ppm) and methyl (-CH 3 , 0.9 ppm) resonances (black) plotted as a function of histologic macrovesicular steatosis (MaS) degree. The linear regression functions are y = −0.0009 x + 0.2356 ( R 2 = 0.39) for water and y = 0.0021 x − 0.0015 ( R 2 = 0.85) for triglycerides (TGs). AUC, area under the curve. (b) TG content as determined by gas chromatography (GC) plotted against the respective water fraction deduced from the dry/wet weight ratio. Spearman's correlation coefficient (ρ), goodness of fit ( R 2 ), and the slope are provided in the upper right corner . The 95% confidence intervals are included for the linear fit (dotted lines) . (c) A ratio of the data in (A) was calculated as AUC(-CH 2 -)/AUC(water) and plotted pairwise against histopathologic MaS degree. The R 2 value of the exponential fit is indicated in the upper left corner , and 95% confidence intervals are included for the nonlinear fit (dotted lines) . (d) To validate the TG/(TG + water) ratios as determined in (C) by MRS, nonparametric correlation and linear regression analysis was performed on the fat/water ratio as determined by MRS versus GC and the dry/wet weight ratio. Spearman's ρ is indicated in the upper left corner , as well as the R 2 value of the linear fit and its slope. Ninety-five percent confidence intervals are included for the linear fit (dotted lines) . Ratios were normalized (Norm.) to the maximum value of the data set.](https://storage.googleapis.com/dl.dentistrykey.com/clinical/NoninvasiveQuantificationofTriglycerideContentinSteatoticRatLiversby1HMRS/3_1s20S1076633211004272.jpg)
Get Radiology Tree app to read full this article<
Get Radiology Tree app to read full this article<
Get Radiology Tree app to read full this article<
Accuracy of Approximations for TG Content Determination from MR Spectra
Get Radiology Tree app to read full this article<
Get Radiology Tree app to read full this article<
Get Radiology Tree app to read full this article<
![Figure 5, Scatterplots of histologic macrovesicular steatosis (MaS) degree plotted against magnetic resonance spectroscopy (MRS)–derived triglyceride (TG)/water ratios calculated by AUC(-CH 2 -)/AUC(water) (a) , AUC(-CH 2 - + -CH 3 )/AUC(water) (b) , and AUC(-CH 2 -, -CH 3 , -CH 2 -CH=CH-)/AUC(water) (c) and TG/(TG + water) ratios calculated by AUC(-CH 2 -)/[AUC(-CH 2 -) + AUC(water)] (d) , AUC(-CH 2 -, -CH 3 )/[AUC(-CH 2 -, -CH 3 ) + AUC(water)] (e) , and AUC(-CH 2 -, -CH 3 , -CH 2 -CH=CH-, =CH-CH 2 -CH=, -CH=CH-)/[AUC(-CH 2 -, -CH 3 , -CH 2 -CH=CH-, =CH-CH 2 -CH=, -CH=CH-) + AUC(water)] (f) . The resonances (in ppm) used in the formulas are indicated above each respective panel. The goodness-of-fit values of the linear fit (black) and the second-order polynomial fit (gray) are provided in the upper left corner. The extent of convergence of both fits (Σ; see text) is given in the lower right corner and represents the sum of all light gray-shaded areas. AUC, area under the curve.](https://storage.googleapis.com/dl.dentistrykey.com/clinical/NoninvasiveQuantificationofTriglycerideContentinSteatoticRatLiversby1HMRS/4_1s20S1076633211004272.jpg)
Get Radiology Tree app to read full this article<
Get Radiology Tree app to read full this article<
Get Radiology Tree app to read full this article<
Get Radiology Tree app to read full this article<
Discussion
Get Radiology Tree app to read full this article<
Get Radiology Tree app to read full this article<
Get Radiology Tree app to read full this article<
Get Radiology Tree app to read full this article<
Get Radiology Tree app to read full this article<
Conclusions
Get Radiology Tree app to read full this article<
References
1. Szczepaniak L.S., Babcock E.E., Schick F., et. al.: Measurement of intracellular triglyceride stores by H spectroscopy: validation in vivo. Am J Physiol 1999; 276: pp. E977-E989.
2. Longo R., Ricci C., Masutti F., et. al.: Fatty infiltration of the liver. Quantification by 1H localized magnetic resonance spectroscopy and comparison with computed tomography. Invest Radiol 1993; 28: pp. 297-302.
3. Szczepaniak L.S., Nurenberg P., Leonard D., et. al.: Magnetic resonance spectroscopy to measure hepatic triglyceride content: prevalence of hepatic steatosis in the general population. Am J Physiol Endocrinol Metab 2005; 288: pp. E462-E468.
4. Thomas E.L., Hamilton G., Patel N., et. al.: Hepatic triglyceride content and its relation to body adiposity: a magnetic resonance imaging and proton magnetic resonance spectroscopy study. Gut 2005; 54: pp. 122-127.
5. d’Assignies G., Ruel M., Khiat A., et. al.: Noninvasive quantitation of human liver steatosis using magnetic resonance and bioassay methods. Eur Radiol 2009; 19: pp. 2033-2040.
6. Fischbach F., Bruhn H.: Assessment of in vivo 1H magnetic resonance spectroscopy in the liver: a review. Liver Int 2008; 28: pp. 297-307.
7. Vuppalanchi R., Cummings O.W., Saxena R., et. al.: Relationship among histologic, radiologic, and biochemical assessments of hepatic steatosis: a study of human liver samples. J Clin Gastroenterol 2007; 41: pp. 206-210.
8. Su Z.Z., Shan H., He B.J., et. al.: Selection of the most powerful predictors for the evaluation of hepatic steatosis grade: an experimental study. Eur J Radiol 2009; 72: pp. 118-124.
9. Rijkelijkhuizen J.M., Doesburg T., Girman C.J., et. al.: Hepatic fat is not associated with beta-cell function or postprandial free fatty acid response. Metabolism 2009; 58: pp. 196-203.
10. Machann J., Thamer C., Schnoedt B., et. al.: Hepatic lipid accumulation in healthy subjects: a comparative study using spectral fat-selective MRI and volume-localized 1H-MR spectroscopy. Magn Reson Med 2006; 55: pp. 913-917.
11. Rigazio S., Lehto H.R., Tuunanen H., et. al.: The lowering of hepatic fatty acid uptake improves liver function and insulin sensitivity without affecting hepatic fat content in humans. Am J Physiol Endocrinol Metab 2008; 295: pp. E413-E419.
12. Hwang J.H., Stein D.T., Barzilai N., et. al.: Increased hepatic triglyceride is associated with peripheral insulin resistance: in vivo MR imaging and spectroscopy studies. Am J Physiol Endocrinol Metab 2007; 293: pp. E1663-E1669.
13. Borra R.J., Salo S., Dean K., et. al.: Nonalcoholic fatty liver disease: rapid evaluation of liver fat content with in-phase and out-of-phase MR imaging. Radiology 2009; 250: pp. 130-136.
14. Calderan L., Marzola P., Nicolato E., et. al.: In vivo phenotyping of the ob/ob mouse by magnetic resonance imaging and 1H-magnetic resonance spectroscopy. Obesity 2006; 14: pp. 405-414.
15. Garbow J.R., Lin X., Sakata N., Chen Z., Koh D., Schonfeld G.: In vivo MRS measurement of liver lipid levels in mice. J Lipid Res 2004; 45: pp. 1364-1371.
16. Ling M., Brauer M.: Ethanol-induced fatty liver in the rat examined by in vivo 1H chemical shift selective magnetic resonance imaging and localized spectroscopic methods. Magn Reson Imaging 1992; 10: pp. 663-677.
17. Hockings P.D., Changani K.K., Saeed N., et. al.: Rapid reversal of hepatic steatosis, and reduction of muscle triglyceride, by rosiglitazone: MRI/S studies in Zucker fatty rats. Diabetes Obes Metab 2003; 5: pp. 234-243.
18. Lim S., Son K.R., Song I.C., et. al.: Fat in liver/muscle correlates more strongly with insulin sensitivity in rats than abdominal fat. Obesity 2009; 17: pp. 188-195.
19. Herling A.W., Kilp S., Juretschke H.P., et. al.: Reversal of visceral adiposity in candy-diet fed female Wistar rats by the CB1 receptor antagonist rimonabant. Int J Obes 2008; 32: pp. 1363-1372.
20. Longo R., Pollesello P., Ricci C., et. al.: Proton MR spectroscopy in quantitative in vivo determination of fat content in human liver steatosis. J Magn Reson Imaging 1995; 5: pp. 281-285.
21. Lewis D.S., Bertrand H.A., Masoro E.J.: Total body water-to-lean body mass ratio in baboons (Papio sp.) of varying adiposity. J Appl Physiol 1986; 61: pp. 1234-1236.
22. Marsman H.A., van Werven J.R., Nederveen A.J., et. al.: Noninvasive quantitative assessment of hepatic steatosis in the rat liver using 3.0 Tesla magnetic resonance spectroscopy. [abstract 106]Proceedings of the European Society for Surgical Research, Galway, Ireland 2008.2008.Wiley-BlackwellOxford, UK:
23. Marsman H.A., van Werven J.R., Nederveen A.J., et. al.: Noninvasive quantitative assessment of hepatic steatosis in the rat liver using 3.0 Tesla magnetic resonance spectroscopy.Proceedings of the Netherlands Society of Gastroenterology and the Netherlands Society of Hepatology: Spring Meeting, Veldhoven, The Netherlands 2008.2008.Wolters Kluwer HealthChicago, IL:pp. A27.
24. Veteläinen R., van Vliet A., van Gulik T.M.: Essential pathogenic and metabolic differences in steatosis induced by choline or methione-choline deficient diets in a rat model. J Gastroenterol Hepatol 2007; 22: pp. 1526-1533.
25. Marsman H.A., van Werven J.R., Nederveen A.J., et. al.: Noninvasive quantification of hepatic steatosis in rats using 3.0 T 1H-magnetic resonance spectroscopy. J Magn Reson Imaging 2010; 32: pp. 148-154.
26. de Bazelaire C.M., Duhamel G.D., Rofsky N.M., et. al.: MR imaging relaxation times of abdominal and pelvic tissues measured in vivo at 3.0 T: preliminary results. Radiology 2004; 230: pp. 652-659.
27. Naressi A., Couturier C., Devos J.M., et. al.: Java-based graphical user interface for the MRUI quantitation package. MAGMA 2001; 12: pp. 141-152.
28. Marsman H.A., Heger M., Kloek J.J., et. al.: Reversal of hepatic steatosis by omega-3 fatty acids measured non-invasively by (1) H-magnetic resonance spectroscopy in a rat model. J Gastroenterol Hepatol 2011; 26: pp. 356-363.
29. Selzner M., Clavien P.A.: Fatty liver in liver transplantation and surgery. Semin Liver Dis 2001; 21: pp. 105-113.