
Rationale and Objectives
Cardiac computer tomography (CT) image-based vertebral bone mineral density (BMD) assessment and the influence of cardiovascular disease risk factors on BMD have not been systematically evaluated, especially in a community-based, multiethnic population.
Methods
A cross-sectional study design is used to determine if cardiac CT image is a reliable source to assess vertebral BMD, and a total of 2028 CT images were obtained from the Multi-Ethnic Study of Atherosclerosis, a large, diverse US cohort of adults 45 to 84 years of age.
Results
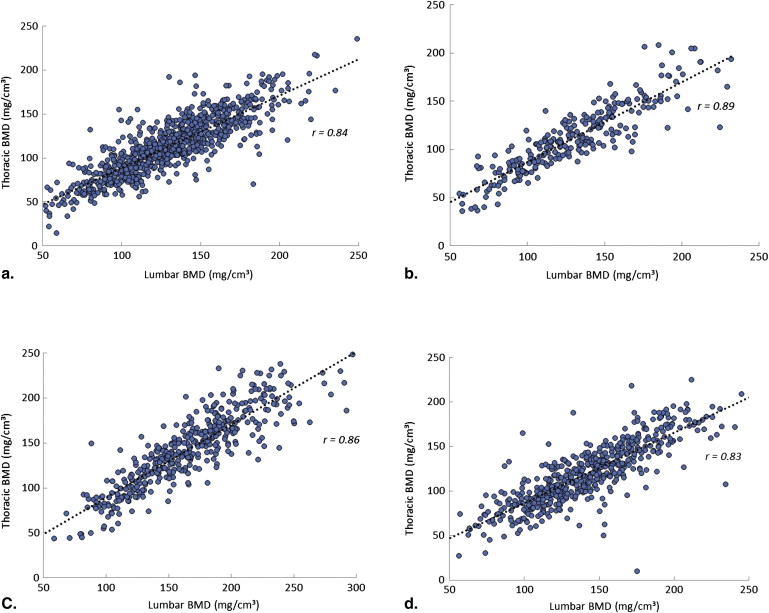
Cardiac CT image allows the rapid assessment of vertebral BMD and related fractures. The mean BMD was significantly higher in men compared with women for thoracic vertebrae (143.2 ± 41.2 vs 138.7 ± 42.7 mg/cm³, respectively, P = .014), as well as for lumbar vertebrae (125.0 ± 37.9 vs 117.2 ± 39.4 mg/cm³, respectively, P < .0001). Thoracic and lumbar BMDs are closely correlated (correlation coefficient 0.87, P < .001), independent of age and other confounders including sex and race. African American men had the highest thoracic BMD among all race/ethnicity and sex subgroups. Prevalence of fractures in total vertebrae is 4.2%. Lumbar had approximately 2 times higher prevalence of fracture than thoracic, and the prevalence of vertebral fractures is 1.5% and 3.1% for thoracic and lumbar vertebrae, respectively.
Conclusions
Using cardiac CT images to garner and assess vertebral BMD is a feasible and reliable method. Cardiac CT has the additional advantages of evaluate vertebral bone health while assessing cardiovascular disease risk with no extra cost or radiation exposure.
Cardiac computed tomography (CT), especially the latest-generation multidetector CT, is a noninvasive imaging tool that has been increasingly applied for early atherosclerosis detection, quantification of coronary artery calcification, and coronary artery stenosis assessment . Some initial studies have indicated that cardiac CT may have the potential to assess vertebral bone mineral density (BMD) while assessing cardiovascular disease (CVD) risk with no extra cost or radiation , but the results show population diversity. Method validation is extremely important, especially in a community-based, multiethnic (white, African American, Asian, and Hispanic) population.
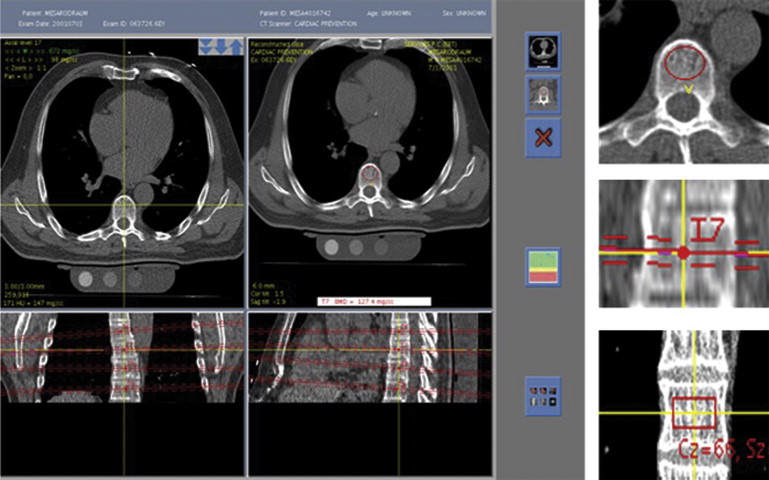
The Multi-Ethnic Study of Atherosclerosis (MESA) is a population-based study of eight large sex/ethnic subpopulations with cardiac CT scanning images across the United States. This study provides an opportunity to evaluate vertebral BMD based on noncontrast cardiac CT images. Compared with dual-energy x-ray absorptiometry (DXA), the predominant screening tool for BMD, cardiac CT has at least three unique advantages: (a) ability to clearly separate cortical and trabecular bone; (b) offer “real” volumetric density in units of mg/cm³; and (c) provide high-resolution three-dimensional images of bone morphometry. Notably, compared with cortical bone, trabecular bone loses first and quick response to medical therapies as well. So trabecular bone may offer a more realistic reflection of bone mineral metabolism and bone density status . In this study, we use cardiac CT image to garner vertebral bone information and then to assess trabecular BMD (tBMD) and related fractures while assessing cardiovascular disease risk.
Methods
CT Image Acquisition
Get Radiology Tree app to read full this article<
Get Radiology Tree app to read full this article<
Measurement of tBMD
Get Radiology Tree app to read full this article<
Get Radiology Tree app to read full this article<
Measurement of Vertebral Fracture
Get Radiology Tree app to read full this article<
Statistical Analysis
Get Radiology Tree app to read full this article<
Results
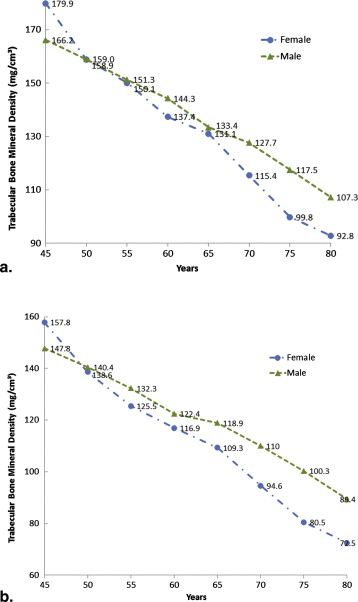
Community-Based Multiethnic Reference Values for Vertebral BMD
Get Radiology Tree app to read full this article<
Get Radiology Tree app to read full this article<
Table 1
Community-Based Multirace/Ethnicity Reference Values for Vertebral BMD among Men
Thoracic tBMD (mg/cm³) Lumbar tBMD (mg/cm³) White Chinese American African American Hispanic White Chinese American African American Hispanic Overall 131.1 ± 36.0 134.1 ± 34.7 171.9 ± 46.9 148.1 ± 37.2 115.1 ± 33.1 115.3 ± 31.5 151.7 ± 43.7 127.9 ± 34.5 Age group (yr) 80–85 95.0 ± 37.8 109.5 ± 16.3 105.4 ± 21.4 130.1 ± 30.9 79.6 ± 34.2 96.1 ± 21.9 85.4 ± 21.7 106.4 ± 31.2 75–79 105.8 ± 30.7 119.7 ± 36.9 151.1 ± 46.8 116.3 ± 32.3 90.3 ± 29.0 100.6 ± 33.2 128.3 ± 50.7 102.1 ± 27.4 70–74 123.9 ± 27.3 124.6 ± 37.4 147.6 ± 32.1 122.3 ± 29.6 105.8 ± 30.6 97.2 ± 18.0 137.2 ± 45.2 106.8 ± 26.6 65–69 118.0 ± 35.2 125.4 ± 23.5 172.4 ± 38.8 131.7 ± 30.5 105.1 ± 28.7 108.5 ± 25.7 156.8 ± 49.1 115.3 ± 33.1 60–64 133.2 ± 33.3 126.0 ± 34.0 181.3 ± 38.1 146.3 ± 32.2 115.1 ± 32.1 107.7 ± 32.5 149.0 ± 29.7 123.0 ± 32.3 55–59 140.7 ± 32.6 138.5 ± 27.4 173.4 ± 52.0 157.9 ± 38.2 123.9 ± 25.6 115.3 ± 22.7 149.0 ± 35.9 140.4 ± 33.1 50–54 150.2 ± 30.2 143.8 ± 29.4 180.2 ± 45.3 163.3 ± 37.1 135.3 ± 31.6 127.9 ± 22.8 161.3 ± 38.3 138.5 ± 33.3 45–49 150.4 ± 35.9 160.6 ± 38.3 201.0 ± 53.9 167.0 ± 31.2 133.6 ± 25.4 147.7 ± 35.2 183.2 ± 35.7 144.6 ± 30.9
Table 2
Community-Based Multirace/Ethnicity Reference Values for Vertebral BMD among Women
Thoracic tBMD (mg/cm³) Lumbar tBMD (mg/cm³) White Chinese American African American Hispanic White Chinese American African American Hispanic Overall 126.5 ± 35.2 124.9 ± 39.8 164.8 ± 48.0 139.5 ± 38.1 109.1 ± 34.4 107.5 ± 37.8 138.7 ± 43.9 114.0 ± 35.6 Age group (yr) 80–85 93.3 ± 25.0 94.1 ± 17.7 115.1 ± 38.3 108.0 ± 25.4 74.8 ± 24.5 91.7 ± 22.3 93.0 ± 46.3 80.1 ± 16.6 75–79 93.8 ± 24.8 77.5 ± 21.6 114.8 ± 27.0 107.9 ± 33.6 75.4 ± 21.8 62.9 ± 20.9 94.5 ± 25.5 84.8 ± 28.5 70–74 109.2 ± 28.6 93.8 ± 21.5 143.6 ± 43.1 108.8 ± 30.8 91.8 ± 33.4 75.7 ± 24.1 115.5 ± 39.2 86.4 ± 28.1 65–69 122.3 ± 34.3 103.7 ± 28.1 153.4 ± 38.7 128.7 ± 30.2 103.6 ± 30.4 95.9 ± 37.3 124.7 ± 34.4 105.1 ± 30.6 60–64 135.3 ± 27.7 132.2 ± 32.1 162.0 ± 35.4 132.9 ± 23.7 115.1 ± 29.5 109.3 ± 30.9 146.6 ± 34.1 109.4 ± 25.1 55–59 130.7 ± 31.2 136.4 ± 29.8 184.7 ± 49.1 151.7 ± 38.0 114.0 ± 27.8 116.4 ± 28.4 151.6 ± 41.6 122.1 ± 31.2 50–54 145.6 ± 31.1 154.3 ± 34.4 188.4 ± 32.3 155.1 ± 30.1 131.3 ± 26.4 136.2 ± 29.7 162.0 ± 30.4 129.1 ± 30.3 45–49 154.0 ± 43.6 155.9 ± 28.2 207.3 ± 50.6 187.5 ± 31.0 139.2 ± 39.2 139.9 ± 28.1 182.9 ± 39.7 159.1 ± 29.2
Get Radiology Tree app to read full this article<
Get Radiology Tree app to read full this article<
Table 3
Correlation of Thoracic and Lumbar BMD as a Whole and Stratified by Race and Sex
Total Population Women Men_r__P__r__P__r__P_ Full population 0.87 <.0001 0.90 <.0001 0.85 <.0001 White 0.84 <.0001 0.88 <.0001 0.81 <.0001 Chinese American 0.89 <.0001 0.92 <.0001 0.84 <.0001 African American 0.86 <.0001 0.90 <.0001 0.82 <.0001 Hispanic 0.83 <.0001 0.86 <.0001 0.81 <.0001
\* r indicates Pearson correlation coefficients, significant P value for r .
Get Radiology Tree app to read full this article<
Influence of CVD Risk Factors on Vertebral BMD
Get Radiology Tree app to read full this article<
Table 4
Influence of CVD Risk Factors on Vertebral BMD
n Thoracic BMD (mg/cm³) Lumbar BMD (mg/cm³) Mean ± SD β (SE) 95% CI_P_ Mean ± SD β (SE) 95% CI_P_ Race/ethnic group White 846 128.9 ± 35.7 0 (Ref) 112.3 ± 33.8 0 (Ref) Chinese American 260 129.8 ± 37.4 1.0 (2.8) −4.4 to 6.5 .71 111.6 ± 34.8 0.8 (2.6) −5.9 to 4.4 .77 African American 431 167.9 ± 47.6 39.3 (2.3) 34.7 to 43.8 <.001 144.3 ± 44.2 32.3 (2.2) 28.0 to 36.6 <.001 Hispanic 523 143.8 ± 37.9 14.8 (2.2) 10.4 to 19.1 <.001 120.9 ± 35.7 8.4 (2.1) 4.3 to 12.5 <.001 Sex Women 1027 138.7 ± 42.7 0 (Ref) 117.2 ± 39.4 0 (Ref) Men 1033 143.2 ± 41.2 5.2 (1.9) 1.6 to 8.9 .005 125.0 ± 37.9 8.4 (1.7) 5.1 to 11.8 <.001 Age (yr) <65 1205 154.5 ± 39.9 0 (Ref) 133.9 ± 35.4 0 (Ref) ≥65 855 121.9 ± 37.2 −32.7 (1.8) −36.1 to −29.2 <.001 103.1 ± 36.3 −30.7 −33.9 to −27.5 <.001 Body weight Normal 583 129.6 ± 39.6 0 (Ref) 114.0 ± 37.0 0 (Ref) Obese 1477 145.4 ± 42.1 15.8 (2.0) 11.9 to 19.9 <.001 123.9 ± 39.2 9.9 (1.7) 6.1 to 13.6 <.001
Get Radiology Tree app to read full this article<
Get Radiology Tree app to read full this article<
Get Radiology Tree app to read full this article<
Get Radiology Tree app to read full this article<
Get Radiology Tree app to read full this article<
Discussion
Get Radiology Tree app to read full this article<
Get Radiology Tree app to read full this article<
Get Radiology Tree app to read full this article<
Get Radiology Tree app to read full this article<
Get Radiology Tree app to read full this article<
Get Radiology Tree app to read full this article<
Acknowledgments
Get Radiology Tree app to read full this article<
References
1. Budoff M.J., Hokanson J.E., Nasir K., et. al.: Progression of coronary artery calcium predicts all-cause mortality. JACC Cardiovasc Imaging 2010; 3: pp. 1229-1236.
2. Tanaka R., Yoshioka K., Niinuma H., et. al.: Diagnostic value of cardiac CT in the evaluation of bicuspid aortic stenosis: Comparison with echocardiography and operative findings. AJR Am J Roentgenol 2010; 195: pp. 895-899.
3. Heffernan E.J., Dodd J.D., Malone D.E.: Cardiac multidetector CT: Technical and diagnostic evaluation with evidence-based practice techniques. Radiology 2008; e248: pp. 366-377.
4. Lenchik L., Shi R., Register T.C., et. al.: Measurement of trabecular bone mineral density in the thoracic spine using cardiac gated quantitative computed tomography. J Comput Assist Tomogr 2004; 28: pp. 134-139.
5. Khoo B.C., Brown K., Cann C., et. al.: Comparison of QCT-derived and DXA-derived areal bone mineral density and T scores. Osteoporosis Int 2009; 20: pp. 1539-1545.
6. Hayashi T., Chen H., Miyamoto K., et. al.: Analysis of bone mineral density distribution at trabecular bones in thoracic and lumbar vertebrae using X-ray CT images. J Bone Miner Metab 2011; 29: pp. 174-185.
7. Vaughan J.M.: The physiology of bone.2nd ed.1975.Clarendon PressOxford, UK
8. Ito M.: [CT evaluation of trabecular and cortical bone mineral density of the lumbar spine in patients on hemodialysis]. Nippon Igaku Hoshasen Gakkai Zasshi 1989; 49: pp. 1382-1389.
9. Wasnich R.D., Ross P.D., Davis J.W.: Osteoporosis: Current practice and future perspectives. Trends Endocrinol Metab 1991; 2: pp. 59-62.
10. Budoff M.J., Khairallah W., Li D., et. al.: Trabecular bone mineral density measurement using thoracic and lumbar quantitative computed tomography. Acad Radiol 2012; 19: pp. 179-183.
11. Genant H.K., Wu C.Y., van Kuijk C., et. al.: Vertebral fracture assessment using a semiquantitative technique. J Bone Miner Res 1993; 8: pp. 1137-1148.
12. Lenchik L., Rogers L.F., Delmas P.D., et. al.: Diagnosis of osteoporotic vertebral fractures: importance of recognition and description by radiologists. AJR Am J Roentgenol 2004; 183: pp. 949-958.
13. Kotzki P.O., Buyck D., Leroux J.L., et. al.: Measurement of the bone mineral density of the os calcis as an indication of vertebral fracture in women with lumbar osteoarthritis. Br J Radiol 1993; 66: pp. 55-60.
14. Shen W., Chen J., Gantz M., et. al.: Ethnic and sex differences in bone marrow adipose tissue and bone mineral density relationship. Osteoporosis Int 2012; 23: pp. 2293-2301.
15. Araujo A.B., Travison T.G., Harris S.S., et. al.: Race/ethnic differences in bone mineral density in men. Osteoporosis Int 2007; 18: pp. 943-953.
16. Looker A.C., Melton L.J., Harris T., et. al.: Age, gender, and race/ethnic differences in total body and subregional bone density. Osteoporosis Int 2009; 20: pp. 1141-1149.
17. Peacock M., Buckwalter K.A., Persohn S., et. al.: Race and sex differences in bone mineral density and geometry at the femur. Bone 2009; 45: pp. 218-225.
18. Ettinger M.P.: Aging bone and osteoporosis: Strategies for preventing fractures in the elderly. Arch Intern Med 2003; 163: pp. 2237-2246.
19. Naganathan V., Sambrook P.: Gender differences in volumetric bone density: A study of opposite-sex twins. Osteoporosis Int 2003; 14: pp. 564-569.
20. Jessup J.V., Horne C., Vishen R.K., et. al.: Effects of exercise on bone density, balance, and self-efficacy in older women. Biol Res Nurs 2003; 4: pp. 171-180.