
Rationale and Objectives
Cerebral oxygen extraction, defined as the difference between arterial and venous oxygen saturations (SaO 2 and SvO 2 ), is a critical parameter for managing intensive care patients at risk for neurological collapse. Although quantification of SaO 2 is easily performed with pulse oximetry or moderately invasive arterial blood draws in peripheral vessels, cerebral SvO 2 is frequently not monitored because of the invasiveness and risk associated with obtaining jugular bulb or super vena cava (SVC) blood samples.
Materials and Methods
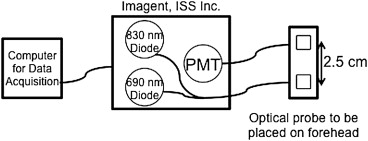
In this study, near-infrared spectroscopy (NIRS) was used to noninvasively measure cerebral SvO 2 in anesthetized and mechanically ventilated pediatric patients ( n = 10). To quantify SvO 2 , the NIRS signal component that fluctuates at the respiration frequency is isolated. This respiratory component is dominated by the venous portion of the interrogated vasculature. The NIRS measurements of SvO 2 were validated against the clinical gold standard: invasively measured oxygen saturations from SVC blood samples. This technique was also applied in healthy volunteers ( n = 5) without mechanical ventilation to illustrate its potential for use in healthy populations with natural airways.
Results
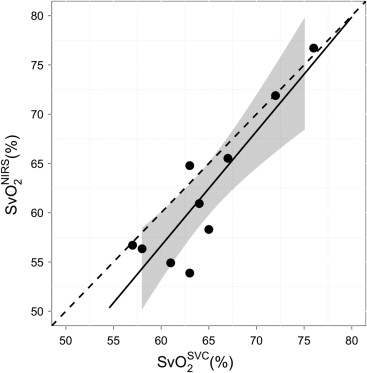
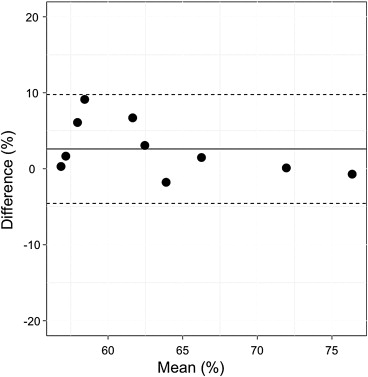
Ten pediatric patients with pulmonary hypertension were studied. In these patients, SvO 2 in the SVC exhibited good agreement with NIRS-measured SvO 2 ( R 2 = 0.80, P = .001, slope = 1.16 ± 0.48). Furthermore, in the healthy adult volunteers, mean (standard deviation) NIRS-measured SvO 2 was 79.4 (6.8)%. This value is in good agreement with the expected average central venous saturation reported in literature.
Conclusion
Respiration frequency-selected NIRS can noninvasively quantify cerebral SvO 2 . This bedside technique can be used to help assess brain health in neurologically unstable patients.
Oxygen extraction is an important parameter for assessment of brain tissue health in many critically ill patient populations at risk for altered cerebral hemodynamics. Knowledge of cerebral oxygen extraction helps the clinician balance oxygen delivery with cerebral demand thus preventing cell death secondary to metabolic failure. This quantity can be approximated from the difference between the saturation of arterial blood received by the brain and saturation of the venous blood leaving the brain. However, the gold standard for measurement of cerebral venous saturation remains a highly invasive procedure: central venous catheterization followed by direct measurement of oxygen saturation in the jugular bulb by oximetry . Although jugular catheters are commonly placed in adult critical care patients, these catheters pose substantial challenges in younger/smaller patients. Smaller, shorter necks make placement of these catheters difficult, and in-dwelling catheters can lead to complications such as line-associated thrombosis and an increased risk of line-associated infection . Thus, an easy-to-acquire, noninvasive measurement of central venous oxygen saturation (SvO 2 ) would potentially enable continuous assessment of cerebral oxygen extraction. Further, this development would provide an opportunity for the clinician to make informed decisions in balancing systemic hemodynamics to achieve optimal cerebral oxygen delivery.
Near-infrared spectroscopy (NIRS) is a widely accepted noninvasive modality for quantifying blood volume and oxygen saturation . Although it is mostly used to measure tissue oxygen saturation, a handful of publications have shown that NIRS can measure venous oxygen saturation. Typically, such schemes require a functional perturbation of cerebral blood volume to isolate the venous component of the optical signal, such as tilting of the head or venous occlusion . However, these measurements are feasible only during perturbation and thus do not offer the possibility of continuous monitoring of SvO 2 . Furthermore, the potential to use such perturbations in clinical settings is limited. Postural manipulation in preterm infants, for example, has been shown to cause changes in intracranial pressure, increasing the risk of intracranial hemorrhage .
Get Radiology Tree app to read full this article<
Materials and methods
Population
Get Radiology Tree app to read full this article<
Get Radiology Tree app to read full this article<
Get Radiology Tree app to read full this article<
Study Protocol
Get Radiology Tree app to read full this article<
Get Radiology Tree app to read full this article<
NIRS: Theory, Instrumentation, and Analysis
Get Radiology Tree app to read full this article<
Δμa(λ,t)=log[I(λ,t)/I0(λ)]r×DPF(λ). Δ
μ
a
(
λ
,
t
)
=
log
[
I
(
λ
,t
)
/
I
0
(
λ
)
]
r
×
D
P
F
(
λ
)
.
Get Radiology Tree app to read full this article<
Get Radiology Tree app to read full this article<
![Figure 2, Sample time series of differential (Δ) oxyhemoglobin (Δ[Hb]) (a) and deoxyhemoglobin ([ΔHbO 2 ]) (b) . Fast Fourier transform (FFT) of the Δ[Hb] time series (c) and the Δ[HbO 2 ] time series (d) . The dashed lines indicate the respiration rate, the second harmonic of the respiration rate, and the heart rate. The bottom two plots show sample time series of Δ[Hb] (e) and Δ[HbO 2 ] (f) after bandpass filtering at the respiration rate/frequency.](https://storage.googleapis.com/dl.dentistrykey.com/clinical/NoninvasiveOpticalQuantificationofCerebralVenousOxygenSaturationinHumans/1_1s20S1076633213005011.jpg)
Get Radiology Tree app to read full this article<
Get Radiology Tree app to read full this article<
Get Radiology Tree app to read full this article<
SvONIRS2=AΔ[HbO2]respAΔ[Hb]resp+AΔ[HbO2]resp×100% SvO
2
N
I
R
S
=
A
Δ
[
H
b
O
2
]
r
e
s
p
A
Δ
[
H
b
]
r
e
s
p
+
A
Δ
[
H
b
O
2
]
r
e
s
p
×
100
%
Get Radiology Tree app to read full this article<
Get Radiology Tree app to read full this article<
Get Radiology Tree app to read full this article<
![Figure 3, Flowchart of data processing. Δμ a (λ), change in the wavelength-dependent absorption property of tissue; Δ[Hb], change in deoxy-hemoglobin; ΔHbO 2 , change in oxy-hemoglobin; SNR, signal-to-noise ratio; SvONIRS2 SvO2NIRS , venous saturation measured noninvasively with near-infrared spectroscopy.](https://storage.googleapis.com/dl.dentistrykey.com/clinical/NoninvasiveOpticalQuantificationofCerebralVenousOxygenSaturationinHumans/2_1s20S1076633213005011.jpg)
Get Radiology Tree app to read full this article<
Statistical Analysis
Get Radiology Tree app to read full this article<
Results
Validation Study
Get Radiology Tree app to read full this article<
Table 1
Median (IQR) of Patient Demographics
Median (IQR) Age (y) 5.3 (1.3, 9.7) Weight (kg) 15.3 (8.7, 24.1) Height (cm) 99.9 (69.9, 124.8) Sex (male:female) 5:5
IQR, interquartile range.
Get Radiology Tree app to read full this article<
Get Radiology Tree app to read full this article<
Table 2
Median (IQR) of Patient Measurements during Cardiac Catheterization
Median (IQR) Respiration rate (breaths/min) 20 (17, 20) Heart rate (beats/min) 103 (87, 134)SVOSVC2 SVO
2
SVC (%) 64 (62, 67)SvONIRS2 SvO
2
NIRS (%) 59.6 (56.4, 65.9)SNRHb S
N
R
H
b 50.0 (16.5, 111.0)SNRHbO2 S
N
R
H
b
O
2 25.5 (18.4, 51.8)
IQR, interquartile range; SNRHb S
N
R
H
b , signal-to-noise ratio of the deoxy-hemoglobin signal; SNRHbO2 S
N
R
H
b
O
2 , signal-to-noise ratio of the oxy-hemoglobin signal; SvONIRS2 SvO
2
NIRS , venous saturation measured noninvasively with near-infrared spectroscopy; SVOSVC2 SVO
2
SVC , cerebral venous oxygen saturation from a superior vena cava blood sample.
Get Radiology Tree app to read full this article<
Healthy Volunteers
Get Radiology Tree app to read full this article<
Discussion
Get Radiology Tree app to read full this article<
Get Radiology Tree app to read full this article<
Get Radiology Tree app to read full this article<
Get Radiology Tree app to read full this article<
Conclusions
Get Radiology Tree app to read full this article<
Acknowledgments
Get Radiology Tree app to read full this article<
References
1. Schell R.M.: Cerebral monitoring: jugular venous oximetry. Anesthes Analg 2000; 90: pp. 559-566.
2. Raad I.: Intravascular-catheter-related infections. Lancet 1998; 351: pp. 893-898.
3. Ruesch S., Walder B., Tramèr M.R.: Complications of central venous catheters: internal jugular versus subclavian access–a systematic review. Crit Care Med 2002; 30: pp. 454-460.
4. Yodh A., Chance B.: Spectroscopy and imaging with diffusing light. Phys Today 1995; 48: pp. 34-40.
5. Owen-Reece H., Smith M., Elwell C.E., et. al.: Near infrared spectroscopy. Br J Anesth 1999; 82: pp. 418-426.
6. Durduran T., Choe R., Baker W.B., et. al.: Diffuse optics for tissue monitoring and tomography. Rep Progr Phys 2010; pp. 73.
7. Nitzan M., Babchenko A., Khanokh B., et. al.: Measurement of oxygen saturation in venous blood by dynamic near infrared spectroscopy. J Biomed Opt 2000; 5: pp. 155-162.
8. Skov L., Pryds O., Greisen G., et. al.: Estimation of cerebral venous saturation in newborn infants by near infrared spectroscopy. Pediatr Res 1993; 33: pp. 52-55.
9. Yoxall C.W., Weindling A.M., Dawani N.H., et. al.: Measurement of cerebral venous oxyhemoglobin saturation in children by near-infrared spectroscopy and partial jugular venous occlusion. Pediatr Res 1995; 38: pp. 319-323.
10. Goldberg R.N., Joshi A., Moscoso P., et. al.: The effect of head position on intracranial pressure in the neonate. Crit Care Med 1983; 11: pp. 428-430.
11. Brown D., Haensse D., Bauschatz A., et. al.: NIRS measurement of venous oxygen saturation in the adult human head. Adv Exp Med Biol 2006; 578: pp. 251-256.
12. Franceschini M.A., Boas D.A., Zourabian A., et. al.: Near-infrared spiroximetry: noninvasive measurements of venous saturation in piglets and human subjects. J Appl Physiol 2002; 92: pp. 372-384.
13. Leung T.S., Tisdall M.M., Tachtsidis I., et. al.: Cerebral tissue oxygen saturation calculated using low frequency haemoglobin oscillations measured by near infrared spectroscopy in adult ventilated patients. Adv Exp Med Biol 2008; 614: pp. 235-244.
14. Wolf M., Duc G., Keel M., et. al.: Continuous noninvasive measurement of cerebral arterial and venous oxygen saturation at the bedside in mechanically ventilated neonates. Cri Care Med 1997; 25: pp. 1579-1582.
15. Klabunde E.: Cardiovascular physiology concepts.2nd ed.2011.Lippincott Williams & WilkinsBaltimore, MD
16. Duncan A., Meek J.H., Clemence M., et. al.: Measurement of cranial optical path length as a function of age using phase resolved near infrared spectroscopy. Pediatr Res 1996; 39: pp. 889-894.
17. R Development Core Team: R: A Language and Environment for Statistical Computing.2011.R Foundation for Statistical ComputingVienna, Austria
18. Lin L.I.: A concordance correlation coefficient to evaluate reproducibility. Biometrics 1989; 45: pp. 255-268.
19. Bland J.M., Altman D.G.: Statistical methods for assessing agreement between two methods of clinical measurement. Lancet 1986; 1: pp. 307.
20. Barratt-Boyes B.G., Wood E.H.: The oxygen saturation of blood in the venae cavae, right-heart chambers, and pulmonary vessels of healthy subjects. J Lab Clin Med 1957; 50: pp. 93-106.