
Rationale and Objectives
Based on their association with malignant proliferation, using noninvasive phosphorus MR spectroscopic imaging ( 31 P MRSI), we measured the tumor content of the phospholipid-related phosphomonoesters (PME), phosphoethanolamine and phospholcholine, and its correlation with treatment outcome in newly diagnosed patients with diffuse large B-cell lymphoma (DLBCL) receiving standard first-line chemotherapy.
Experimental Design
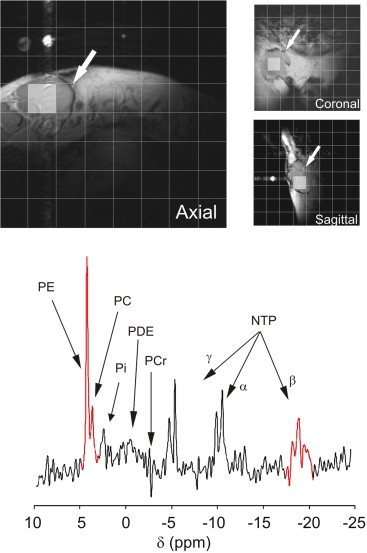
The PME value normalized to nucleoside triphosphates (PME/NTP) was measured using 31 P MRSI in tumor masses of 20 patients with DLBCL before receiving standard first-line chemotherapy. Response at 6 months was complete in 13 patients and partial in seven. Time to treatment failure (TTF) was ≤11 months in eight patients, from 18 to 30 months in three, and ≥60 months in nine.
Results
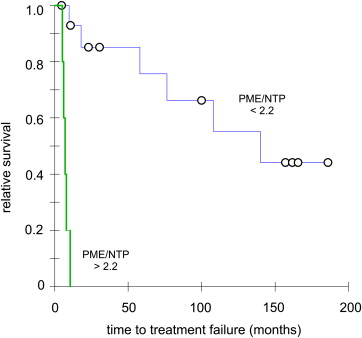
On a t test, the pretreatment tumor PME/NTP mean value (SD, n ) of patients with a complete response at 6 months was 1.42 (0.41, 13), which was significantly different from the value of 2.46 (0.40, 7) in patients with partial response ( P < .00001). A Fisher test significantly correlated the PME/NTP values with response at 6 months (sensitivity and specificity at 0.85, P < .004) while a Cox proportional hazards regression significantly correlated the PME/NTP values with TTF (hazard ratio = 5.21, P < .02). A Kaplan–Meier test set apart a group entirely composed of patients with TTF ≤ 11 months (hazard ratio = 8.66, P < .00001).
Conclusions
The pretreatment tumor PME/NTP values correlated with response to treatment at 6 months and time to treatment failure in newly diagnosed patients with DLBCL treated with first-line chemotherapy, and therefore they could be used to predict treatment outcome in these patients.
For many cancer patients, established first-line therapies are either ineffective or initially effective but not curative. For instance, 63% of patients with diffuse large B-cell lymphoma (DLBCL) show a complete response to first-line therapy, but only 40% have prolonged survival . An a priori method to identify unresponsive patients to standard treatments would be of extreme value to offer these patients alternate treatment options, thereby maximizing therapeutic success, sparing toxicity, and lowering health care costs.
Newly diagnosed patients with DLBCL receive equivalent first-line chemotherapy regardless of the substandard treatment outcome on a large number of patients. Over the years, the most common regimen has been CHOP, a doxorubicin-based drug cocktail with added cyclophosphamide, vincristine, and prednisone . Other first-line multidrug treatments can be used to treat DLBCL but their mechanisms of action and response rates are similar to CHOP; therefore, they are considered comparable (CHOP-like therapy). Only recently, rituximab has been added to first-line regimens to treat DLBCL (ie, R-CHOP) increasing relapse-free and overall survival . However, even though rituximab has improved treatment outcome, still a significant proportion of patients experience early treatment failure, partial response, or recurrence. A method that could appropriately and timely identify high-risk newly diagnosed patients with DLBCL bound to be unresponsive to the established first-line therapies should allow early consideration of alternate treatments, like high-dose therapy, autologous stem cell transplantation , and/or promising new agents that target cellular signaling processes , with the aim to maximize therapeutic success in high-risk patients without compromising those patients who will respond to the present standard of care.
Get Radiology Tree app to read full this article<
Get Radiology Tree app to read full this article<
Get Radiology Tree app to read full this article<
Patients and methods
Patients
Get Radiology Tree app to read full this article<
Study Design
Get Radiology Tree app to read full this article<
Get Radiology Tree app to read full this article<
Assay Method
Get Radiology Tree app to read full this article<
Get Radiology Tree app to read full this article<
Get Radiology Tree app to read full this article<
Get Radiology Tree app to read full this article<
Statistical Analyses
Get Radiology Tree app to read full this article<
Results
Patient Population
Get Radiology Tree app to read full this article<
Table 1
Clinical and Biological Characteristics of the Cohort of Patients with Diffuse Large B-Cell Lymphoma
Treatment No. Gender Age Stage IPI ∗ RT6 m † TTF ‡ PME/NTP § CHOP ⋮ 1 F 68 II 1 CR +23.0 2.16 2 F 49 I 2 CR 18.0 0.84 3 F 48 II 0 CR +186.0 1.52 4 M 29 IV 1 PR 9.8 1.85 5 M 59 III 1 PR 8.0 2.83 6 F 68 IV 2 CR +165.7 1.32 7 M 53 II 1 CR +157.1 1.92 8 F 51 III 2 CR +161.8 1.88 9 M 77 II 3 PR +4.7 1.97 10 F 74 IV 3 CR 140.0 1.32 11 M 63 III 1 CR 76.4 1.51 12 M 53 II 1 CR 108.1 1.39 ProMACE-CytaBOM ¶ 13 F 19 III 0 CR +100.0 1.43 CHOP plus ICE # 14 F 47 IV 4 PR 5.2 2.86 CNOP ∗∗ 15 M 48 IV 2 CR 58.0 0.86 PMitCEBO †† 16 M 85 III 3 PR 7.1 2.59 CHOP-like 17 M 70 III 4 PR 10.5 2.50 (not specified) 18 F 66 IV 2 PR 6.1 2.65 19 M 65 I 3 CR +30.6 1.46 20 M 58 III 2 CR +10.8 0.89
Get Radiology Tree app to read full this article<
Get Radiology Tree app to read full this article<
Get Radiology Tree app to read full this article<
Get Radiology Tree app to read full this article<
Get Radiology Tree app to read full this article<
Get Radiology Tree app to read full this article<
Get Radiology Tree app to read full this article<
Get Radiology Tree app to read full this article<
Get Radiology Tree app to read full this article<
Get Radiology Tree app to read full this article<
Get Radiology Tree app to read full this article<
Descriptive Statistics
Get Radiology Tree app to read full this article<
Table 2
Student t Test Analysis of the Correlation of Response to Treatment at 6 Months with the Pretreatment Tumor PME/NTP and IPI Parameters
Complete Response ∗ Partial Response ∗ P † Mean SD_n_ Mean SD_n_ PMR 1.42 0.21 13 2.46 0.40 7 .00001 IPI ‡ 2 1 13 3 1 7 .06
SD, standard deviation; n, number of observations.
Get Radiology Tree app to read full this article<
Get Radiology Tree app to read full this article<
Get Radiology Tree app to read full this article<
Table 3
Fisher Probability Analysis of the Correlation of Response to Treatment at 6 Months with the Pretreatment Tumor PME/NTP and IPI Using the Maximum of the Youden Index for Comparative Purposes (left and middle truth tables, respectively) and the Pretreatment Tumor PME/NTP Using the Cutoff for Maximum Sensitivity (right truth table)
Treatment Response Treatment Response Treatment Response CR PR Total CR PR Total CR PR Total PME/NTP ≤ 1.92 12 1 13 IPI ≤ 2.0 11 3 14 PME/NTP ≤ 2.2 13 2 15 > 1.92 1 6 7 > 2.0 2 4 6 > 2.2 0 5 5 total 13 7 20 total 13 7 20 total 13 7 20 accuracy = 0.90
prevalence = 0.65
sensitivity = 0.92
specificity = 0.86
false-negative rate = 0.08
false-positive rate = 0.14
positive predictive value = 0.92
negative predictive value = 0.86
P < .001 accuracy = 0.75
prevalence = 0.65
sensitivity = 0.85
specificity = 0.57
false-negative rate = 0.15
false-positive rate = 0.43
positive predictive value = 0.79
negative predictive value = 0.86
P < .07 accuracy = 0.90
prevalence = 0.65
sensitivity = 1.00
specificity = 0.71
false-negative rate = 0.00
false-positive rate = 0.29
positive predictive value = 0.87
negative predictive value = 1.00
P < .001
CR, complete response; PR, partial response.
Get Radiology Tree app to read full this article<
Survival Tests
Get Radiology Tree app to read full this article<
Power Calculations
Get Radiology Tree app to read full this article<
Discussion
Get Radiology Tree app to read full this article<
Get Radiology Tree app to read full this article<
Get Radiology Tree app to read full this article<
Get Radiology Tree app to read full this article<
Get Radiology Tree app to read full this article<
Acknowledgments
Get Radiology Tree app to read full this article<
Get Radiology Tree app to read full this article<
Get Radiology Tree app to read full this article<
Get Radiology Tree app to read full this article<
References
1. DeVita V., Hellman S., Rosneber S.: Cancer: principles and practice of oncology.7th ed.2001.Lippincott, Williams and WilkinsPhiladelphia, PA
2. Rosen S.T., Molina A., Winter J.N., et. al.: Non-Hodgkin’s lymphoma.Pazdur R.Hoskins W.J.Wagman L.D.Cancer management: a multidisciplinary approach.2003.The Oncology GroupNew York:pp. 665-712.
3. Coiffier B., Lepage E., Briere J., et. al.: CHOP chemotherapy plus rituximab compared to CHOP alone in elderly patients with diffuse large-B-cell lymphoma. N Engl J Med 2002; 346: pp. 235-242.
4. Coiffier B.: Rituximab and CHOP-like chemotherapy in good-prognosis diffuse large-B-cell lymphoma. Nat Clin Pract Oncol 2006; 3: pp. 594-595.
5. Philip T., Guglielmi C., Hagenbeek A., et. al.: Autologous bone marrow transplantation as compared to salvage chemotherapy in relapses of chemotherapy-sensitive non-Hodgkin’s lymphoma. N Engl J Med 1995; 333: pp. 1540-1545.
6. O’Connor O.A., Pro B., Pinter-Brown L., et. al.: Pralatrexate in patients with relapsed or refractory peripheral T-cell lymphoma: results from the pivotal PROPEL study. J Clin Oncol 2011; 29: pp. 1182-1189.
7. Zain J.M., O’Connor O.: Targeted treatment and new agents in peripheral T-cell lymphoma. Int J Hematol 2010; 92: pp. 33-44.
8. Wilson W.H., Hernandez-Ilizaliturri F.J., Dunleavy K., et. al.: Novel disease targets and management approaches for diffuse large B-cell lymphoma. Leuk Lymphoma 2010; 51: pp. 1-10.
9. O’Connor O.A.: Novel agents in development for peripheral T-cell lymphoma. Semin Hematol 2010; 47: pp. S11-S14.
10. Sasaki M., Kuwabara Y., Koga H., et. al.: Clinical impact of whole body FDG-PET on the staging and therapeutic decision making for malignant lymphoma. Annal Nucl Med 2002; 16: pp. 337-345.
11. Hoskin P.J.: PET in lymphoma: what are the oncologist’s needs?. Eur J Nucl Med Mol Imaging 2003; 30: pp. S37-S41.
12. Kasamon Y.L., Wahl R.L., Swinnen L.J.: FDG PET and high-dose therapy for aggressive lymphomas: toward a risk-adapted strategy. Curr Opin Oncol 2004; 16: pp. 100-105.
13. Kostakoglu L., Leonard J.P., Coleman M., et. al.: The role of FDG-PET imaging in the management of lymphoma. Clin Adv Hematol Oncol 2004; 2: pp. 115-121.
14. Arias-Mendoza F., Smith M.R., Brown T.R.: Predicting treatment response in non-Hodgkin’s lymphoma from the pretreatment tumor content of phosphoethanolamine plus phosphocholine. Acad Radiol 2004; 11: pp. 368-376.
15. Franks S., Smith M., Arias-Mendoza F., et. al.: Phosphomonoester concentrations differ between chronic lymphocytic leukemia cells and normal human lymphocytes. Leuk Res 2002; 26: pp. 919.
16. Lee S.-C., Arias-Mendoza F., Poptani H., et. al.: Prediction and early detection of respone by NMR spectroscopy and imaging. PET Clin 2012; 7: pp. 119-126.
17. Moskowitz C.H.: Interim PET-CT in the management of diffuse large B-cell lymphoma. Hematol Am Soc Hematol Educ Program 2012; 2012: pp. 397-401.
18. Moskowitz C.H., Zelenetz A., Schoder H.: An update on the role of interim restaging FDG-PET in patients with diffuse large B-cell lymphoma and Hodgkin lymphoma. J Natl Compre Cancer Network: JNCCN 2010; 8: pp. 347-352.
19. Moskowitz C.H., Schoder H., Teruya-Feldstein J., et. al.: Risk-adapted dose-dense immunochemotherapy determined by interim FDG-PET in Advanced-stage diffuse large B-Cell lymphoma. J Clin Oncol 2010; 28: pp. 1896-1903.
20. Podo F.: Tumour phospholipid metabolism. NMR Biomed 1999; 12: pp. 413-439.
21. Arias-Mendoza F., Payne G.S., Zakian K.L., et. al.: In vivo 31 P MR spectral patterns and reproducibility in cancer patients studied in a multi-institutional trial. NMR Biomed 2006; 19: pp. 504-512.
22. Ronen S.M., Jackson L.E., Beloueche M., et. al.: Magnetic resonance detects changes in phosphocholine associated with Ras activation and inhibition in NIH 3T3 cells. Br J Cancer 2001; 84: pp. 691-696.
23. McShane L.M., Altman D.G., Sauerbrei W., et. al.: Reporting recommendations for tumor marker prognostic studies (REMARK). J Natl Cancer Inst 2005; 97: pp. 1180-1184.
24. Cheson B.D., Horning S.J., Coiffier B., et. al.: Report of an international workshop to standardize response criteria for non-Hodgkin’s lymphomas. NCI Sponsored International Working Group. J Clin Oncol 1999; 17: pp. 1244.
25. Anonymous. Dictionary of Cancer Terms in, http://www.cancer.gov/dictionary/ . Accessed 2008.
26. Anonymous : A predictive model for aggressive non-Hodgkin’s lymphoma. The International Non-Hodgkin’s Lymphoma Prognostic Factors Project. N Engl J Med 1993; 329: pp. 987-994.
27. Cohen J.: Statistical power analysis for the behavioral sciences.Second ed.1988.Lawrence Erlbaum AssociatesMahwah, NJ
28. Faul F., Erdfelder E., Buchner A., et. al.: Statistical power analyses using G*Power 3.1: tests for correlation and regression analyses. Behav Res Methods 2009; 41: pp. 1149-1160.
29. Fisher R.I., Miller T.P., O’Connor O.A.: Diffuse aggressive lymphoma. Hematol Am Soc Hematol Educ Program 2004; pp. 221-236.
30. Miller T.P., Jones S.E.: Chemotherapy of localised histiocytic lymphoma. Lancet 1979; 1: pp. 358-360.
31. Ziepert M., Hasenclever D., Kuhnt E., et. al.: Standard International prognostic index remains a valid predictor of outcome for patients with aggressive CD20+ B-cell lymphoma in the rituximab era. J Clin Oncol 2010; 28: pp. 2373-2380.
32. Agarwal M.L., Larkin H.E., Zaidi S.I., et. al.: Phospholipase activation triggers apoptosis in photosensitized mouse lymphoma cells. Cancer Res 1993; 53: pp. 5897-5902.
33. Ferguson J.E., Hanley M.R.: The role of phospholipases and phospholipid-derived signals in cell activation. Curr Opin Cell Biol 1991; 3: pp. 206-212.
34. Bertagnolo V., Benedusi M., Brugnoli F., et. al.: Phospholipase C-beta 2 promotes mitosis and migration of human breast cancer-derived cells. Carcinogenesis 2007; 28: pp. 1638-1645.
35. Ramoni C., Spadaro F., Barletta B., et. al.: Phosphatidylcholine-specific phospholipase C in mitogen-stimulated fibroblasts. Exp Cell Res 2004; 299: pp. 370-382.
36. Spadaro F., Ramoni C., Mezzanzanica D., et. al.: Phosphatidylcholine-specific phospholipase C activation in epithelial ovarian cancer cells. Cancer Res 2008; 68: pp. 6541-6549.
37. Iorio E., Ricci A., Bagnoli M., et. al.: Activation of phosphatidylcholine cycle enzymes in human epithelial ovarian cancer cells. Cancer Res 2010; 70: pp. 2126-2135.
38. Paris L., Cecchetti S., Spadaro F., et. al.: Inhibition of phosphatidylcholine-specific phospholipase C downregulates HER2 overexpression on plasma membrane of breast cancer cells. Breast Cancer Res 2010; 12: pp. R27.
39. Alizadeh A.A., Eisen M.B., Davis R.E., et. al.: Distinct types of diffuse large B-cell lymphoma identified by gene expression profiling. Nature 2000; 403: pp. 503-511.
40. Rosenwald A., Wright G., Chan W.C., et. al.: The use of molecular profiling to predict survival after chemotherapy for diffuse large-B-cell lymphoma. N Engl J Med 2002; 346: pp. 1937-1947.
41. Zinzani P.L., Broccoli A., Stefoni V., et. al.: Immunophenotype and intermediate-high international prognostic index score are prognostic factors for therapy in diffuse large B-cell patients with lymphoma. Cancer 2010; 116: pp. 5667-5675.
42. Nasr MR, Rosenthal N, Syrbu S. Expression profiling of transcription factors in B- or T-acute lymphoblastic leukemia/lymphoma and burkitt lymphoma: usefulness of PAX5 immunostaining as pan-Pre-B-cell marker. Am J Clin Pathol. 133(1):41–8.
43. Choi W.W., Weisenburger D.D., Greiner T.C., et. al.: A new immunostain algorithm classifies diffuse large B-cell lymphoma into molecular subtypes with high accuracy. Clin Cancer Res 2009; 15: pp. 5494-5502.