
Rationale and Objectives
The aim of this study was to evaluate the value of contrast-enhanced gray-scale sonography in quantitative assessment of synovial pannus angiogenesis in antigen-induced arthritis in rabbits.
Materials and Methods
Twenty-four adult New Zealand White rabbits were divided into two groups. Inflammatory arthritis was induced by intra-articular injection of ovalbumin into right knee joints with 4 mg in low-dose group (LD, n = 12) and 8 mg in high-dose group (HD, n = 12). The left side of the knee on each rabbit was used as normal control. Contrast-enhanced gray-scale sonography with time intensity curve (TIC) was performed on the synovia of suprapatellar bursa and posterior capsules 4 weeks after the injection. Immunohistochemical examinations of synovia were applied to assess the microvessel density and the expression of vascular endothelial growth factor. Correlation analysis between sonographic and immunohistochemical findings was performed.
Results
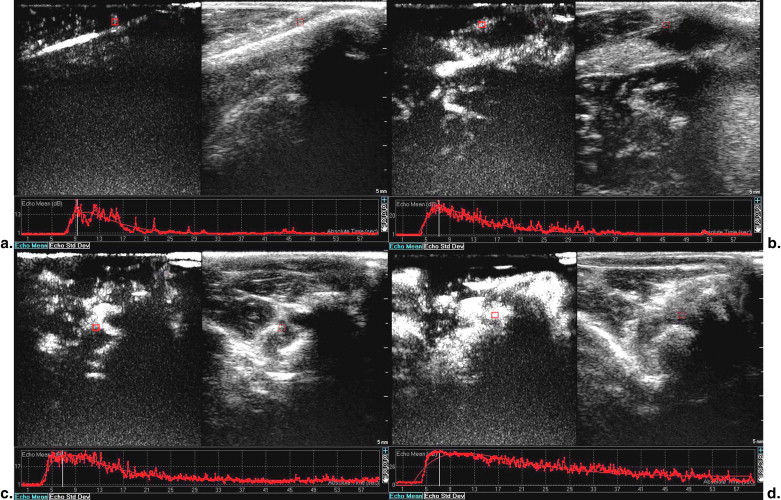
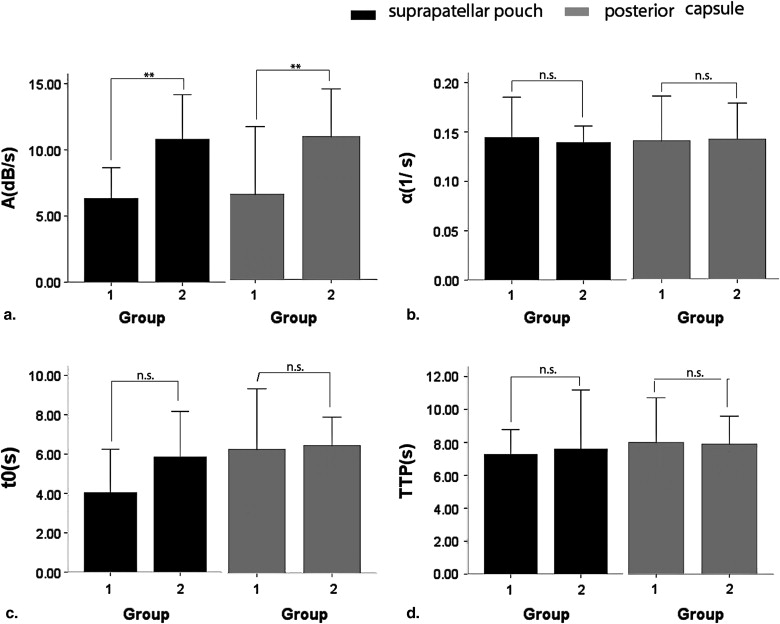
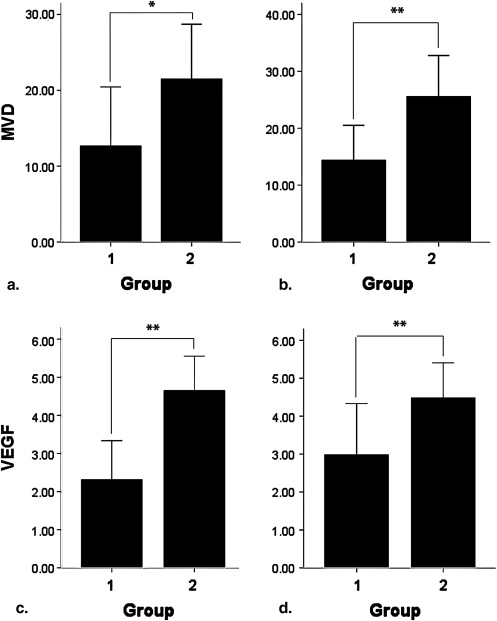
Contrast-enhanced gray-scale sonography of all right knees demonstrated intra-articular hypoechoic lesions with enhanced blood flow and no abnormal findings on all left knees. Parameters of TIC, including ascending curve (A), derived peak intensity (DPI), and area under curve (AUC) on arthritis joints were significantly higher in HD group compared to LD group ( P < .05). Positive correlation was found between immunohistochemical findings and parameters of A, DPI, and AUC ( P < .05). However, no correlation was found between other parameters (slope of descending rate, time to peak, time to rise, and initial intensity) and immunohistochemical findings.
Conclusions
Contrast-enhanced gray-scale sonography with TIC measurement could provide reliable method for noninvasive quantitative assessment of synovial pannus angiogenesis of arthritis in clinical settings.
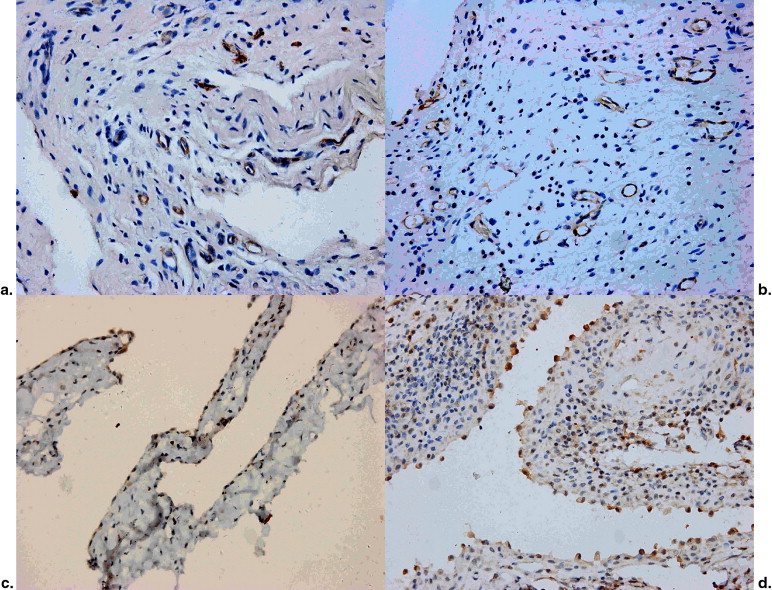
Rheumatoid arthritis (RA) is a chronic systematic autoimmune disorder that principally attacks synovial joints, especially small joints of the hands and feet. It is mainly characterized by massive synovial proliferation and changes in synovial architecture resulting in interdigitating folds of tissue, termed pannus . Recurrent inflammation leads to the destruction of the cartilage, bones, and ligaments, causing deformity and loss of function. The formation of active inflamed pannus is central to this erosive disease. Synovial vascularity is correlated with disease activity and response to therapy . Studies showed that angiogenesis was regulated by a complex set of inducers and inhibitors. Of these, vascular endothelial growth factor (VEGF) is a potent endothelial cell–specific growth factor involved in inflammatory activities. However, histologic measurement of microvessel density (MVD) and VEGF of synovial tissue is invasive and impractical in clinical settings . Therefore, the introduction of a noninvasive and efficient alternative is of great important and necessary.
The development of color and power Doppler sonography was a complement of the conventional gray-scale sonography. However, sensitivity and quantification cannot be perfectly achieved by these imaging techniques. The introduction of contrast-enhanced gray-scale sonography has made imaging of synovial microvessels possible. This imaging technique exploits the nonlinear oscillations of microbubbles that produce harmonic overtones of the original sound wave . It allows dynamic measurement of region of interest (ROI) to achieve quantitative assessment of blood flow in synovial pannus at the microvascular level . However, there were deficient studies using quantification parameters of time-intensity curve (TIC) for assessing the degree of RA. The following questions have to be addressed before its clinical application. Can the TIC parameters achieved from contrast-enhanced gray-scale sonography quantitatively evaluate the activity and the treatment effectiveness of RA? Is it possible, hence, with the new method to display the microperfusion of synovial pannus, to determine the valuable parameters to assess the activity of RA?
Get Radiology Tree app to read full this article<
Materials and methods
Antigen-induced Arthritis Model in the Rabbit Joint
Get Radiology Tree app to read full this article<
Get Radiology Tree app to read full this article<
Contrast-enhanced Sonographic Technique
Get Radiology Tree app to read full this article<
Get Radiology Tree app to read full this article<
Immunohistochemical Studies of Synovial Pannus
Get Radiology Tree app to read full this article<
Get Radiology Tree app to read full this article<
Get Radiology Tree app to read full this article<
Statistical Analysis
Get Radiology Tree app to read full this article<
Results
Comparison of Contrast-enhanced Sonography between Two Groups
Get Radiology Tree app to read full this article<
Get Radiology Tree app to read full this article<
Get Radiology Tree app to read full this article<
Get Radiology Tree app to read full this article<
Get Radiology Tree app to read full this article<
Comparison of Immunohistochemical Findings between Two Groups
Get Radiology Tree app to read full this article<
Get Radiology Tree app to read full this article<
Correlation between Contrast-enhanced Sonography and Immunohistochemical Findings
Get Radiology Tree app to read full this article<
![Figure 5, Graphs show correlations between time intensity curve (TIC) parameters and immunohistochemical findings (microvessel density [MVD] and vascular endothelial growth factor [VEGF]). The graphs of a-j were generated from the suprapatellar bursa and the graphs of c-l were generated from the posterior capsule. Positive correlations were found between parameters of ascending curve (a) , derived peak intensity (DPI), area under curve (AUC), and MVD/VEGF.](https://storage.googleapis.com/dl.dentistrykey.com/clinical/NoninvasiveQuantitativeAssessmentofSynovialPannusAngiogenesisbyContrastenhancedGrayscaleSonographyinAntigeninducedArthritisinRabbits/4_1s20S1076633210005751.jpg)
Get Radiology Tree app to read full this article<
Discussion
Get Radiology Tree app to read full this article<
Get Radiology Tree app to read full this article<
Get Radiology Tree app to read full this article<
Get Radiology Tree app to read full this article<
Get Radiology Tree app to read full this article<
Get Radiology Tree app to read full this article<
Get Radiology Tree app to read full this article<
Get Radiology Tree app to read full this article<
Get Radiology Tree app to read full this article<
Get Radiology Tree app to read full this article<
References
1. Emery P., Gabay C., Kraan M., et. al.: Evidence-based review of biologic markers as indicators of disease progression and remission in rheumatoid arthritis. Rheumatol Int 2007; 27: pp. 793-806.
2. Bodolay E., Koch A.E., Kim J., et. al.: Angiogenesis and chemokines in rheumatoid arthritis and other systemic inflammatory rheumatic diseases. J Cell Mol Med 2002; 6: pp. 357-367.
3. Schmitt-Sody M., Landes J., Zysk S.P., et. al.: Quantitative assessment of angiogenesis in murine antigen-induced arthritis by intravital fluorescence microscopy. J Vasc Res 2003; 40: pp. 460-466.
4. Szekanecz Z., Besenyei T., Paragh G., et. al.: Angiogenesis in rheumatoid arthritis. Autoimmunity 2009; 42: pp. 563-573.
5. Taylor P.C.: Serum vascular markers and vascular imaging in assessment of rheumatoid arthritis disease activity and response to therapy. Rheumatology (Oxford) 2005; 44: pp. 721-728.
6. Boutry N., Morel M., Flipo R.M., et. al.: Early rheumatoid arthritis: a review of MRI and sonographic findings. Am J Roentgenol 2007; 189: pp. 1502-1509.
7. Schueller-Weidekamm C., Krestan C., Schueller G., et. al.: Power Doppler sonography and pulse-inversion harmonic imaging in evaluation of rheumatoid arthritis synovitis. Am J Roentgenol 2007; 188: pp. 504-508.
8. Stone M., Bergin D., Whelan B., et. al.: Power Doppler ultrasound assessment of rheumatoid hand synovitis. J Rheumatol 2001; 28: pp. 1979-1982.
9. Okura T., Marutsuka K., Hamada H., et. al.: Therapeutic efficacy of intra-articular adrenomedullin injection in antigen-induced arthritis in rabbits. Arthritis Res Ther 2008; 10: pp. R133.
10. Kristensen K.D., Stoustrup P., Küseler A., et. al.: Quantitative histological changes of repeated antigen-induced arthritis in the temporomandibular joints of rabbits treated with intra-articular corticosteroid. J Oral Pathol Med 2008; 37: pp. 437-444.
11. Appel H., Loddenkemper C., Miossec P.: Rheumatoid arthritis and ankylosing spondylitis pathology of acute inflammation. Clin Exp Rheumatol 2009; 27: pp. S15-S19.
12. Choi S.T., Kim J.H., Seok J.Y., et. al.: Therapeutic effect of anti-vascular endothelial growth factor receptor I antibody in the established collagen-induced arthritis mouse model. Clin Rheumatol 2009; 28: pp. 333-337.
13. Szekanecz Z., Besenyei T., Szentpétery A., et. al.: Angiogenesis and vasculogenesis in rheumatoid arthritis. Curr Opin Rheumatol 2010; 22: pp. 299-306.
14. Mousa S.A., Mousa S.S.: Current status of vascular endothelial growth factor inhibition in age-related macular degeneration. BioDrugs 2010; 24: pp. 183-194.
15. Szekanecz Z., Besenyei T., Paragh G., et. al.: New insights in synovial angiogenesis. Joint Bone Spine 2010; 77: pp. 13-19.
16. Taylor P.C.: VEGF and imaging of vessels in rheumatoid arthritis. Arthritis Res 2002; 4: pp. S99-S107.
17. Schmidt W.A., Völker L., Zacher J., et. al.: Colour Doppler ultrasonography to detect pannus in knee joint synovitis. Clin Exp Rheumatol 2000; 18: pp. 439-444.
18. Forsberg F., Ro R.J., Potoczek M., et. al.: Assessment of angiogenesis: implications for ultrasound imaging. Ultrasonics 2004; 42: pp. 325-330.
19. Doria A.S., Kiss M.H., Lotito A.P., et. al.: Juvenile rheumatoid arthritis of the knee: evaluation with contrast-enhanced color Doppler ultrasound. Pediatr Radiol 2001; 31: pp. 524-531.
20. Tsubaki T., Arita N., Kawakami T., et. al.: Characterization of histopathology and gene-expression profiles of synovitis in early rheumatoid arthritis using targeted biopsy specimens. Arthritis Res Ther 2005; 7: pp. R825-R836.
21. Carotti M., Salaffi F., Manganelli P., et. al.: Power Doppler sonography in the assessment of synovial tissue of the knee joint in rheumatoid arthritis: a preliminary experience. Ann Rheum Dis 2002; 61: pp. 877-882.
22. Kersting S., Konopke R., Kersting F., et. al.: Quantitative perfusion analysis of transabdominal contrast-enhanced ultrasonography of pancreatic masses and carcinomas. Gastroenterology 2009; 137: pp. 1903-1911.
23. Krix M., Krakowski-Roosen H., Kauczor H.U., et. al.: Real-time contrast-enhanced ultrasound for the assessment of perfusion dynamics in skeletal muscle. Ultrasound Med Biol 2009; 35: pp. 1587-1595.
24. Ellegaard K., Torp-Pedersen S., Lund H., et. al.: Quantification of colour Doppler activity in the wrist in patients with rheumatoid arthritis—the reliability of different methods for image selection and evaluation. Ultraschall Med 2008; 29: pp. 393-398.
25. Cyteval C.: Doppler ultrasonography and dynamic magnetic resonance imaging for assessment of synovitis in the hand and wrist of patients with rheumatoid arthritis. Semin Musculoskelet Radiol 2009; 13: pp. 66-73.
26. Platzgummer H., Schueller G., Grisar J., et. al.: Quantification of synovitis in rheumatoid arthritis: do we really need quantitative measurement of contrast-enhanced ultrasound?. Eur J Radiol 2009; 71: pp. 237-241.
27. De Zordo T., Mlekusch S.P., Feuchtner G.M., et. al.: Value of contrast-enhanced ultrasound in rheumatoid arthritis. Eur J Radiol 2007; 64: pp. 222-230.
28. Chen L.D., Xu H.X., Xie X.Y., et. al.: Intrahepatic cholangiocarcinoma and hepatocellular carcinoma: differential diagnosis with contrast-enhanced ultrasound. Eur Radiol 2010; 20: pp. 743-753.
29. Bertolotto M., Trincia E., Zappetti R., et. al.: Effect of Tadalafil on prostate haemodynamics: preliminary evaluation with contrast-enhanced US. Radiol Med 2009; 114: pp. 1106-1114.
30. Tang J., Yang J.C., Luo Y., et. al.: Enhancement characteristics of benign and malignant focal peripheral nodules in the peripheral zone of the prostate gland studied using contrast-enhanced transrectal ultrasound. Clin Radiol 2008; 63: pp. 1086-1091.
31. Barnard S., Leen E., Cooke T., et. al.: A contrast-enhanced ultrasound study of benign and malignant breast tissue. S Afr Med J 2008; 98: pp. 386-391.
32. Ignee A., Jedrejczyk M., Schuessler G., et. al.: Quantitative contrast enhanced ultrasound of the liver for time intensity curves-Reliability and potential sources of errors. Eur J Radiol 2010; 73: pp. 153-158.