
Rationale and Objectives
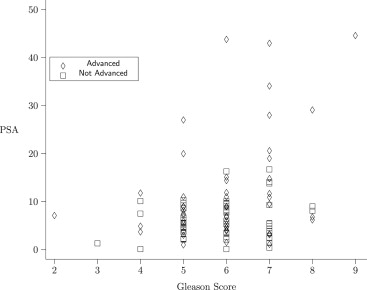
Consider a study evaluating the prognostic value of prostate-specific antigen (PSA), in the presence of Gleason score, in differentiating between early and advanced prostate cancer. This data set features subjects divided into two groups (early versus advanced cancer), with one manifest variable (PSA), one covariate (Gleason score), and one stratification variable (hospital, taking three values). We present a nonparametric method for estimating a shift in median PSA score between the two groups, after adjusting for differences in Gleason score and stratifying on hospital. This method can also be extended to cases involving multivariate manifest variable.
Materials and Methods
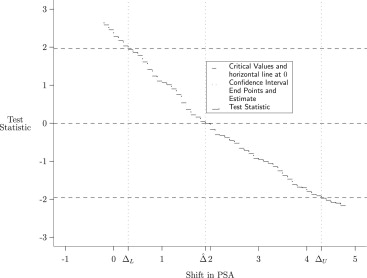
Our method uses estimating equations derived from an existing rank-based estimator of the area under the receiver operating characteristic curve (AUC). This existing AUC estimator is adjusted for stratification and for covariates. We use the adjusted AUC estimator to construct a family of tests by shifting manifest variables in one of the treatment groups by an arbitrary constant. The null hypothesis for these tests is that the AUC is half. We report the set of shift values for which the null hypothesis is not rejected as the resulting confidence region.
Results
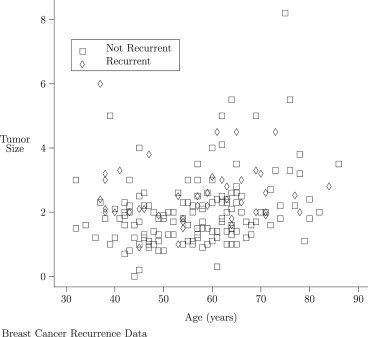
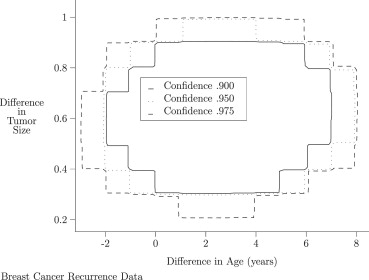
Simulated data show performance consistent with the distributional approximations used by the proposed methodology. This methodology is applied to two examples. In the first example, the mean difference in PSA levels between advanced and nonadvanced prostate cancer patients is estimated, controlling for Gleason score. In the second example, to assess the degree to which age and baseline tumor size are prognostic factors for breast cancer recurrence, differences in age and tumor size between subjects with recurrent and nonrecurrent breast cancer, stratified on Tamoxifen treatment and adjusting for tumor grade, are estimated.
Conclusions
The proposed methodology provides a nonparametric method for a statistic measuring adjusted AUC to be used to estimate shift between two manifest variables.
Serum prostate-specific antigen (PSA) and biopsy Gleason score are prognostic factors frequently used for patients screened for prostate cancer . Prognostic factors are important in clinical practice because they “have a direct impact on therapeutic planning” .
Consider a study evaluating the prognostic value of prostate-specific antigen (PSA), in the presence of Gleason score, in differentiating between early and advanced prostate cancer . This data set features subjects divided into two groups (early versus advanced cancer), with one manifest variable (PSA), one covariate (Gleason score), and one stratification variable (hospital, taking three values). These data were analyzed using Bayesian regression techniques ; readers with a radiological or medical physics background might be particularly interested in these references. Our aim is to learn about the difference between median values for PSA for subjects in the two groups. We refer to such differences in location as a shift. This problem has been well studied in the case when the separate location estimates are approximately normally distributed. Our method applies in more general situations, in which normality assumptions are not needed. We use estimating equation techniques in conjunction with the statistic of Kawaguchi et al to provide an estimate of the shift in the manifest variable coinciding with group assignment. We generate a confidence interval for the shift in PSA scores between the two outcome groups, adjusting for Gleason score. Our method generalizes to the case of multiple manifest variables, and provides a confidence region for the vector of shift parameters for all of these manifest variables. In the case with a single manifest variable and without our covariate adjustment, this model has been previously used .
Get Radiology Tree app to read full this article<
Get Radiology Tree app to read full this article<
Get Radiology Tree app to read full this article<
Get Radiology Tree app to read full this article<
Materials and methods
Get Radiology Tree app to read full this article<
Get Radiology Tree app to read full this article<
Get Radiology Tree app to read full this article<
Get Radiology Tree app to read full this article<
Get Radiology Tree app to read full this article<
Get Radiology Tree app to read full this article<
Get Radiology Tree app to read full this article<
Get Radiology Tree app to read full this article<
Get Radiology Tree app to read full this article<
Get Radiology Tree app to read full this article<
Get Radiology Tree app to read full this article<
Get Radiology Tree app to read full this article<
Results
Get Radiology Tree app to read full this article<
Get Radiology Tree app to read full this article<
Get Radiology Tree app to read full this article<
Get Radiology Tree app to read full this article<
Get Radiology Tree app to read full this article<
Get Radiology Tree app to read full this article<
Get Radiology Tree app to read full this article<
Get Radiology Tree app to read full this article<
Get Radiology Tree app to read full this article<
Get Radiology Tree app to read full this article<
Table 1
Univariate Confidence Intervals for Shift in Age and Tumor Size between Recurrent and Non-recurrent Subjects
Level Variable Lower Bound Upper Bound 0.900 Age −2.990 4.000 0.900 Size 0.400 0.899 0.950 Age −3.990 4.990 0.950 Size 0.301 0.900 0.975 Age −4.000 5.000 0.975 Size 0.301 0.900
Get Radiology Tree app to read full this article<
Get Radiology Tree app to read full this article<
Discussion
Get Radiology Tree app to read full this article<
Acknowledgments
Get Radiology Tree app to read full this article<
Appendix
Get Radiology Tree app to read full this article<
Get Radiology Tree app to read full this article<
Get Radiology Tree app to read full this article<
{Δ∣∣(W(Δ)−1/2)⊤Σˆ−1(W(Δ)−1/2)≤χ2r,α} {
Δ
|
(
W
(
Δ
)
−
1
/
2
)
⊤
Σ
ˆ
−
1
(
W
(
Δ
)
−
1
/
2
)
≤
χ
r
,
α
2
}
represents a confidence region for the offsets. Here χ2r,α χ
r
,
α
2 represents the 1−α 1
−
α quantile for the χ2r χ
r
2 distribution, and 1 is a vector with r components whose entries are all 1.
Get Radiology Tree app to read full this article<
Get Radiology Tree app to read full this article<
References
1. D’Amico A.V., Whittington R., Malkowicz S.B., et. al.: Biochemical outcome after radical prostatectomy, external beam radiation therapy, or interstitial radiation therapy for clinically localized prostate cancer. JAMA 1998; 280: pp. 969-974.
2. Zou K.H., Warfield S.K., Fielding J.R., et. al.: Statistical validation based on parametric receiver operating characteristic analysis of continuous classification data. Acad Radiol 2003; 10: pp. 1359-1368.
3. O’Malley A., Zou K.H., Fielding J.R., et. al.: Bayesian regression methodology for estimating a receiver operating characteristic curve with two radiologic applications: prostate biopsy and spiral ct of ureteral stones. Acad Radiol 2001; 8: pp. 713-725.
4. O’Malley A.J., Zou K.H.: Bayesian multivariate hierarchical transformation models for ROC analysis. Stat Med 2006; 25: pp. 459-479.
5. Kawaguchi A., Koch G.G., Wang X.: Stratified multivariate Mann Whitney estimators for the comparison of two treatments with randomization based covariance adjustment. Stat Biopharmaceut Res 2011; 3: pp. 217-231.
6. Zou K.H., Carlsson M.O., Yu C.-R.: Comparison of adjustment methods for stratified two-sample tests in the context of ROC analysis. Biometr J 2012; 54: pp. 249-263.
7. Bamber D.: The area above the ordinal dominance graph and the area below the receiver operating characteristic graph. J Math Psychol 1975; 12: pp. 387-415.
8. Mann H.B., Whitney D.R.: On a test of whether one of two random variables is stochastically larger than the other. Ann Math Stat 1947; 18: pp. 50-60.
9. Hanley J., McNeil B.: The meaning and use of the area under a receiver operating characteristic (ROC) curve. Radiology 1982; 143: pp. 29-36.
10. Metz C.E.: Basic principles of ROC analysis. Semin Nucl Med 1978; 8: pp. 283-298.
11. Schiemann M., Killmann R., Kleen M., et. al.: Vascular guide wire navigation with a magnetic guidance system: experimental results in a phantom. Radiology 2004; 232: pp. 475-481.
12. Metz C., Herman B., Shen J.-H.: Maximum likelihood estimation of receiver operating characteristic (ROC) curves from continuously-distributed data. Stat Med 1998; 17: pp. 1033-1053.
13. van Elteren P.H.: On the combination of independent two sample tests of Wilcoxon. Bull Int Stat Inst 1947; 37: pp. 351-361.
14. Mehrotra D.V., Lu X., Li X.: Rank-based analyses of stratified experiments: alternatives to the van Elteren test. Am Stat 2010; 64: pp. 121-130.
15. Jureckova J.: Asymptotic linearity of a rank statistic in regression parameter. Ann Math Stat 1969; 40: pp. 1889-1900.
16. Randles R.H., Broffitt J.D., Ramberg J.S., et. al.: Discriminant analysis based on ranks. J Am Stat Assoc 1978; 73: pp. 379-384.
17. Sotiriou C., Wirapati P., Loi S., et. al.: Gene expression profiling in breast cancer: understanding the molecular basis of histologic grade to improve prognosis. J Natl Cancer Inst 2006; 98: pp. 262-272.
18. Madhavan S., Gusev Y., Harris M., et. al.: G-DOC: A systems medicine platform for personalized oncology. Neoplasia 2011; 13: pp. 771-783.
19. R Core Team: R: A Language and Environment for Statistical Computing.2012.R Foundation for Statistical ComputingVienna, Austria URL: http://www.R-project.org/ ISBN 3-900051-07-0
20. Samuelson F., Gallas B.D., Myers K.J., et. al.: The importance of ROC data. Acad Radiol 2011; 18: pp. 257-258.