
Rationale and Objectives
To establish the normal criterion of ascending aortic diameter (AAOD) measured by 64 multidetector computed tomography (MDCT) and electron beam computed tomography (EBT) based on gender and age.
Materials and Methods
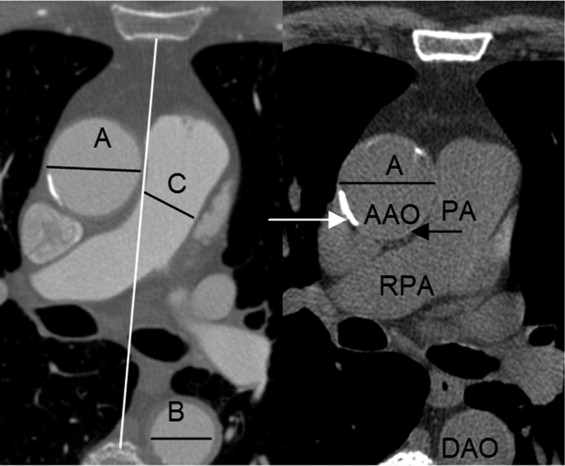
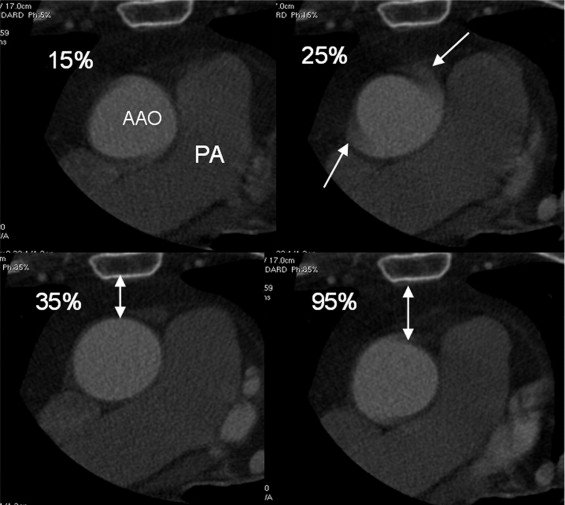
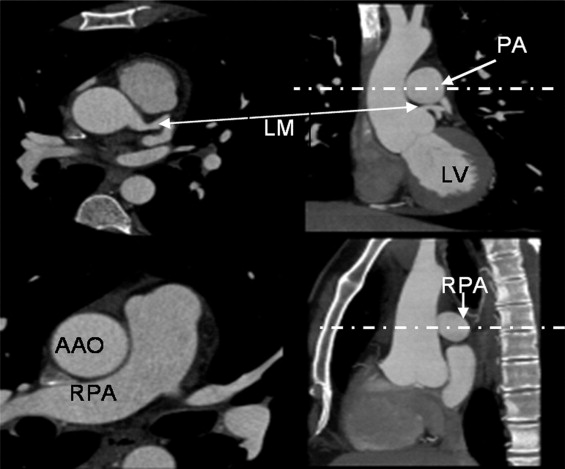
A total of 1442 consecutive subjects who were referred for evaluation of possible coronary artery disease underwent coronary computed tomographic (CT) angiography (CTA) and coronary artery calcium scanning (CACS) (55 + 11 years, 65% male) without known coronary heart disease, hypertension, chronic pulmonary and renal disease, diabetes, and severe aortic calcification. The AAOD aortic diameter, descending aortic diameter (DAOD), pulmonary artery (PAD), and chest anteroposterior diameter (CAPD), posterior border of the sternal bone to the anterior border of the spine, were measured at the slice level of mid-right pulmonary artery using end systolic trigger imaging. The volume of four chambers, ejection fraction of left ventricle, and cardiac output were measured in 56% of the patients. Patients’ demographic information, age, gender, weight, height, and body surface area were recorded. The mean value and age-specific and gender-adjusted upper normal limits (mean ± 2 standard deviation) were calculated. The linear correlation analysis was done between AAOD and all parameters. The reproducibility, wall thickness, and difference between end-systole and end-diastole were calculated.
Results
AAOD has significant linear association with age, gender, DAOD, and pulmonary artery diameter ( P < .05). There is no significant correlation between AAOD and body surface area, four-chamber volume, left ventricular ejection fraction, cardiac output, and CAPD. The mean intraluminal AAOD was 31.1 ± 3.9 and 33.6 ± 4.1 mm in females and males, respectively. The upper normal limits (mean ± 2 standard deviations) of intraluminal AAOD, were 35.6, 38.3, and 40 mm for females and 37.8, 40.5, and 42.6 mm for males in age groups 20–40, 41–60, and older than 60 years, respectively. Intraluminal aortic diameters should parallel echocardiography and invasive angiography. Traditional cross-sectional imaging (with CT and magnetic resonance imaging) includes the vessel wall. The mean total AAOD was 33.5 and 36.0 mm in females and males, respectively. The upper normal limits (mean ± 2 standard deviations) of intraluminal AAOD were 38.0, 40.7 and 42.4 mm for females and 40.2, 42.9, and 45.0 mm for males in age group 20 to 40, 41 to 60, and older than 60 years, respectively. The inter- and intraobserver, scanner, and repeated measurement variabilities were low ( r value >0.91, P < .001, coefficient variation <3.2%). AAOD was 1.7 mm smaller in end-diastole than end-systole ( P < .001).
Conclusions
The AAOD increases with age and male gender. Gender-specific and age-adjusted normal values for aortic diameters are necessary to differentiate pathologic atherosclerotic changes in the ascending aorta. Use of intraluminal or total aortic diameter values depends on the comparison study employed.
Atherosclerosis is a generalized process that may involve the aorta and the coronary arteries. Atherosclerotic disease of the aorta has been demonstrated to increase the risk for ischemic stroke ( ) and been demonstrated to be associated with coronary artery disease (CAD) ( ). Ascending aortic atherosclerosis has also been associated with aortic valve disease, Marfan syndrome, and aortic aneurysms. Aortic root changes resulting from aging, involving aortic distensibility, is the most common cause of aortic regurgitation ( ). Early detection of aortic atherosclerosis before the onset of clinical symptoms may improve both the diagnosis and therapeutic interventions.
There have been some reports of the importance of aging on this process and gender-related differences in aortic diameters ( ). With more application of cardiac computed tomography (CT) and thoracic CT, it is essential to define the normal thoracic aortic diameter changes with aging in both genders. To date, most CT studies that have evaluated the thoracic aorta diameters in adults have been small in size ( ). We sought to evaluate the thoracic aortic diameters in a large population of patients without known diseases to establish normal values based on age and gender using high-resolution cardiac CT.
Materials and methods
Study Population
Get Radiology Tree app to read full this article<
Table 1
Profile in Clinical Parameters
Gender n Age BSA (m 2 ) LVEF CO/Beat AP Chest Diameter Female 500 56.3 (19–92) 1.73 67.5% 73.4 mL 110.2 mm Male 942 54.5 (19–93) 2.02 66.4% 83.8 mL 127.2 mm
All P values > .05 comparing both genders.
n, number of subjects; BSA, body surface area; LVEF, left ventricular ejection fraction; CO, cardiac output; AP, anteroposterior.
Get Radiology Tree app to read full this article<
EBT Study Protocol
Get Radiology Tree app to read full this article<
MDCT Study Protocol
Get Radiology Tree app to read full this article<
Measurements
Get Radiology Tree app to read full this article<
Analysis
Get Radiology Tree app to read full this article<
Results
Get Radiology Tree app to read full this article<
Table 2
Association Between AAOD and Factors
Factors Ascending Aorta Diameter Female Male n_r_ Value n_r_ Value Gender 487 0.28 487 0.28 Age 500 0.26 942 0.31 DAOD 500 0.48 942 0.43 PAD 500 0.21 942 0.21
DAOD, descending aortic diameter; n, number of subjects; PAD, pulmonary artery diameter.
All P < .05.
Table 3
Normal Ascending Aorta Diameter Measured with Echocardiography and CT
Authors Ascending Aorta Diameter Method Trigger Time Female Male n Age M ± SD (mm) n Age M ± SD (mm) Mao 500 56 31.1 ± 3.9 942 54 33.6 ± 4.1 CVCT End-systolic Mao 28 20–40 29.0 ± 3.3 80 20–40 30.8 ± 3.5 CVCT End-systolic Mao 305 41–60 30.7 ± 3.8 595 41–60 33.3 ± 3.6 CVCT End-systolic Mao 167 >60 32.2 ± 3.9 267 >60 35.0 ± 3.8 CVCT End-systolic Vasan ( ) 1816 46 28 ± 3 1473 47 32 ± 3 Echo End-diastolic Roman ( ) 67 43 27 ± 3 68 43 30 ± 4 Echo End-diastolic Sochowski ( ) 33 45 28 ± 3 27 45 28 ± 3 Echo End-systolic Reed ( ) 46 ⁎ 21 33 ± 4 45 ⁎ 21 32 ± 4 Echo — Reed ( ) 44 † 21 27 ± 3 46 † 21 31 ± 3 Echo — Aronberg ( ) 36 ‡ 20–40 33.6 36 ‡ 20–40 34.7 CT No trigger time Aronberg ( ) 33 ‡ 41–60 37.2 33 ‡ 41–60 36.3 CT No trigger time Aronberg ( ) 33 ‡ >61 35 33 ‡ >61 39.1 CT No trigger time Pearce ( ) 24 49 29 ± 3.4 46 50 32 ± 5.2 CT No trigger time
M, mean; SD, standard deviation; echo, echocardiography; CVCT, cardiovascular computed tomography.
Get Radiology Tree app to read full this article<
Get Radiology Tree app to read full this article<
Get Radiology Tree app to read full this article<
Get Radiology Tree app to read full this article<
Get Radiology Tree app to read full this article<
Table 4
Changes in Ascending Aorta Diameter with Different Trigger Time and Method of Ascending Aortic Diameter Measurement
Trigger Time n 35% phase 75% phase 95% phase 107 33.9 ± 4.1 32.9 ± 4.1 32.2 ± 3.9 ⁎
Imaging and Measuring Method (64 MDCT) n CTA (lumen) CTA (lumen + wall) CACS (lumen + wall) 85 32.8 ± 3.8 35.2 ± 3.8 ⁎⁎ 35.1 ± 3.8 ⁎⁎
MDCT, multidetector computed tomography; CTA, computed tomography angiography; CACS, coronary artery calcium scanning.
Compared with 35% phase for trigger time and CTA lumen for method.
Get Radiology Tree app to read full this article<
Get Radiology Tree app to read full this article<
Get Radiology Tree app to read full this article<
Get Radiology Tree app to read full this article<
Table 5
Interobserver, Intermeasurement, Interscanner, Interphase, and Intermethod Variabilities
Measurements n_r_ CV (%) Bland Altman Plot Ratio 95% CI limit Interobserver variability 144 0.91 3.2 1.00, 95% CI 0.99–1.01 Inter-reader variability 140 0.92 3.0 1.01, 95% CI 0.99–1.01 Interscanner variability 100 0.91 3.2 1.01, 95% CI 0.99–1.02 Interphase variability (35% vs. 75% phase) 107 0.98 2.3 1.03, 95% CI 1.02–1.04 Interphase variability (35% and 95% phase) 107 0.97 2.4 1.05, 95% CI 1.05–1.06 Interlumen and (lumen + wall) CTA variability 85 0.98 3.3 0.93, 95% CI 0.92–0.93 Interwall CTA and CACS (lumen + wall) variability 85 0.99 1.7 1.00, 95% CI 1.00–1.01
n, number of subjects; CV, coefficient of variation; CTA, computed tomography angiography; CACS, coronary artery calcium scanning.
Get Radiology Tree app to read full this article<
Discussion
Aging Process: Aortic Histology, Anatomy, and Function
Get Radiology Tree app to read full this article<
Get Radiology Tree app to read full this article<
Get Radiology Tree app to read full this article<
Correlation Between AAOD and Parameters
Get Radiology Tree app to read full this article<
Difference of Aortic Diameter by Authors
Get Radiology Tree app to read full this article<
Reproducibility
Get Radiology Tree app to read full this article<
Definition
Get Radiology Tree app to read full this article<
Get Radiology Tree app to read full this article<
Limitations
Get Radiology Tree app to read full this article<
Conclusion
Get Radiology Tree app to read full this article<
References
1. Van Der Linden J., Bergman P., Hadjinikolaou L.: The topography of aortic atherosclerosis enhances its precision as a predictor of stroke. Ann Thorac Surg 2007; 83: pp. 2087-2092.
2. Acartiirk E., Ozeren A., Sanca Y.: Detection of aortic plaques by transesophageal echocardiography in patients with ischemic stroke. Acta Neurol Scand 1995; 92: pp. 17-22.
3. The French Study of Aortic Plaques in Stroke Group: Atherosclerotic disease of the aortic arch as a risk factor for recurrent ischemic stroke. N Engl Med 1996; 334: pp. 1216-1221.
4. Cohen A., Tzorio C., Bertrand B., et. al.: Aortic plaque morphology and vascular events: a follow-up study in patients with ischemic stroke. Circulation 1997; 96: pp. 3838-3841.
5. Tunick P.A., Rosenzweig B.P., Katz E.S., et. al.: High risk for vascular events in patients with protruding aortic atheromas: a prospective study. J Am Coll Cardiol 1994; 23: pp. 1085-1090.
6. Tribouilloy C., Shen W.F., Peltier M., et. al.: Noninvasive prediction of coronary artery disease by transesophageal echocardiographic detection of thoracic aortic plaque in valvular heart disease. Am J Cardiol 1994; 74: pp. 258-260.
7. Parthenakis F., Skalidis E., Simantirakis E., et. al.: Absence of atherosclerotic lesions in the thoracic aorta indicates absence of significant coronary artery disease. Am J Cardiol 1996; 77: pp. 1118-1121.
8. Khoury Z., Gottlieb S., Stern S., et. al.: Frequency and distribution of atherosclerotic plaques in the thoracic aorta as determined by transesophageal echocardiography in patients with coronary artery disease. Am J Cardiol 1997; 79: pp. 23-27.
9. Fazio G.P., Redberg R., Winslow T., et. al.: Transesophageal echocardiographically detected atherosclerotic aortic plaque is a marker for coronary artery disease. J Am Coll Cardiol 1993; 21: pp. 144-150.
10. Acartürk E., Demir M., Kanadaşi M.: Aortic atherosclerosis is a marker for significant coronary artery disease. Jpn Heart J 1999; 40: pp. 775-781.
11. Olson L.J., Subramanian R., Edwards W.D.: Surgical pathology of pure aortic insufficiency: a study of 225 cases. Mayo Clin Proc 1984; 59: pp. 835-841.
12. Vasan R.S., Larson M.G., Levy D.: Determinants of echocardiographic aortic root size. Circulation 1995; 91: pp. 734-740.
13. Roman M.J., Devereux R.B., Kramer-Fox R., et. al.: Two-dimensional echocardiographic aortic root dimensions in normal children and adults. Am J Cardiol 1989; 64: pp. 507-512.
14. Cohen G.I., White M., Sochowski R.A., et. al.: Reference values for normal adult transesophageal echocardiographic measurements. J Am Soc Echocardiogr 1995; 8: pp. 221-230.
15. Reed C.M., Richey P.A., Pulliam D.A., et. al.: Aortic dimensions in tall men and women. Am J Cardiol 1993; 71: pp. 608-610.
16. Aronberg D.J., Glazer H.S., Madsen K., et. al.: Normal thoracic aortic diameters by computed tomography. J Comput Assist Tomogr 1984; 8: pp. 247-250.
17. Pearce W.H., Slaughter M.S., LeMaire S., et. al.: Aortic diameter as a function of age, gender, and body surface area. Surgery 1993; 114: pp. 691-697.
18. Mao S., Budoff M.J., Bin L., et. al.: Optimal ECG trigger point in electron-beam CT studies: three methods for minimizing motion artifacts. Acad Radiol 2001; 8: pp. 1107-1115.
19. Budoff M.J.Shinbane J.S.Cardiac CT imaging: diagnosis of cardiovascular disease.2006.SpringerLondon, UK:
20. Budoff M.J., Shinbane J.S., Child J., et. al.: Multiphase contrast medium injection for optimization of computed tomographic coronary angiography. Acad Radiol 2006; 13: pp. 159-165.
21. Stefanadis C., Stratos C., Vlachopoulos C., et. al.: Pressure-diameter relation of the human aorta. Circulation 1995; 92: pp. 2210-2219.
22. Kelly R.P., Tunin R., Kass D.A.: Effect of reduced aortic compliance on cardiac efficiency and contractile function of in situ canine left ventricle. Circ Res 1992; 71: pp. 490-502.
23. Bogren H.G., Mohiaddin R.H., Klipstein R.K., et. al.: The function of the aorta in ischemic heart disease: a magnetic resonance and angiographic study of aortic compliance and blood flow patterns. Am Heart J 1989; 118: pp. 234-247.
24. Ohtsuka S., Kakihana M., Watanabe H., et. al.: Chronically decreased aortic distensibility causes deterioration of coronary perfusion during increased left ventricular contraction. J Am Coll Cardiol 1994; 24: pp. 1406-1414.
25. Mohiaddin R.H., Firmin D.N., Longmore D.B.: Age-related changes of human aortic flow wave velocity measured noninvasively by magnetic resonance imaging. J Appl Physiol 1993; 74: pp. 492-497.
26. Garcier J.M., Petitcolin V., Filaire M., et. al.: Normal diameter of the thoracic aorta in adults: a magnetic resonance imaging study. Surg Radiol Anat 2003; 25: pp. 322-329.
27. Hager A., Kaemmerer H., Rapp-Bernhardt U., et. al.: Diameters of the thoracic aorta throughout life as measured with helical computed tomography. J Thorac Cardiovasc Surg 2002; 123: pp. 1060-1066.
28. Aronow W.S., Fleg J.L.: Cardiovascular disease in the elderly.3 Ed.2004.Marcel Dekker, IncNew York
29. Schlatmann T.J., Becker A.E.: Histologic changes in the normal aging aorta: implications for dissecting aortic aneurysm. Am J Cardiol 1977; 39: pp. 13-20.
30. Carlson R.G., Lillehei C.W., Edwards J.E.: Cystic medial necrosis of the ascending aorta in relation to age and hypertension. Am J Cardiol 1970; 25: pp. 411-415.
31. Schlatmann T.J., Becker A.E.: Pathogenesis of dissecting aneurysm of aorta. Am J Cardiol 1977; 39: pp. 21-26.