
Rationale and Objectives
Longitudinal (T 1 ) and effective transverse (T 2 ∗) magnetic resonance (MR) relaxation times provide noninvasive measures of tissue oxygenation. The objective for this study was to quantify independent effects of inhaled O 2 and CO 2 on normal tissue T 1 and T 2 ∗ in rabbit liver, kidney, and paraspinal muscle.
Materials and Methods
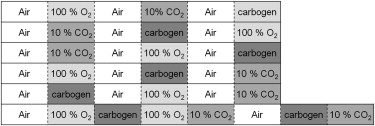
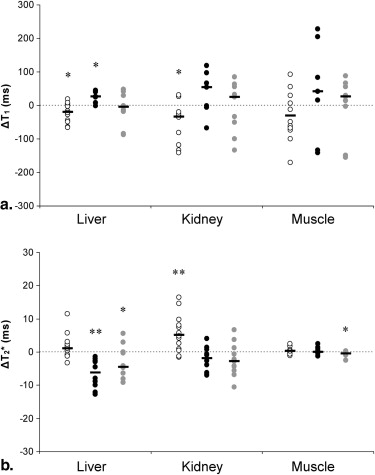
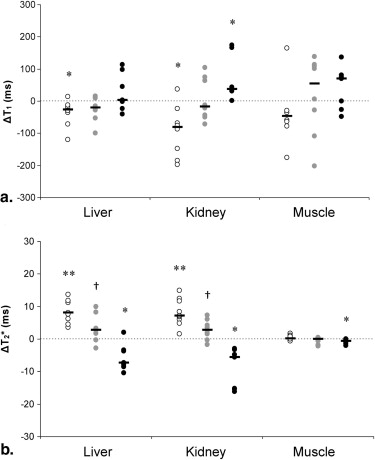
Three gas challenges (100% O 2 , 10% CO 2 [balance air], and carbogen [90% O 2 + 10% CO 2 ]) were delivered to the rabbits in random order to isolate the effects of inspired O 2 and CO 2 . During each challenge, quantitative T 1 and T 2 ∗ maps were collected on a 1.5 Tesla MR imaging. Mean changes in T 1 (ΔT 1 ) and T 2 ∗ (ΔT 2 ∗) were calculated from regions of interest in each organ.
Results
Greatest ΔT 1 and ΔT 2 ∗ changes were observed in liver for 10% CO 2 and in kidney for 100% O 2 . ΔT 1 and ΔT 2 ∗ generally followed predicted patterns when transitioning from air breathing: lower T 1 /higher T 2 ∗ with inspired O 2 , higher T 1 /lower T 2 ∗ with inspired CO 2 , and variable T 1 /T 2 ∗ changes in the presence of both (ie, carbogen). New observations also emerged: 1) between-gas-challenge transitions revealed the greatest significance in ΔT 2 ∗ for the liver and kidney resulting from the isolation of independent O 2 and CO 2 effects; 2) ΔT 2 ∗ provided the best sensitivity and detected both tissue oxygenation and blood volume modulation; and 3) ΔT 1 sensitivity was restricted mainly to tissue oxygenation in the absence of counteracting vasodilatation.
Conclusion
Robust use of MR relaxation times as noninvasive biomarkers requires an understanding of their relative sensitivity to organ-specific physiological responses.
Noninvasive magnetic resonance (MR) measures of longitudinal (T 1 ) and effective transverse (T 2 ∗) relaxation times have demonstrated potential as indirect markers of oxygenation in the brain and peripheral tissues . Typically, changes in MR relaxation times are measured during experimental manipulation of the fraction of inspired O 2 (FiO 2 ) and CO 2 (FiCO 2 ) using one or more gas transitions. The manipulation of inspired gases may be directed to improve tissue oxygenation (eg, augmenting tumor oxygen for cancer therapy) or may also be applied to alter blood flow and volume, so as to provide a means for evaluating vasoreactivity (eg, brain). These concomitant changes in tissue oxygen and perfusion are known to exert independent, possibly opposing influences on MR relaxation times. Therefore, understanding their independent effects is critical for proper interpretation of MR measurements. For most extracranial tissues or tumors, our understanding of these physiological responses and related MR measurements is relatively poor compared to that in the brain. Investigations in normal tissue have been particularly limited but are essential in their own right and for cancer applications, because physiological differences in the normal host organ response may provide insight into the inconsistent MR results reported in tumors to date.
Oxygen-related T 1 changes are postulated to stem primarily from molecular O 2 dissolved in blood plasma and intra- and extracellular fluids . Increasing the FiO 2 will progressively increase O 2 dissolved in blood plasma, because the total amount of O 2 bound to hemoglobin (ie, the arterial oxygen saturation [SaO 2 ]) is normally close to 100% and will be relatively unaffected. As molecular O 2 is weakly paramagnetic, its presence effectively shortens T 1 . The expected T 1 reduction, however, has been consistently observed only in some tissues, such as spleen and myocardium . Other tissues, such as liver, kidney, and muscle, have shown smaller T 1 reductions or none at all .
Get Radiology Tree app to read full this article<
Get Radiology Tree app to read full this article<
Get Radiology Tree app to read full this article<
Materials and methods
Get Radiology Tree app to read full this article<
Gas Challenges
Get Radiology Tree app to read full this article<
Get Radiology Tree app to read full this article<
Get Radiology Tree app to read full this article<
Table 1
Expected and Observed T 1 and T 2 ∗ Changes for Different Inspired Gas Transitions
Gas Transition PaO 2 BF Hb/(HbO 2 + Hb) Expected Changes in MR Relaxation Times Observed Changes in MR Relaxation Times ΔT 1 ΔT 2 ∗ ΔT 1 ΔT 2 ∗ Air → 100% O 2 ↑ ↓ ↓ ↓ from increased PaO 2 , possibly reinforced by decreased blood volume. ↑ from decreased Hb related to PaO 2 , possibly reinforced by decreased blood volume ↓ liver ∗
↓ kidney ∗
↓ muscle ↑ liver
↑ kidney ∗∗
↑ muscle Air → 10% CO 2 NC ↑ ↑ ↑ from increased blood volume ↓ from increased Hb related to Bohr effect, reinforced by increased blood volume ↑ liver ∗
↑ kidney
↑ muscle ↓ liver ∗∗
↓ kidney
↑ muscle Air → carbogen ↑ ↑ ? Unclear because of competing effects of PaO 2 and blood volume Unclear because of competing effects of increased PaO 2 and Bohr effect on HbO 2 and Hb levels ↓ liver
↑ kidney
↑ muscle ↓ liver ∗
↓ kidney
↓ muscle ∗ 10% CO 2 → 100% O 2 ↑ ↓ ↓ ↓ from increased PaO 2 , reinforced by decreased blood volume ↑ from decreased Hb related to PaO 2 and Bohr effect, reinforced by decreased blood volume ↓ liver ∗
↓ kidney ∗
↓ muscle ↑ liver ∗∗
↑ kidney ∗∗
↑ muscle 10% CO 2 → carbogen ↑ ↓ ↓ ↓ from increased PaO 2 , possibly reinforced by decreased blood volume ↑ from decreased Hb related to PaO 2 , possibly reinforced by decreased blood volume ↓ liver
↓ kidney
↑ muscle ↑ liver †
↑ kidney †
↑ muscle 100% O 2 → carbogen NC ↑ ↑ ↑ from increased blood volume, with no change in PaO 2 . ↓ from increased Hb related to Bohr effect, reinforced by increased blood volume ↑ liver
↑ kidney ∗
↑ muscle ↓ liver ∗
↓ kidney ∗
↓ muscle ∗
Significance in ΔT 1 ΔT 2 ∗: † P < .10, ∗ P < .05, ∗∗ P < .01.
Observations that did not follow predicted changes are highlighted in bold.
BF, blood flow; Hb, deoxyhemoglobin; HbO 2 , oxyhemoglobin; NC, no change; PaO 2 , arterial partial pressure of O 2 .
Gases: air (21% O 2 ), 10% CO 2 (balance air), carbogen (90% O 2 + 10% CO 2 ).
Get Radiology Tree app to read full this article<
Animal Preparation
Get Radiology Tree app to read full this article<
MRI
Get Radiology Tree app to read full this article<
Get Radiology Tree app to read full this article<
Get Radiology Tree app to read full this article<
Data Analysis
Get Radiology Tree app to read full this article<
Get Radiology Tree app to read full this article<
Results
Get Radiology Tree app to read full this article<
Table 2
Arterial Blood Gas Measurements
Gas Challenge tHb (g/dL) pH PaCO 2 (mm Hg) PaO 2 (mm Hg) SaO 2 (%) Air 12.0 ± 1.0 7.440 ± 0.001 34.4 ± 2.9 71.7 ± 2.3 99.7 ± 2.1 10% CO 2 12.5 ± 0.6 7.214 ± 0.014 70.4 ± 3.1 86.5 ± 6.3 98.2 ± 1.2 100% O 2 11.8 ± 0.1 7.401 ± 0.011 40.2 ± 4.5 454 ± 12 105.0 ± 2.8 carbogen 11.7 ± 0.4 7.215 ± 0.030 69.3 ± 6.9 445 ± 31 104.6 ± 2.8
Gases: air (21% O 2 ), 10% CO 2 (balance air), carbogen (90% O 2 + 10% CO 2 ).
PaCO 2 , arterial partial pressure of CO 2 ; PaO 2 , arterial partial pressure of O 2 ; SaO 2 , arterial oxygen saturation; tHb, total hemoglobin.
Mean ± SD ( n = 2).
Get Radiology Tree app to read full this article<
Get Radiology Tree app to read full this article<
Get Radiology Tree app to read full this article<
Get Radiology Tree app to read full this article<
Get Radiology Tree app to read full this article<
Get Radiology Tree app to read full this article<
Discussion
Get Radiology Tree app to read full this article<
Get Radiology Tree app to read full this article<
Get Radiology Tree app to read full this article<
Get Radiology Tree app to read full this article<
Get Radiology Tree app to read full this article<
Get Radiology Tree app to read full this article<
Get Radiology Tree app to read full this article<
Get Radiology Tree app to read full this article<
Get Radiology Tree app to read full this article<
Get Radiology Tree app to read full this article<
References
1. Prisman E., Slessarev M., Han J., et. al.: Comparison of the effects of independently-controlled end-tidal PCO(2) and PO(2) on blood oxygen level-dependent (BOLD) MRI. J Magn Reson Imaging 2008; 27: pp. 185-191.
2. O’Connor J.P., Jackson A., Buonaccorsi G.A., et. al.: Organ-specific effects of oxygen and carbogen gas inhalation on tissue longitudinal relaxation times. Magn Reson Med 2007; 58: pp. 490-496.
3. O’Connor J.P., Naish J.H., Jackson A., et. al.: Comparison of normal tissue R1 and R∗2 modulation by oxygen and carbogen. Magn Reson Med 2009; 61: pp. 75-83.
4. Tadamura E., Hatabu H., Li W., et. al.: Effect of oxygen inhalation on relaxation times in various tissues. J Magn Reson Imaging 1997; 7: pp. 220-225.
5. Noseworthy M.D., Kim J.K., Stainsby J.A., et. al.: Tracking oxygen effects on MR signal in blood and skeletal muscle during hyperoxia exposure. J Magn Reson Imaging 1999; 9: pp. 814-820.
6. Jones R.A., Ries M., Moonen C.T., et. al.: Imaging the changes in renal T1 induced by the inhalation of pure oxygen: a feasibility study. Magn Reson Med 2002; 47: pp. 728-735.
7. Kaanders J.H., Bussink J., van der Kogel A.J.: ARCON: a novel biology-based approach in radiotherapy. Lancet Oncol 2002; 3: pp. 728-737.
8. Cheng H.L., Wright G.A.: Rapid high-resolution T(1) mapping by variable flip angles: accurate and precise measurements in the presence of radiofrequency field inhomogeneity. Magn Reson Med 2006; 55: pp. 566-574.
9. Beaumont M., Odame I., Babyn P.S., et. al.: Accurate liver T2 measurement of iron overload: a simulations investigation and in vivo study. J Magn Reson Imaging 2009; 30: pp. 313-320.
10. Boss A., Martirosian P., Jehs M.C., et. al.: Influence of oxygen and carbogen breathing on renal oxygenation measured by T2∗-weighted imaging at 3.0 T. NMR Biomed 2009; 22: pp. 638-645.
11. Lanzen J.L., Braun R.D., Ong A.L., et. al.: Variability in blood flow and pO2 in tumors in response to carbogen breathing. Int J Radiat Oncol Biol Phys 1998; 42: pp. 855-859.
12. Thews O., Kelleher D.K., Vaupel P.: Dynamics of tumor oxygenation and red blood cell flux in response to inspiratory hyperoxia combined with different levels of inspiratory hypercapnia. Radiother Oncol 2002; 62: pp. 77-85.
13. Neeman M., Dafni H., Bukhari O., et. al.: In vivo BOLD contrast MRI mapping of subcutaneous vascular function and maturation: validation by intravital microscopy. Magn Reson Med 2001; 45: pp. 887-898.
14. Lu J., Dai G., Egi Y., et. al.: Characterization of cerebrovascular responses to hyperoxia and hypercapnia using MRI in rat. Neuroimage 2009; 45: pp. 1126-1134.
15. Barash H., Gross E., Matot I., et. al.: Functional MR imaging during hypercapnia and hyperoxia: noninvasive tool for monitoring changes in liver perfusion and hemodynamics in a rat model. Radiology 2007; 243: pp. 727-735.
16. Lautt W.W.: Mechanism and role of intrinsic regulation of hepatic arterial blood flow: hepatic arterial buffer response. Am J Physiol 1985; 249: pp. G549-G556.
17. Chang C., Uchiyama A., Ma L., et. al.: A comparison of the effects on respiratory carbon dioxide response, arterial blood pressure, and heart rate of dexmedetomidine, propofol, and midazolam in sevoflurane-anesthetized rabbits. Anesth Analg 2009; 109: pp. 84-89.
18. Rhee T.K., Larson A.C., Prasad P.V., et. al.: Feasibility of blood oxygenation level-dependent MR imaging to monitor hepatic transcatheter arterial embolization in rabbits. J Vasc Interv Radiol 2005; 16: pp. 1523-1528.
19. McGrath D.M., Naish J.H., O’Connor J.P., et. al.: Oxygen-induced changes in longitudinal relaxation times in skeletal muscle. Magn Reson Imaging 2008; 26: pp. 221-227.
20. Purdie T.G., Lee T.Y.: Carbon dioxide reactivity of computed tomography functional parameters in rabbit VX2 soft tissue tumour. Phys Med Biol 2003; 48: pp. 849-860.
21. Lebon V., Carlier P.G., Brillault-Salvat C., et. al.: Simultaneous measurement of perfusion and oxygenation changes using a multiple gradient-echo sequence: application to human muscle study. Magn Reson Imaging 1998; 16: pp. 721-729.
22. Tatum J.L., Kelloff G.J., Gillies R.J., et. al.: Hypoxia: importance in tumor biology, noninvasive measurement by imaging, and value of its measurement in the management of cancer therapy. Int J Radiat Biol 2006; 82: pp. 699-757.
23. Wang W., Lee N.Y., Georgi J.C., et. al.: Pharmacokinetic analysis of hypoxia (18)F-fluoromisonidazole dynamic PET in head and neck cancer. J Nucl Med 2010; 51: pp. 37-45.
24. Jordan B.F., Cron G.O., Gallez B.: Rapid monitoring of oxygenation by 19F magnetic resonance imaging: simultaneous comparison with fluorescence quenching. Magn Reson Med 2009; 61: pp. 634-638.
25. Zhao D., Jiang L., Hahn E.W., et. al.: Comparison of 1H blood oxygen level-dependent (BOLD) and 19F MRI to investigate tumor oxygenation. Magn Reson Med 2009; 62: pp. 357-364.