
Rationale and Objectives
To compare in dual-energy CT (DECT) conventionally reconstructed polyenergetic images (PEI) at 120 kVp to virtual monoenergetic images (MEI) at different kiloelectron volt (keV) levels for evaluation of liver and gastrointestinal stromal tumor (GIST) hepatic metastases with regard to objective (IQob) and subjective image quality (IQsub) assessed by two readers of varying experience. Image quality was correlated to patient size and compared between PEI and MEI.
Materials and Methods
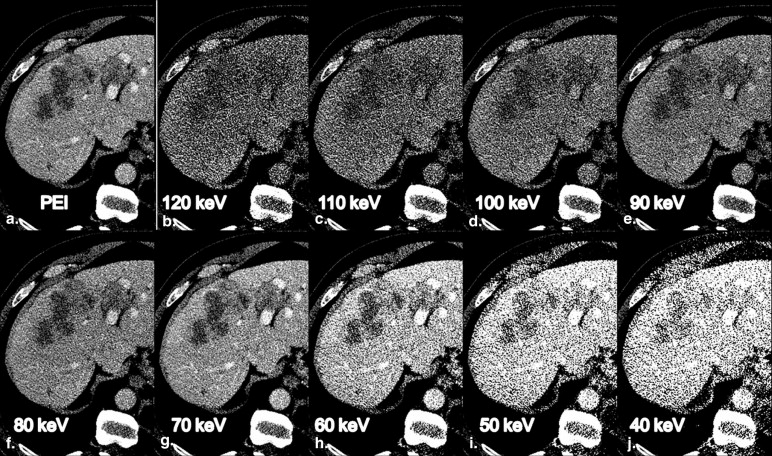
From 50 examinations of 17 GIST patients (12 with hepatic metastases) undergoing abdominal dual-source DECT for staging, therapy monitoring or follow-up, PEI and nine MEI in 10-keV intervals from 40 to 120 keV were reconstructed. Liver contrast-to-noise ratios (CNR) and metastasis-to-liver ratios were calculated. MEI reconstructions with the highest IQob were compared to PEI for IQsub by one experienced reader (ER) and one inexperienced reader (IR). Patients’ diameters were correlated to IQob and IQsub ratings.
Results
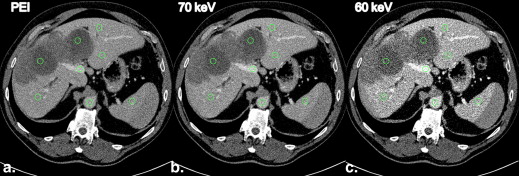
MEI at 70 keV had the highest IQob with equal liver CNR and metastasis-to-liver ratio compared to PEI. The ER rated 70-keV MEI and PEI equally high (median 4), whereas the IR rated IQsub best in 70-keV MEI (median 5). Unlike in PEI, IQsub ratings in 70-keV MEI were not correlated to patient size.
Conclusions
MEI at 70 keV provided an IQob equivalent to PEI. Regarding the IR, IQsub was improved in 70-keV MEI compared to PEI and less dependent on patient size. Therefore, IRs might improve their diagnostic confidence in the assessment of hepatic GIST metastases by evaluating MEI reconstructions at 70 keV.
Gastrointestinal stromal tumors (GISTs) constitute a rare mesenchymal tumor entity with an incidence of 1.5/100,000/year . GISTs may develop throughout the gastrointestinal tract, but the most frequent location is the stomach, followed by the small bowel . The predominant location of GIST metastatic spread is the liver, followed by the peritoneum . Contrast-enhanced abdominal and pelvic computed tomography (CT) is the standard imaging method for staging and follow-up, except for rectal GIST, where magnetic resonance imaging is the imaging modality of choice .
About half of the patients suffering from GIST are presenting with metastatic disease at the time of diagnosis and almost two-thirds of patients with metastatic GIST have hepatic lesions . Typical morphologic changes, such as myxoid degeneration or so-called nodules within a mass and decreasing lesion density, and functional changes, such as hypovascularization of the GIST metastases, are known to occur in the course of treatment in case of response to therapy, and the accurate characterization of these lesions has direct consequences on the patient’s treatment regime .
Get Radiology Tree app to read full this article<
Get Radiology Tree app to read full this article<
Get Radiology Tree app to read full this article<
Materials and methods
Study Population
Get Radiology Tree app to read full this article<
Image Acquisition
Get Radiology Tree app to read full this article<
Image Reconstruction
Get Radiology Tree app to read full this article<
Get Radiology Tree app to read full this article<
Image Analysis
Objective image quality
Get Radiology Tree app to read full this article<
Get Radiology Tree app to read full this article<
Get Radiology Tree app to read full this article<
CNRx=(MeanX−Meanmuscle)/SDairwhere,x=liver,spleen,aorta,orportalvein. CNR
x
=
(
Mean
X
−
Mean
muscle
)
/
SD
air
where,
x
=
liver,
spleen,
aorta,
or
portal
vein
.
Metastasis−to−liverratio=|Meanlesion−Meanliver|/SDliver Metastasis
-
to
-
liver
ratio
=
|
Mean
lesion
−
Mean
liver
|
/
SD
liver
Get Radiology Tree app to read full this article<
Get Radiology Tree app to read full this article<
Subjective image quality
Get Radiology Tree app to read full this article<
Get Radiology Tree app to read full this article<
Statistical Analysis
Get Radiology Tree app to read full this article<
Ethics
Get Radiology Tree app to read full this article<
Results
Get Radiology Tree app to read full this article<
Objective Image Quality
Get Radiology Tree app to read full this article<
Get Radiology Tree app to read full this article<
Correlation of IQob and patient size
Get Radiology Tree app to read full this article<
![Figure 5, Image noise as a function of patient size as measured in liver parenchyma, plotted for monoenergetic image (MEI) at all nine investigated kiloelectron volt levels and polyenergetic image (PEI): on the x-axis are the CT numbers (Hounsfield units [HU]) of the standard deviation of attenuation values assessed in liver parenchyma; plotted on the y-axis is the product of anteroposterior (a.p.) and transverse patient diameter [cm 2 ] as a representative value for patient size. Image noise values for 60-, 70-, 80-, 90-, 100-, 110-, and 120-keV and PEI data sets are reaching from 17.3 to 60.3 HU, whereas image noise values for 40- and 50-keV data sets reach from a minimum of 61.3 to a maximum of 204.7 HU. Overall correlation is weak ( r = 0.13, P = .005*), while strong dependency of image noise values on different kiloelectron volt can be appreciated; n = 500.](https://storage.googleapis.com/dl.dentistrykey.com/clinical/ObjectiveandSubjectiveImageQualityofLiverParenchymaandHepaticMetastaseswithVirtualMonoenergeticDualsourceDualenergyCTReconstructions/4_1s20S107663321400004X.jpg)
Get Radiology Tree app to read full this article<
Subjective Image Quality
Get Radiology Tree app to read full this article<
Table 1
Comparison of Subjective Image Quality Scores for 60-keV MEI, 70-keV MEI, and PEI Data Sets and Inter-rater Agreement
60-keV MEI 70-keV MEI PEI IR 3 (2–5) 5 (3–5) 4 (2–5) ER 3 (2–5) 4 (3–5) 4 (3–5) Difference, P value .68 <.0001 ∗ .33 Kappa 0.407 0.089 0.140
ER, experienced reader, IR, inexperienced reader, MEI, monoenergetic image, PEI, polyenergetic image.
Values are displayed as median (range). Differences between image quality scores of the two readers are calculated by paired Wilcoxon rank sum test. Inter-rater agreement is expressed by weighted Cohen’s kappa.
Get Radiology Tree app to read full this article<
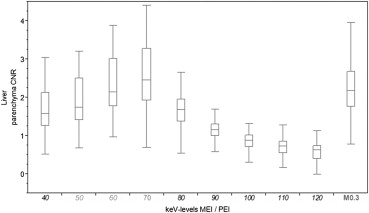
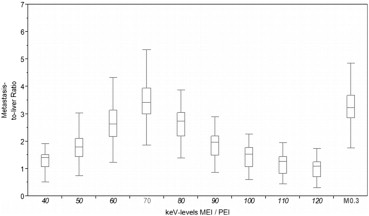
![Figure 6, Coherence between subjective image quality ratings and objective image quality measurements. Plotted are on the x-axis for monoenergetic image (MEI) at all investigated nine kiloelectron volt levels and the polyenergetic image (PEI) the median values of metastasis-to-liver ratio, contrast-to-noise ratio (CNR) of liver parenchyma, as well as the median rating of the data sets chosen for investigation of subjective image quality (monoenergetic 60 keV, 70 keV, and polyenergetic 0.3–average-weighted data sets [M0.3]) of ER and IR, respectively. ER = experienced reader; IR = inexperienced reader.](https://storage.googleapis.com/dl.dentistrykey.com/clinical/ObjectiveandSubjectiveImageQualityofLiverParenchymaandHepaticMetastaseswithVirtualMonoenergeticDualsourceDualenergyCTReconstructions/5_1s20S107663321400004X.jpg)
Get Radiology Tree app to read full this article<
Correlation of IQsub and patient size
Get Radiology Tree app to read full this article<
Table 2
Correlation of Patient Size (Represented by the Product of Anteroposterior and Transverse Patient Diameter) and Subjective Image Quality Ratings of IR and ER in 60-keV ME, 70-keV MEI, and PEI
ρ_P_ Value 60-keV MEI IR −0.56 <.0001 ∗ ER −0.34 .02 ∗ 70-keV MEI IR 0.03 .83 ER 0.04 .80 PEI IR −0.32 .02 ∗ ER 0.10 .50
ER, experienced reader, IR, inexperienced reader, MEI, monoenergetic image, PEI, polyenergetic image.
Correlation is expressed by nonparametric Spearman correlation coefficient ρ.
Get Radiology Tree app to read full this article<
Get Radiology Tree app to read full this article<
Discussion
Get Radiology Tree app to read full this article<
Get Radiology Tree app to read full this article<
Get Radiology Tree app to read full this article<
Get Radiology Tree app to read full this article<
Get Radiology Tree app to read full this article<
Get Radiology Tree app to read full this article<
Get Radiology Tree app to read full this article<
Get Radiology Tree app to read full this article<
Limitations
Get Radiology Tree app to read full this article<
Get Radiology Tree app to read full this article<
Get Radiology Tree app to read full this article<
Get Radiology Tree app to read full this article<
Get Radiology Tree app to read full this article<
Conclusions
Get Radiology Tree app to read full this article<
References
1. Casali P.G., Blay J.Y.: Gastrointestinal stromal tumors: ESMO Clinical Practice Guidelines for diagnosis, treatment and follow-up. Ann Oncol 2010; 21: pp. v98-102.
2. DeMatteo R.P., Lewis J.J., Leung D., et. al.: Two hundred gastrointestinal stromal tumors: recurrence patterns and prognostic factors for survival. Ann Surg 2000; 231: pp. 51-58.
3. Chourmouzi D., Sinakos E., Papalavrentios L., et. al.: Gastrointestinal stromal tumors: a pictorial review. J Gastrointestin Liver Dis 2009; 18: pp. 379-383.
4. Kalkmann J., Zeile M., Antoch G., et. al.: Consensus report on the radiological management of patients with gastrointestinal stromal tumours (gist): Recommendations of the German GIST Imaging Working Group. Cancer Imaging 2012; 12: pp. 126-135.
5. Lin X.Z., Wu Z.Y., Tao R., et. al.: Dual energy spectral CT imaging of insulinoma-value in preoperative diagnosis compared with conventional multi-detector CT. Eur J Radiol 2012; 81: pp. 2487-2494.
6. Schramm N., Englhart E., Schlemmer M., et. al.: Tumor response and clinical outcome in metastatic gastrointestinal stromal tumors under sunitinib therapy: Comparison of RECIST, Choi and volumetric criteria. Eur J Radiol 2013; 82: pp. 951-958.
7. Bechtold R.E., Chen M.Y., Stanton C.A., et. al.: Cystic changes in hepatic and peritoneal metastases from gastrointestinal stromal tumors treated with Gleevec. Abdom Imaging 2003; 28: pp. 808-814.
8. Linton K.M., Taylor M.B., Radford J.A.: Response evaluation in gastrointestinal stromal tumours treated with imatinib: misdiagnosis of disease progression on CT due to cystic change in liver metastases. Br J Radiol 2006; 79: pp. e40-e44.
9. Mabille M., Vanel D., Albiter M., et. al.: Follow-up of hepatic and peritoneal metastases of gastrointestinal tumors (GIST) under imatinib therapy requires different criteria of radiological evaluation (size is not everything!!!). Eur J Radiol 2009; 69: pp. 204-208.
10. Choi H., Charnsangavej C., de Castro Faria S., et. al.: CT evaluation of the response of gastrointestinal stromal tumors after imatinib mesylate treatment: a quantitative analysis correlated with FDG PET findings. AJR Am J Roentgenol 2004; 183: pp. 1619-1628.
11. Meyer M., Hohenberger P., Apfaltrer P., et. al.: CT-based response assessment of advanced gastrointestinal stromal tumor: dual energy CT provides a more predictive imaging biomarker of clinical benefit than RECIST or Choi criteria. Eur J Radiol 2013; 82: pp. 923-928.
12. Apfaltrer P., Meyer M., Meier C., et. al.: Contrast-enhanced dual-energy CT of gastrointestinal stromal tumors: is iodine-related attenuation a potential indicator of tumor response?. Invest Radiol 2012; 47: pp. 65-70.
13. Schramm N., Schlemmer M., Englhart E., et. al.: Dual energy CT for monitoring targeted therapies in patients with advanced gastrointestinal stromal tumor: initial results. Curr Pharm Biotechnol 2011; 12: pp. 547-557.
14. Heye T., Nelson R.C., Ho L.M., et. al.: Dual-energy CT applications in the abdomen. AJR Am J Roentgenol 2012; 199: pp. S64-S70.
15. Vlahos I., Godoy M.C., Naidich D.P.: Dual-energy computed tomography imaging of the aorta. J Thorac Imaging 2010; 25: pp. 289-300.
16. Yu L., Leng S., McCollough C.H.: Dual-energy CT-based monochromatic imaging. AJR Am J Roentgenol 2012; 199: pp. S9-S15.
17. Yu L., Christner J.A., Leng S., et. al.: Virtual monochromatic imaging in dual-source dual-energy CT: radiation dose and image quality. Med Phys 2011; 38: pp. 6371-6379.
18. Yamada Y., Jinzaki M., Tanami Y., et. al.: Virtual monochromatic spectral imaging for the evaluation of hypovascular hepatic metastases: the optimal monochromatic level with fast kilovoltage switching dual-energy computed tomography. Invest Radiol 2012; 47: pp. 292-298.
19. Flohr T.G., McCollough C.H., Bruder H., et. al.: First performance evaluation of a dual-source CT (DSCT) system. Eur Radiol 2006; 16: pp. 256-268.
20. Johnson T.R.C.: Dual-energy CT: general principles. AJR Am J Roentgenol 2012; 199: pp. S3-S8.
21. Kim K.S., Lee J.M., Kim S.H., et. al.: Image fusion in dual energy computed tomography for detection of hypervascular liver hepatocellular carcinoma: phantom and preliminary studies. Invest Radiol 2010; 45: pp. 149-157.
22. Behrendt F.F., Schmidt B., Plumhans C., et. al.: Image fusion in dual energy computed tomography: effect on contrast enhancement, signal-to-noise ratio and image quality in computed tomography angiography. Invest Radiol 2009; 44: pp. 1-6.
23. Altenbernd J., Heusner T.A., Ringelstein A., et. al.: Dual-energy-CT of hypervascular liver lesions in patients with HCC: investigation of image quality and sensitivity. Eur Radiol 2011; 21: pp. 738-743.
24. Robinson E., Babb J., Chandarana H., et. al.: Dual source dual energy MDCT: comparison of 80 kvp and weighted average 120 kvp data for conspicuity of hypo-vascular liver metastases. Invest Radiol 2010; 45: pp. 413-418.
25. Maki D.D., Birnbaum B.A., Chakraborty D.P., et. al.: Renal cyst pseudoenhancement: beam-hardening effects on CT numbers. Radiology 1999; 213: pp. 468-472.
26. Lin X.Z., Miao F., Li J.Y., et. al.: High-definition CT gemstone spectral imaging of the brain: initial results of selecting optimal monochromatic image for beam-hardening artifacts and image noise reduction. J Comput Assist Tomogr 2011; 35: pp. 294-297.
27. Matsumoto K., Jinzaki M., Tanami Y., et. al.: Virtual monochromatic spectral imaging with fast kilovoltage switching: improved image quality as compared with that obtained with conventional 120-kVp ct. Radiology 2011; 259: pp. 257-262.
28. De Cecco C.N., Darnell A., Macias N., et. al.: Virtual unenhanced images of the abdomen with second-generation dual-source dual-energy computed tomography: image quality and liver lesion detection. Invest Radiol 2013; 48: pp. 1-9.
29. Yuan R., Shuman W.P., Earls J.P., et. al.: Reduced iodine load at CT pulmonary angiography with dual-energy monochromatic imaging: comparison with standard CT pulmonary angiography—a prospective randomized trial. Radiology 2012; 262: pp. 290-297.