
Rational and Objectives
Image reporting is a vital component of patient management depending on individual radiologists’ performance. Our objective was to explore mammographic diagnostic efficacy in a country where breast cancer screening does not exist.
Materials and Methods
Two mammographic test sets were used: a typical screening (TS) and high-difficulty (HD) test set. Nonscreening (NS) radiologists (n = 11) read both test sets, while 52 and 49 screening radiologists read the TS and HD test sets, respectively. The screening radiologists were classified into two groups: a less experienced (LE) group with ≤5 years’ experience and a more experienced (ME) group with ≥5 years’ experience.
A Kruskal–Wallis and Tukey–Kramer post hoc test were used to compare reading performance among reader groups, and the Wilcoxon matched pairs tests was used to compare TS and ND test sets for the NS radiologists.
Results
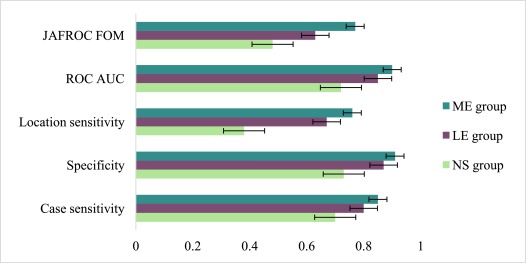
Across the three reader groups, there were significant differences in case sensitivity (χ 2 [2] = 9.4, P = .008), specificity (χ 2 [2] = 10.3, P = .006), location sensitivity (χ 2 [2] = 19.8, P < .001), receiver operating characteristics, area under the curve (χ 2 [2] = 19.7, P < .001) and jack-knife free-response receiver operating characteristics (JAFROCs) (χ 2 [2] = 18.1, P < .001).
NS performance for all measured scores was significantly lower than those for the ME readers ( P < .006), while only location sensitivity was lower (χ 2 [2] = 17.5, P = .026) for the NS compared to the LE group. No other significant differences were observed.
Conclusion
Large variations in mammographic performance exist between radiologists from screening and nonscreening countries.
Introduction
Get Radiology Tree app to read full this article<
Get Radiology Tree app to read full this article<
Get Radiology Tree app to read full this article<
Get Radiology Tree app to read full this article<
Get Radiology Tree app to read full this article<
Materials and Methods
Get Radiology Tree app to read full this article<
Test Sets
Get Radiology Tree app to read full this article<
Get Radiology Tree app to read full this article<
Get Radiology Tree app to read full this article<
TS Test Set
Get Radiology Tree app to read full this article<
HD Test Set
Get Radiology Tree app to read full this article<
Study Participants
Get Radiology Tree app to read full this article<
Get Radiology Tree app to read full this article<
Get Radiology Tree app to read full this article<
TABLE 1
Characteristics of All Radiologists Included in the Study
Reader Parameters NS Group (n = 11) LE Screening Group (n = 46) ME Screening Group (n = 55) Age 32 (6) 41 (9) 51 (17) Number of years reading mammograms 0 (3) 2 (5) 15 (10) Number of hours reading mammograms per week ≤4 10 [91] 23 [50] 17 [31] 5–15 1 [9] 12 [26] 32 [58] ≥16 0 11 [24] 6 [11] Number of cases reading mammograms per week ≤20 9 [82] 21 [46] 13 [24] 21–100 2 [18] 14 [30] 23 [42] ≥101 0 11 [24] 19 [34] Fellowship training of more than 3 months Yes 0 22 [48] 39 [71] No 11 [100] 24 [52] 16 [29]
Note: Numbers in rounded parentheses represent interquartile range, while those in square parentheses indicate percentage values.
LE, less experienced screening radiologists; ME, more experienced screening radiologists.
Get Radiology Tree app to read full this article<
The NS Group
Get Radiology Tree app to read full this article<
The Screening Group
Get Radiology Tree app to read full this article<
Test Set Reading
Get Radiology Tree app to read full this article<
Get Radiology Tree app to read full this article<
The Performance Metrics
Get Radiology Tree app to read full this article<
Data Analyses
Get Radiology Tree app to read full this article<
Get Radiology Tree app to read full this article<
Get Radiology Tree app to read full this article<
Get Radiology Tree app to read full this article<
Results
Get Radiology Tree app to read full this article<
Get Radiology Tree app to read full this article<
Get Radiology Tree app to read full this article<
TABLE 2
Pairwise Differences between Reader Cohorts across the Three Groups;. the Numbers Represent P Values
Performance Metrics NS vs LE Screening Readers NS vs ME Screening Readers LE vs ME Screening Readers Case sensitivity .153 .006 \* .646 Specificity .429 .006 \* .185 Location sensitivity .026 \* <.001 \* .14 ROC (AUC) .132 <.001 \* .029 \* JAFROC (FOM) .077 <.001 \* .088
Get Radiology Tree app to read full this article<
Get Radiology Tree app to read full this article<
Get Radiology Tree app to read full this article<
Get Radiology Tree app to read full this article<
TABLE 3
Case Sensitivity by Lesion Type in the TS Test Set among Three Groups
Lesion Types NS Group (n = 11) LE Screening Group (n = 19) ME Screening Group (n = 30)P value Architectural distortion/stellate 84.8 (17.4) 84.2 (23.2) 90.0 (17.4) .372 Nonspecific density 72.7 (41.0) 81.5 (29.8) 86.6 (22.5) .661 Architectural distortion 66.6 (29.8) 77.1 (29.5) 83.3 (22.7) .201 Stellate lesion 61.0 (20.3) 74.4 (26.0) 88.0 (12.5) .002 \* Discrete mass/calcifications 59.0 (43.7) 68.4 (41.5) 73.3 (28.4) .687 Calcifications 59.0 (37.5) 73.8 (33.9) 71.6 (34.0) .491 Speculated mass 39.3 (29.0) 64.8 (36.0) 73.3 (28.2) .013 \*
Numbers in parenthesis are standard deviations.
LE, less experienced; ME, more experienced; NS, nonscreening.
Get Radiology Tree app to read full this article<
Get Radiology Tree app to read full this article<
Get Radiology Tree app to read full this article<
TABLE 4
The Performance Metrics of the NS Group in TS and HD Test Sets
Performance Metrics TS Median (IQR) HD Median (IQR) Case sensitivity 0.7 (0.12) 0.57 (0.07) Specificity 0.73 (0.14) 0.83 (0.1) Location sensitivity 0.38 (0.21) 0.31 (0.3) ROC (AUC) 0.72 (0.13) 0.77 (0.06) JAFROC (FOM) 0.48 (0.14) 0.46 (0.07)
Note: None of the comparisons were statistically significant.
IQR, interquartile range; JAFROC (FOM), Jack-knife Free-response receiver operating characteristics, figure of merit; ROC (AUC), receiver operating characteristics, area under the curve.
Get Radiology Tree app to read full this article<
Get Radiology Tree app to read full this article<
Discussion
Get Radiology Tree app to read full this article<
Get Radiology Tree app to read full this article<
Get Radiology Tree app to read full this article<
Get Radiology Tree app to read full this article<
Get Radiology Tree app to read full this article<
Get Radiology Tree app to read full this article<
Get Radiology Tree app to read full this article<
Get Radiology Tree app to read full this article<
Acknowledgments
Get Radiology Tree app to read full this article<
References
1. Anderson B.O., Ilbawi A.M., El Saghir N.S.: Breast cancer in low and middle income countries (LMICs): a shifting tide in global health. Breast J 2015; 21: pp. 111-118. PubMed PMID: WOS:000347841300015
2. Fan L., Strasser-Weippl K., Li J.J., et. al.: Breast cancer in China. Lancet Oncol 2014; 15:
3. Breast Cancer Survival in Mongolian Women [Internet]. Available at http://www.scirp.org/journal/PaperInformation.aspx?PaperID=64477
4. Tabar L., Dean P.B.: Thirty years of experience with mammography screening: a new approach to the diagnosis and treatment of breast cancer. Breast Cancer Res 2008; 10: pp. S3. PubMed PMID: PMC2614855.
5. Tabar L., Yen A.M., Wu W.Y., et. al.: Insights from the breast cancer screening trials: how screening affects the natural history of breast cancer and implications for evaluating service screening programs. Breast J 2015; 21: pp. 13-20. Epub 2014/11/22; PubMed PMID 25413699
6. Moss S.M., Wale C., Smith R., et. al.: Effect of mammographic screening from age 40 years on breast cancer mortality in the UK Age trial at 17 years’ follow-up: a randomised controlled trial. Lancet Oncol 2015; 16: pp. 1123-1132.
7. Morrell S., Taylor R., Roder D., et. al.: Mammography service screening and breast cancer mortality in New Zealand: a National Cohort Study 1999–2011. Br J Cancer 2017; 116: pp. 828-839. Epub 2017/02/10; PubMed PMID 28183141 PubMed Central PMCID: PMCPMC5355933
8. Bhoo-Pathy N., Yip C.H., Hartman M., et. al.: Breast cancer research in Asia: adopt or adapt Western knowledge?. Eur J Cancer 2013; 49: pp. 703-709. 000313947100018
9. Li J., Shao Z.: Mammography screening in less developed countries. Springerplus 2015; 4: pp. 1-12.
10. WHO : Position paper on mammographic screening. Available at http://www.who.int/cancer/publications/mammography_screening/en/
11. Sankaranarayanan R., Ramadas K., Thara S., et. al.: Clinical breast examination: preliminary results from a cluster randomized controlled trial in India. J Natl Cancer Inst 2011; 103: pp. 1476-1480. PubMed PMID 21862730
12. Mittra I., Mishra G.A., Singh S., et. al.: A cluster randomized, controlled trial of breast and cervix cancer screening in Mumbai, India: methodology and interim results after three rounds of screening. Int J Cancer 2010; 126: pp. 976-984. Epub 2009/08/22; PubMed PMID 19697326
13. Tabar L., Dean P.B., Kaufman C.S., et. al.: A new era in the diagnosis of breast cancer. Surg Oncol Clin N Am 2000; 9: pp. 233-277. Epub 2000/04/11; PubMed PMID 10757844
14. Bruno M.A., Walker E.A., Abujudeh H.H.: Understanding and confronting our mistakes: the epidemiology of error in radiology and strategies for error reduction. Radiographics 2015; 35: pp. 1668-1676. Epub 2015/10/16; PubMed PMID 26466178
15. Giess C.S., Frost E.P., Birdwell R.L.: Difficulties and errors in diagnosis of breast neoplasms. Semin Ultrasound CT MR 2012; 33: pp. 288-299. Epub 2012/07/25; PubMed PMID 22824119
16. Kim Y.W., Mansfield L.T.: Fool me twice: delayed diagnoses in radiology with emphasis on perpetuated errors. AJR Am J Roentgenol 2014; 202: pp. 465-470. Epub 2014/02/22; PubMed PMID 24555582
17. Brady A.P.: Error and discrepancy in radiology: inevitable or avoidable?. Insights Imaging 2017; 8: pp. 171-182. PubMed PMID: PMC5265198
18. Demchig D., Mello-Thoms C., Khurelsukh K., et. al.: Early detection of breast cancer: what is the impact of a screening program on radiologists’ performance? Journal of Medical Imaging and Radiation Oncology.2009. under review
19. Brennan P.C.L.W.: BreastScreen Reader Assessment Strategy (BREAST) University of Sydney. Available at http://sydney.edu.au/health-sciences/breastaustralia/
20. AIHW : Breastscreening Australia, monitoring report, 2011–2012. Australian Institute of Health and Welfare2014.
21. Kundel H.L., Nodine C.F., Conant E.F., et. al.: Holistic component of image perception in mammogram interpretation: gaze-tracking study. Radiology 2007; 242: pp. 396-402. Epub 2007/01/27; PubMed PMID 17255410
22. Kan L., Olivotto I.A., Warren Burhenne L.J., et. al.: Standardized abnormal interpretation and cancer detection ratios to assess reading volume and reader performance in a breast screening program. Radiology 2000; 215: pp. 563-567. Epub 2000/05/05; PubMed PMID 10796940
23. Rawashdeh M.A., Lee W.B., Bourne R.M., et. al.: Markers of good performance in mammography depend on number of annual readings. Radiology 2013; 269: pp. 61-67. Epub 2013/06/06; PubMed PMID 23737538
24. Rehani B., Zhang Y.C., Rehani M.M., et. al.: Radiology education in Europe: analysis of results from 22 European countries. World J Radiol 2017; 9: pp. 55-62. 5334502
25. Rumack C.M.: American diagnostic radiology residency and fellowship programmes. Ann Acad Med Singapore 2011; 40: pp. 126-131. Epub 2011/05/24; PubMed PMID 21603730
26. Suleiman W.I., Lewis S.J., Georgian-Smith D., et. al.: Number of mammography cases read per year is a strong predictor of sensitivity. J Med Imaging 2014; 1: PubMed PMID: PMC4478883. 015503
27. Troisi R., Altantsetseg D., Davaasambuu G., et. al.: Breast cancer incidence in Mongolia. CCC 2012; 23: pp. 1047-1053. PubMed PMID 22543542 PubMed Central PMCID: PMC3786577
28. Wolfe J.M., Horowitz T.S., Van Wert M.J., et. al.: Low target prevalence is a stubborn source of errors in visual search tasks. J Exp Psychol Gen 2007; 136: pp. 623-638. Epub 2007/11/15; PubMed PMID 17999575 PubMed Central PMCID: PMCPMC2662480
29. Evans K.K., Birdwell R.L., Wolfe J.M.: If you don’t find it often, you often don’t find it: why some cancers are missed in breast cancer screening. PLoS ONE 2013; 8: e64366; PubMed PMID: PMC3667799
30. Gur D., Rockette H.E., Armfield D.R., et. al.: Prevalence effect in a laboratory environment. Radiology 2003; 228: pp. 10-14.
31. Reed W.M., Ryan J.T., McEntee M.F., et. al.: The effect of abnormality-prevalence expectation on expert observer performance and visual search. Radiology 2011; 258: pp. 938-943.
32. Suleiman W.I., Rawashdeh M.A., Lewis S.J., et. al.: Impact of Breast Reader Assessment Strategy on mammographic radiologists’ test reading performance. J Med Imaging Radiat Oncol 2016; 60: pp. 352-358. Epub 2016/04/12; PubMed PMID 27062490
33. Scott H.J., Gale A.G.: Breast screening: PERFORMS identifies key mammographic training needs. Br J Radiol 2006; 79: pp. S127-S133. Epub 2007/01/09; PubMed PMID 17209118
34. Button K.S., Ioannidis J.P.A., Mokrysz C., et. al.: Power failure: why small sample size undermines the reliability of neuroscience. Nat Rev Neurosci 2013; 14: pp. 365-376.
35. Reed W.M., Lee W.B., Cawson J.N., et. al.: Malignancy detection in digital mammograms: important reader characteristics and required case numbers. Acad Radiol 2010; 17: pp. 1409-1413. Epub 2010/08/20; PubMed PMID 20719545