
Rationale and Objectives
Subtle subject movement during high-resolution three-dimensional micro–magnetic resonance imaging of trabecular bone (TB) causes blurring, thereby rendering the data unreliable for quantitative analysis. In this work, the effects of translational and rotational motion displacements were evaluated qualitatively and quantitatively.
Materials and Methods
In experiment 1, motion was induced by applying various simulated and previously observed in vivo trajectories as phase shifts to k-space or rotation angles to k-space segments of a virtually motion-free data set. In experiment 2, images that were visually free of motion artifacts from two groups of 10 healthy individuals, differing in age, were selected to probe the effects of motion on TB parameters. In both experiments, images were rated for motion severity, and the scores were compared to a focus criterion, the normalized gradient squared.
Results
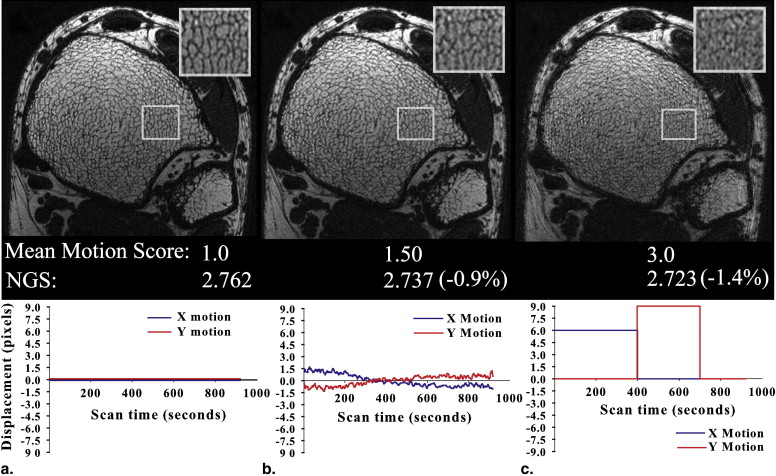
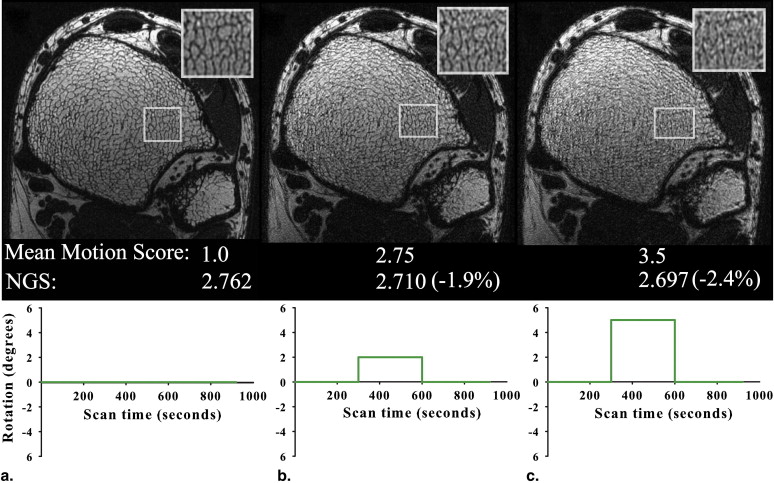
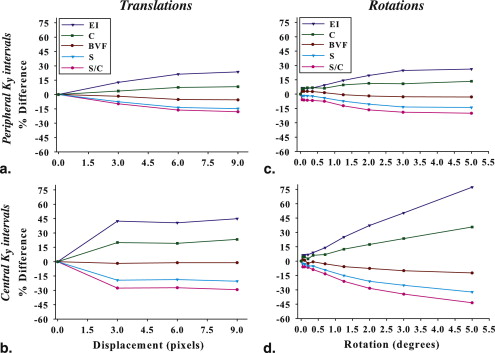
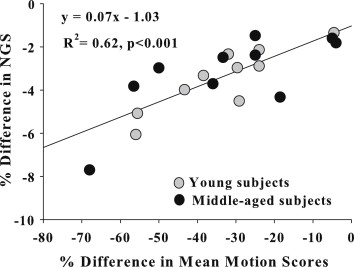
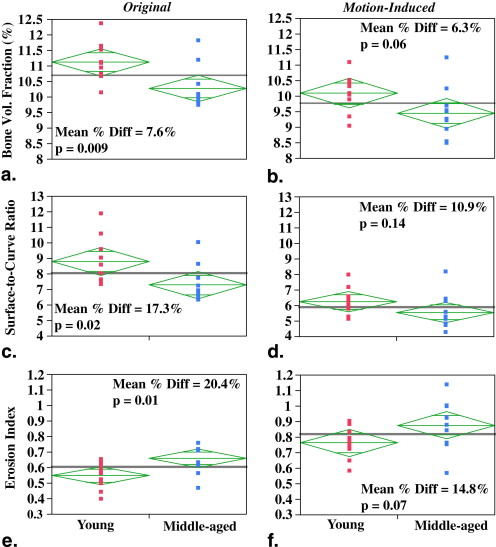
Strong correlations were observed between the motion quality scores and the corresponding normalized gradient squared values ( R 2 = 0.52–0.64, P < .01). The results from experiment 1 demonstrated consistently lower image quality and alterations in structural parameters of 9% to 45% with increased amplitude of displacements. In experiment 2, the significant differences in structural parameter group means of the motion-free images were lost upon motion degradation. Autofocusing, a postprocessing correction method, partially recovered the sharpness of the original motion-free images in 13 of 20 subjects.
Conclusions
Quantitative TB structural measures are highly sensitive to subtle motion-induced degradation, which adversely affects precision and statistical power. The results underscore the influence of subject movement in high-resolution three-dimensional micro–magnetic resonance imaging and its correction for TB structure analysis.
Osteoporosis, a disorder of bone remodeling imbalance, is usually assessed on the basis of bone mineral density, a surrogate marker of bone strength, typically obtained by dual-energy x-ray absorptiometry . Despite its ubiquity in the assessment of bone integrity, bone mineral density does not yield insights into bone quality, a somewhat elusive physical property based on the integrity of trabecular and cortical bone microstructure . Three-dimensional micro–magnetic resonance imaging (μMRI) acquisition and processing techniques enable direct visualization and quantification of trabecular bone (TB) architecture in response to aging or drug treatment of osteoporosis . One such suite of three-dimensional (3D) image acquisition and processing methods, the virtual bone biopsy (VBB) , has demonstrated reproducible and accurate quantification of TB architectural measures at peripheral locations. A number of investigators have performed structural analysis in patients at the distal radius , tibia , and calcaneus in vivo. The structural changes at these peripheral sites are strongly associated with similar changes occurring elsewhere in the skeleton , can be predictive of fracture status , and serve as useful markers for monitoring disease status.
The ability to accurately retrieve the 3D architectural features of TB depends on several parameters that include signal-to-noise ratio (SNR), voxel size, accurate coregistration of baseline and follow-up images in longitudinal studies, and motion during data acquisition . Motion degradation on MR images can be attributed to macroscopic motion that encompasses both physiologic motion, from respiration, cardiac pulsations, or peristalsis and involuntary subject movement during the scan. Although the former probably have minor effects, the latter are the key source of loss of image sharpness in μMRI of the distal extremities . The problem is exacerbated by the high resolution necessary for accurate retrieval of the 3D architecture of trabecular networks, which demand relatively long scan times (about 10–15 minutes), even though parallel imaging has the potential to substantially shorten acquisition times . Given image pixel sizes on the order of 100 μm, even submillimeter displacements arising from involuntary motion can be detrimental for TB microimages, and they are difficult to prevent despite using tight immobilization .
Get Radiology Tree app to read full this article<
Get Radiology Tree app to read full this article<
Get Radiology Tree app to read full this article<
Materials and methods
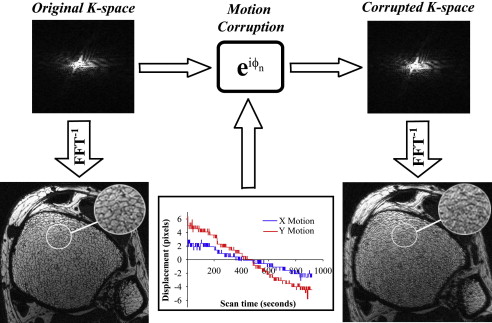
Motion Simulation Theory
Get Radiology Tree app to read full this article<
s˜(kx,ky)=e−i(kx,ky)s(kx,ky), s
˜
(
k
x
,
k
y
)
=
e
−
i
(
k
x
,
k
y
)
s
(
k
x
,
k
y
)
,
where
(kx,ky)=2π(kxΔx+kyΔy). (
k
x
,
k
y
)
=
2
π
(
k
x
Δ
x
+
k
y
Δ
y
)
.
Here, Δ x and Δ y are the applied translational shifts in the x and y directions, respectively, for each k-space line.
Get Radiology Tree app to read full this article<
Get Radiology Tree app to read full this article<
Image Acquisition, Reconstruction, and Preprocessing
Get Radiology Tree app to read full this article<
Get Radiology Tree app to read full this article<
Get Radiology Tree app to read full this article<
Postprocessing and Analysis
Get Radiology Tree app to read full this article<
Experiment 1
Get Radiology Tree app to read full this article<
Table 1
Range of Retrospective in Vivo Translational Motion Trajectories Providing Displacements Along x and y for Each of the Five Trajectories
Trajectory_x_ Motion, Pixels (Range)y Motion, Pixels (Range) 1 4.0 (−1.0 to 3.0) 4.0 (−1.8 to 2.2) 2 6.0 (−4.5 to 1.5) 4.4 (−2.2 to 2.2) 3 8.0 (−2.5 to 5.5) 5.3 (−2.2 to 3.1) 4 7.0 (−3.5 to 3.5) 4.5 (−3.1 to 1.4) 5 2.8 (−1.3 to 1.5) 2.3 (−1.3 to 1.0)
Table 2
Synthetic Translational Motion Trajectories
x Motion_y_ Motion Trajectory Pixels k y Interval Pixels k y Interval 1 3.0 1–150 0.0 0 2 6.0 1–150 0.0 0 3 9.0 1–150 0.0 0 4 0.0 0 3.0 200–350 5 0.0 0 6.0 200–350 6 0.0 0 9.0 200–350 7 1.0 1–150 3.0 1–150 8 3.0 200–350 3.0 200–350 9 6.0 1–200 9.0 200–350
The step-function displacements (in pixels) along x and y are given for different k y intervals.
Table 3
Simulated Rotational Motional Trajectories
Trajectory Rotation k y Interval 1 0.05° 0–150 2 0.10° 0–150 3 0.20° 0–150 4 0.05° 151–300 5 0.10° 151–300 6 0.20° 151–300 7 0.35° 0–150 8 0.70° 0–150 9 1.25° 0–150 10 2.0° 0–150 11 3.0° 0–150 12 5.0° 0–150 13 0.35° 151–300 14 0.70° 151–300 15 1.25° 151–300 16 2.0° 151–300 17 3.0° 151–300 18 5.0° 151–300
In-plane rotations are given for various k y intervals.
Get Radiology Tree app to read full this article<
Get Radiology Tree app to read full this article<
NGS=∑i,j(|Gi,j|2)(∑i,j|Gi,j|)2, NGS
=
∑
i
,
j
(
|
G
i
,
j
|
2
)
(
∑
i
,
j
|
G
i
,
j
|
)
2
,
where | G i , j | is the pixel intensity gradient at voxel coordinate ( i , j ) and is computed from the square root of the sum of squares of x and y gradients over all images. The gradients were computed by using a simple nearest neighbor filter of [−1, 1]. All masked images subsequently underwent VBB processing to quantify the effect of motion on structure and topology.
Get Radiology Tree app to read full this article<
Experiment 2
Get Radiology Tree app to read full this article<
Get Radiology Tree app to read full this article<
Get Radiology Tree app to read full this article<
Statistical Analysis
Get Radiology Tree app to read full this article<
Results
Experiment 1
Get Radiology Tree app to read full this article<
![Figure 2, Comparison of mean motion scores versus normalized gradient squared (NGS) for simulations of translational and rotational motion. The solid regression line is fitted to the uncorrupted image (gray circle) and 14 images with varying levels of induced translations (in vivo trajectories, green circles [ Table 1 ]; synthetic trajectories, black circles [ Table 2 ]). The dashed regression line is fitted to 18 images with various degrees of induced rotations (red and blue triangles; Table 3 ) and the original image. Red and blue represent rotations applied during peripheral and central k y intervals, respectively.](https://storage.googleapis.com/dl.dentistrykey.com/clinical/OntheSignificanceofMotionDegradationinHighresolution3DMRIofTrabecularBone/1_1s20S1076633211003011.jpg)
Get Radiology Tree app to read full this article<
Get Radiology Tree app to read full this article<
Get Radiology Tree app to read full this article<
Experiment 2
Get Radiology Tree app to read full this article<
Get Radiology Tree app to read full this article<
Get Radiology Tree app to read full this article<
Discussion
Get Radiology Tree app to read full this article<
Get Radiology Tree app to read full this article<
Get Radiology Tree app to read full this article<
Get Radiology Tree app to read full this article<
Get Radiology Tree app to read full this article<
Get Radiology Tree app to read full this article<
Conclusions
Get Radiology Tree app to read full this article<
Get Radiology Tree app to read full this article<
References
1. Recker R.R., Barger-Lux M.J.: The elusive concept of bone quality. Curr Osteoporos Rep 2004; 2: pp. 97-100.
2. Genant H.K., Jiang Y.: Advanced imaging assessment of bone quality. Ann N Y Acad Sci 2006; 1068: pp. 410-428.
3. Wehrli F.W.: Structural and functional assessment of trabecular and cortical bone by micro magnetic resonance imaging. J Magn Reson Imaging 2007; 25: pp. 390-409.
4. Krug R., Burghardt A.J., Majumdar S., et. al.: High-resolution imaging techniques for the assessment of osteoporosis. Radiol Clin North Am 2010; 48: pp. 601-621.
5. Wehrli F.W., Saha P.K., Gomberg B.R., et. al.: Noninvasive assessment of bone architecture by magnetic resonance micro-imaging-based virtual bone biopsy. Proc IEEE 2003; 91: pp. 1520-1542.
6. Majumdar S., Newitt D., Mathur A., et. al.: Magnetic resonance imaging of trabecular bone structure in the distal radius: relationship with X-ray tomographic microscopy and biomechanics. Osteoporos Int 1996; 6: pp. 376-385.
7. Wehrli F.W., Hwang S.N., Ma J., et. al.: Cancellous bone volume and structure in the forearm: noninvasive assessment with MR microimaging and image processing. Radiology 1998; 206: pp. 347-357.
8. Benito M., Gomberg B., Wehrli F.W., et. al.: Deterioration of trabecular architecture in hypogonadal men. J Clin Endocrinol Metab 2003; 88: pp. 1497-1502.
9. Link T.M., Majumdar S., Augat P., et. al.: In vivo high resolution MRI of the calcaneus: differences in trabecular structure in osteoporosis patients. J Bone Miner Res 1998; 13: pp. 1175-1182.
10. Chesnut C.H., Majumdar S., Newitt D.C., et. al.: Effects of salmon calcitonin on trabecular microarchitecture as determined by magnetic resonance imaging: results from the QUEST study. J Bone Miner Res 2005; 20: pp. 1548-1561.
11. Ladinsky G.A., Vasilic B., Popescu A.M., et. al.: Trabecular structure quantified with the MRI-based virtual bone biopsy in postmenopausal women contributes to vertebral deformity burden independent of areal vertebral BMD. J Bone Miner Res 2008; 23: pp. 64-74.
12. Wehrli F.W., Gomberg B.R., Saha P.K., et. al.: Digital topological analysis of in vivo magnetic resonance microimages of trabecular bone reveals structural implications of osteoporosis. J Bone Miner Res 2001; 16: pp. 1520-1531.
13. Link T.M., Bauer J., Kollstedt A., et. al.: Trabecular bone structure of the distal radius, the calcaneus, and the spine: which site predicts fracture status of the spine best?. Invest Radiol 2004; 39: pp. 487-497.
14. Lin W., Ladinsky G.A., Wehrli F., et. al.: Image metric-based correction (autofocusing) of motion artifacts in high-resolution trabecular bone imaging. J Magn Reson Imaging 2007; 26: pp. 191-197.
15. Banerjee S., Choudhury S., Han E.T., et. al.: Autocalibrating parallel imaging of in vivo trabecular bone microarchitecture at 3 Tesla. Magn Reson Med 2006; 56: pp. 1075-1084.
16. Gomberg B.R., Wehrli F.W., Vasilic B., et. al.: Reproducibility and error sources of micro-MRI-based trabecular bone structural parameters of the distal radius and tibia. Bone 2004; 35: pp. 266-276.
17. Song H.K., Wehrli F.W.: In vivo micro-imaging using alternating navigator echoes with applications to cancellous bone structural analysis. Magn Reson Med 1999; 41: pp. 947-953.
18. Hedley M., Yan H.: Motion artifact suppression: a review of post-processing techniques. Magn Reson Imaging 1992; 10: pp. 627-635.
19. Vasilic B., Ladinsky G.A., Saha P.K., et. al.: Micro-MRI-based image acquisition and processing system for assessing the response to therapeutic intervention. Proc SPIE 2006; 6143: 61430W
20. Ehman R.L., Felmlee J.P.: Adaptive technique for high-definition MR imaging of moving structures. Radiology 1989; 173: pp. 255-263.
21. Atkinson D., Hill D.L.G., Stoyle P.N.R., et. al.: Automatic correction of motion artifacts in magnetic resonance images using an entropy focus criterion. IEEE Trans Med Imaging 1997; 16: pp. 903-910.
22. Manduca A., McGee K.P., Welch E.B., et. al.: Autocorrection in MR imaging: adaptive motion correction without navigator echoes. Radiology 2000; 215: pp. 904-909.
23. Larkin K.G., Oldfield M.A., Klemm H.: Fast Fourier method for the accurate rotation of sampled images. Optics Commun 1997; 139: pp. 99-106.
24. Eddy W.F., Fitzgerald M., Noll D.C.: Improved image registration by using Fourier interpolation. Magn Reson Med 1996; 36: pp. 923-931.
25. Ma J., Wehrli F.W., Song H.K.: Fast 3D large-angle spin-echo imaging (3D FLASE). Magn Reson Med 1996; 35: pp. 903-910.
26. Magland J.F., Wald M.J., Wehrli F.W.: Spin-echo micro-MRI of trabecular bone using improved 3D fast large-angle spin-echo (FLASE). Magn Reson Med 2009; 61: pp. 1114-1121.
27. Magland J.F., Wehrli F.W.: Trabecular bone structure analysis in the limited spatial resolution regime of in vivo MRI. Acad Radiol 2008; 15: pp. 1482-1493.
28. Vasilic B., Wehrli F.W.: A novel local thresholding algorithm for trabecular bone volume fraction mapping in the limited spatial resolution regime of in-vivo MRI. IEEE Trans Med Imaging 2005; 24: pp. 1574-1585.
29. Gomberg B.G., Saha P.K., Song H.K., et. al.: Topological analysis of trabecular bone MR images. IEEE Trans Med Imaging 2000; 19: pp. 166-174.
30. McGee K.P., Manduca A., Felmlee J.P., et. al.: Image metric-based correction (autocorrection) of motion effects: analysis of image metrics. J Magn Reson Imaging 2000; 11: pp. 174-181.
31. Lin W., Song H.K.: Improved optimization strategies for autofocusing motion compensation in MRI via the analysis of image metric maps. Magn Reson Imaging 2006; 24: pp. 751-760.
32. Chmura Kraemer H., Periyakoil V.S., Noda A.: Kappa coefficients in medical research. Stat Med 2002; 21: pp. 2109-2129.
33. Newitt D.C., van Rietbergen B., Majumdar S.: Processing and analysis of in vivo high-resolution MR images of trabecular bone for longitudinal studies: reproducibility of structural measures and micro-finite element analysis derived mechanical properties. Osteoporos Int 2002; 13: pp. 278-287.
34. Wald M.J., Magland J.F., Rajapakse C.S., et. al.: Structural and mechanical parameters of trabecular bone estimated from in vivo high-resolution magnetic resonance images at 3 Tesla field strength. J Magn Reson Imaging 2010; 31: pp. 1157-1168.
35. Wehrli F.W., Song H.K., Saha P.K., et. al.: Quantitative MRI for the assessment of bone structure and function. NMR Biomed 2006; 19: pp. 731-764.
36. Wehrli F.W., Ladinsky G.A., Jones C., et. al.: In vivo magnetic resonance detects rapid remodeling changes in the topology of the trabecular bone network after menopause and the protective effect of estradiol. J Bone Miner Res 2008; 23: pp. 730-740.
37. Li C.Q., Magland J.F., Rajapakse C.S., et. al.: Implications of resolution and noise for in vivo micro-MRI of trabecular bone. Med Phys 2008; 35: pp. 5584-5594.
38. Benito M., Vasilic B., Wehrli F.W., et. al.: Effect of testosterone replacement on bone architecture in hypogonadal men. J Bone Miner Res 2005; 20: pp. 1785-1791.
39. Fu Z.W., Wang Y., Grimm R.C., et. al.: Orbital navigator echoes for motion measurements in magnetic resonance imaging. Magn Reson Med 1995; 34: pp. 746-753.
40. Pipe J.G.: Motion correction with PROPELLER MRI: application to head motion and free-breathing cardiac imaging. Magn Reson Med 1999; 42: pp. 963-969.
41. Mendes J., Kholmovski E., Parker D.L.: Rigid-body motion correction with self-navigation MRI. Magn Reson Med 2009; 61: pp. 739-747.
42. Welch E.B., Manduca A., Grimm R.C., et. al.: Spherical navigator echoes for full 3D rigid body motion measurement in MRI. Magn Reson Med 2002; 47: pp. 32-41.
43. Bammer R., Aksoy M., Liu C.: Augmented generalized SENSE reconstruction to correct for rigid body motion. Magn Reson Med 2007; 57: pp. 90-102.
44. Sode M., Burghardt A.J., Pialat J.B., et. al.: Quantitative characterization of subject motion in HR-pQCT images of the distal radius and tibia. Bone 2011; 48: pp. 1291-1297.