
Rationale and Objectives
To evaluate the ability of diffusion-weighted magnetic resonance imaging (DWI) in differentiating malignant thyroid nodules from benign lesions with a meta-analysis.
Materials and Methods
Articles in English and Chinese language relating to the accuracy of DWI for this utility were retrieved. Pooled estimation and subgroup analysis data were obtained by statistical analysis.
Results
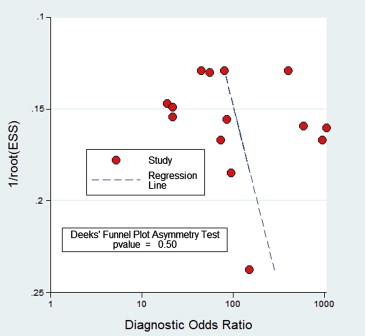
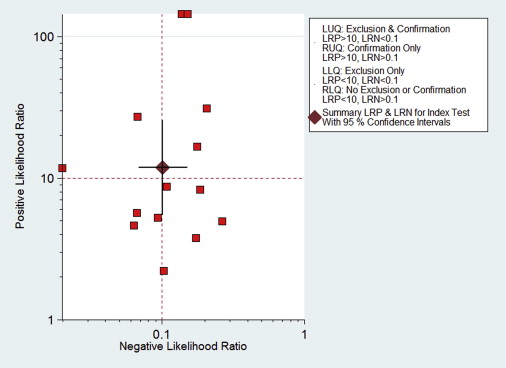
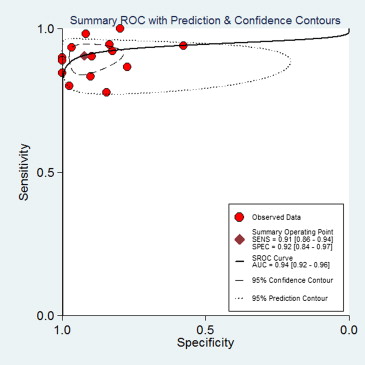
A total of seven studies (17 subsets) with 358 patients, who fulfilled all of the inclusion criteria, were considered for the analysis. No publication bias was found (bias = 7.03, P > .05). Methodological quality was relatively high. DWI sensitivity was 0.91 (95% confidence interval [CI], 0.87–0.94) and specificity was 0.93 (95% CI, 0.86–0.96). Overall, positive likelihood ratio was 12.24 (95% CI, 6.47–23.20) and negative likelihood ratio was 0.99 (95% CI, 0.06–0.15). Diagnostic odds ratio was 123.78 (95% CI, 56.85–269.48). The area under the curve of the summary receiver operating characteristic was 0.94 (95% CI, 0.92–0.96). In patients with high pretest probabilities, DWI enabled confirmation of malignant thyroid lesion; in patients with low pretest probabilities, DWI enabled exclusion of malignant thyroid lesion. Worst-case-scenario (pretest probability, 50%) posttest probabilities were 92% and 9% for positive and negative DWI results, respectively.
Conclusions
A limited number of small studies suggests that quantitative DWI is a reliable diagnostic method for differentiation between benign and malignant thyroid lesions.
Thyroid nodules are commonly encountered in routine medical care. Almost 20% of the population has a palpable thyroid nodule, and approximately 70% has a nodule that can be detected by ultrasound . Most nodules are asymptomatic, with less than 5% of palpable thyroid nodules being malignant .
Magnetic resonance imaging (MRI) has gained importance in the diagnosis of thyroid cancer . The application of diffusion-weighted MRI (DWI) is an important diagnostic tool for assessing in vivo tumor characterization . Several studies have shown that DWI has the potential to differentiate benign from malignant nodules in the thyroid . Structural changes of malignancies or benign thyroid tissue can be evaluated with the apparent diffusion coefficient (ADC), which is an objective parameter of the tissue-specific diffusion capacity of a biologic tissue .
Get Radiology Tree app to read full this article<
Materials and methods
Literature Search
Get Radiology Tree app to read full this article<
Get Radiology Tree app to read full this article<
Get Radiology Tree app to read full this article<
Inclusion and Exclusion Criteria
Get Radiology Tree app to read full this article<
Data Extraction and Quality Assessment
Get Radiology Tree app to read full this article<
Statistical Analysis
Get Radiology Tree app to read full this article<
Get Radiology Tree app to read full this article<
Get Radiology Tree app to read full this article<
Get Radiology Tree app to read full this article<
Results
Literature Search and Selection of Studies
Get Radiology Tree app to read full this article<
Table 1
The Principal Characteristics Eligible Studies
Study ID First Author Year Country No. of Patients No. of Total Lesions No. of Benign Lesions No. of Malignant Lesions Design Average Age, Years (range) M/F Patients Enrollment Coil Blind Field Strength Population Selection Reference Standard The Time Interval between MRI Examination and Reference Standard 1. Mutlu 2012 Turkey 44 51 46 (90.2%) 5 (9.8%) Prospective 49 (33–77) 27/17 ND Superficial neck coil ND 1.5 T Ultrasonography selection FNAB + histopathologic analysis Within 1 d 2.Nakahira 2011 Japan 38 42 23 19 Retrospective 55.5 (23–79) 13/29 ND Neck array coil Blind 1.5 T Routine neck MRI Histopathologic analysis ND 3.Schueller-Weidekamm 2010 Austria 27 27 11 16 Prospective 55.2 (25–82) ND ND Head and neck coil Unblind 1.0 T Radionuclide scintigraphy FNAB + histopathologic analysis Within 1 d 4.Ren 2010 China 60 60 30 30 Retrospective 49 (26–68) 20/40 Consecutive Head and neck coil ND 1.5 T Routine neck MRI Histopathologic analysis ND 5.Li 2009 China 50 50 36 14 Retrospective 50 (26–68) 9/41 ND Head and neck coil Blind 1.5 T ND Histopathologic analysis ND 6.Bozgeyik 2009 Turkey 76 93 88 5 Prospective 44.1 ± 13.1 ND Consecutive ND Blind 1.5 T Ultrasonography selection FNAB ND 7.Razek 2008 Egypt 63 63 7 56 Prospective 47 (20–72) ND Consecutive Superficial neck coil ND 1.5 T Ultrasonography selection Histopathologic analysis 7 and 13 d.
FNAB, ultrasound-guided fine-needle aspiration biopsy; M/F, male/female; ND, not documented.
Get Radiology Tree app to read full this article<
Study Description
Get Radiology Tree app to read full this article<
Table 2
The ADC Measurement of Included Studies (×10 −3 mm 2 /s) ( X¯¯¯ Χ
¯ ± SD)
First Author_b_ Value (s/mm 2 ) Mean ADC of Benign Mean ADC of Malignant Mean ADC of Normal Threshold Mutlu 0, 50, 400, 1000 1.6 ± 0.1 0.8 ± 0.2 0.98 ± 0.28 1.0 Nakahira ) 0, 1000 1.93 ± 0.37 1.20 ± 0.25 1.41 ± 0.14 1.60 Schueller-Weidekamm 0, 800 3.46 ± 0.40 2.73 ± 0.65 ND 2.25 Ren 100 3.0 ± 0.5 2.0 ± 0.5 ND 2.56 200 2.6 ± 0.4 1.7 ± 0.5 ND 2.17 300 2.2 ± 0.4 1.3 ± 0.4 ND 1.81 400 2.3 ± 0.3 1.0 ± 0.4 ND 1.48 Li 150 2.56 ± 0.56 1.75 ± 0.43 ND 1.992 300 1.99 ± 0.51 1.40 ± 0.31 ND 1.582 500 1.68 ± 0.54 1. 24 ± 0.30 ND 1.410 Bozgeyik 100 3.06 ± 0.71 0.96 ± 0.65 2.98 ± 0.67 1.45 200 1.80 ± 0.60 0.56 ± 0.43 1.73 ± 0.58 0.65 300 1.15 ± 0.43 0.30 ± 0.20 1.17 ± 0.46 0.36 Razek 0, 250, 500 1.8 ± 0.27 0.73 ± 0.19 ND 0.98
ADC, apparent diffusion coefficient; ND, not documented; SD, standard deviation.
Get Radiology Tree app to read full this article<
Assessment of Study Quality and Publication Bias
Get Radiology Tree app to read full this article<
Table 3
Evaluation of Quality of Included Studies Using the QUADAS Tool
Mutlu Nakahira Schueller-Weidekamm Ren Li Bozgeyik Razek Representative spectrum of patients ∗ Yes Yes Yes Yes Yes Yes Yes Selection criteria Yes Yes Yes Yes Yes Yes Yes Reference standard reliable Yes Yes Yes Yes Yes Yes Yes Time interval between MRI and pathology † Yes (within 1 d) Unclear Yes (within 1 d) Unclear Unclear Unclear Yes (7 and 13 d) Whole or random sample received verification Yes Yes Yes Yes Yes Yes Yes Same reference standard No Yes Yes Yes Yes Yes Yes Reference standard independent of the index test Yes Yes Yes Yes Yes Yes Yes Description execution of MRI Yes Yes Yes Yes Yes Yes Yes Description execution of pathology Yes Yes Yes Yes Yes Yes Yes Interpretation of MRI blinded from reference Unclear Yes No Unclear Yes Yes Unclear Interpretation of reference blinded from MRI Unclear Unclear Unclear Unclear Unclear Unclear Unclear Same clinical data available Yes Yes Yes Yes Yes Yes Yes Uninterruptable test results reported Yes Yes Yes Yes Yes Yes Yes Withdrawals explained Yes Yes Yes Yes Yes Yes Yes
MRI, magnetic resonance imaging; QUADAS, a quality assessment tool specifically developed for systematic reviews of diagnostic accuracy studies.
Get Radiology Tree app to read full this article<
Get Radiology Tree app to read full this article<
Get Radiology Tree app to read full this article<
Diagnostic Accuracy of DWI
Get Radiology Tree app to read full this article<
![Figure 2, Forest plot of pooled sensitivity and specificity of diffusion-weighted magnetic resonance imaging differentiating malignant thyroid nodules from benign lesions. Summary sensitivity and specificity were 0.91 (95 % confidence interval [CI], 0.86–0.94) and 0.92 (95% CI, 0.84–0.97), respectively.](https://storage.googleapis.com/dl.dentistrykey.com/clinical/OntheUtilityofQuantitativeDiffusionWeightedMRImagingasaToolinDifferentiationbetweenMalignantandBenignThyroidNodules/1_1s20S1076633213004959.jpg)
Get Radiology Tree app to read full this article<
Evaluation of Clinical Utility
Get Radiology Tree app to read full this article<
Subgroup Analysis
Get Radiology Tree app to read full this article<
Table 4
Subgroup and Meta-regression Analysis
Study Characteristics Summary Sensitivity, % (95% CI)P Summary Specificity, % (95% CI)P χ 2 ( P ) I 2 Total ∗ 0.91 (0.86–0.94) - 0.92 (0.84–0.97) .61 13.91 (.00) 86 No. of patients_n_ > 50 0.91 (0.87–0.95) .17 0.91 (0.84–0.97) .61 0.82 (.66) 0n < 50 0.88 (0.78–0.98) 0.96 (0.88–1.00) Design Prospective 0.93 (0.88–0.98) .09 0.98 (0.95–1.00) .12 9.00 (.01) 78 Retrospective 0.90 (0.85–0.95) 0.85 (0.74–0.96) Patients enrollment Consecutive 0.92 (0.88–0.96) .05 0.95 (0.90–1.00) .73 4.52 (.10) 56 Unconsecutive or unknown 0.87 (0.80–0.94) 0.86 (0.74–0.99) Blind Yes 0.90 (0.83–0.96) .00 0.90 (0.86–0.92) .04 0.69 (.71) 0 Unblind or unknown 0.91 (0.87–0.95) 0.94 (0.88–0.96)
CI, confidence interval.
Get Radiology Tree app to read full this article<
Get Radiology Tree app to read full this article<
Heterogeneity Assessing and Meta-regression Analysis
Get Radiology Tree app to read full this article<
Discussion
Get Radiology Tree app to read full this article<
Get Radiology Tree app to read full this article<
Get Radiology Tree app to read full this article<
Get Radiology Tree app to read full this article<
Get Radiology Tree app to read full this article<
Get Radiology Tree app to read full this article<
Get Radiology Tree app to read full this article<
Get Radiology Tree app to read full this article<
References
1. Ezzat S., Sarti D.A., Cain D.R., et. al.: Thyroid incidentalomas. Prevalence by palpation and ultrasonography. Arch Intern Med 1994; 154: pp. 1838-1840.
2. Falvo L., D’Ercole C., Sorrenti S., et. al.: Papillary microcarcinoma of the thyroid gland: analysis of prognostic factors including histological subtype. Eur J Surg Suppl 2003; pp. 28-32.
3. Noma S., Kanaoka M., Minami S., et. al.: Thyroid masses: MR imaging and pathologic correlation. Radiology 1988; 168: pp. 759-764.
4. Notohamiprodjo M., Staehler M., Steiner N., et. al.: Combined diffusion-weighted, blood oxygen level-dependent, and dynamic contrast-enhanced MRI for characterization and differentiation of renal cell carcinoma. Acad Radiol 2013; 20: pp. 685-693.
5. Sandrasegaran K., Akisik F.M., Lin C., et. al.: The value of diffusion-weighted imaging in characterizing focal liver masses. Acad Radiol 2009; 16: pp. 1208-1214.
6. Rahbar H., Partridge S.C., Eby P.R., et. al.: Characterization of ductal carcinoma in situ on diffusion weighted breast MRI. Eur Radiol 2011; 21: pp. 2011-2019.
7. Razek A.A., Sadek A.G., Kombar O.R., et. al.: Role of apparent diffusion coefficient values in differentiation between malignant and benign solitary thyroid nodules. AJNR Am J Neuroradiol 2008; 29: pp. 563-568.
8. Schueller-Weidekamm C., Kaserer K., Schueller G., et. al.: Can quantitative diffusion-weighted MR imaging differentiate benign and malignant cold thyroid nodules? Initial results in 25 patients. AJNR Am J Neuroradiol 2009; 30: pp. 417-422.
9. Wang J., Takashima S., Takayama F., et. al.: Head and neck lesions: characterization with diffusion-weighted echo-planar MR imaging. Radiology 2001; 220: pp. 621-630.
10. Le Bihan D., Breton E., Lallemand D., et. al.: Separation of diffusion and perfusion in intravoxel incoherent motion MR imaging. Radiology 1988; 168: pp. 497-505.
11. Whiting P., Rutjes A.W., Reitsma J.B., et. al.: The development of QUADAS: a tool for the quality assessment of studies of diagnostic accuracy included in systematic reviews. BMC Med Res Methodol 2003; 3: pp. 25.
12. van Houwelingen H.C., Arends L.R., Stijnen T.: Advanced methods in meta-analysis: multivariate approach and meta-regression. Stat Med 2002; 21: pp. 589-624.
13. Reitsma J.B., Glas A.S., Rutjes A.W., et. al.: Bivariate analysis of sensitivity and specificity produces informative summary measures in diagnostic reviews. J Clin Epidemiol 2005; 58: pp. 982-990.
14. Chu H., Cole S.R.: Bivariate meta-analysis of sensitivity and specificity with sparse data: a generalized linear mixed model approach. J Clin Epidemiol 2006; 59: pp. 1331-1332. author reply 1332–1333
15. Rutter C.M., Gatsonis C.A.: A hierarchical regression approach to meta-analysis of diagnostic test accuracy evaluations. Stat Med 2001; 20: pp. 2865-2884.
16. Harbord R.M., Deeks J.J., Egger M., et. al.: A unification of models for meta-analysis of diagnostic accuracy studies. Biostatistics 2007; 8: pp. 239-251.
17. Swets J.A.: Measuring the accuracy of diagnostic systems. Science 1988; 240: pp. 1285-1293.
18. Glas A.S., Lijmer J.G., Prins M.H., et. al.: The diagnostic odds ratio: a single indicator of test performance. J Clin Epidemiol 2003; 56: pp. 1129-1135.
19. Nagamachi S., Wakamatsu H., Kiyohara S., et. al.: Comparison of diagnostic and prognostic capabilities of 18 F-FDG-PET/CT, 131 I-scintigraphy, and diffusion-weighted magnetic resonance imaging for postoperative thyroid cancer. Jpn J Radiol 2011; 29: pp. 413-422.
20. Tezuka M., Murata Y., Ishida R., et. al.: MR imaging of the thyroid: correlation between apparent diffusion coefficient and thyroid gland scintigraphy. J Magn Reson Imaging 2003; 17: pp. 163-169.
21. Abdel Razek A.A., Sadek A.G., Gaballa G.: Diffusion-weighed MR of the thyroid gland in Graves’ disease: assessment of disease activity and prediction of outcome. Acad Radiol 2010; 17: pp. 779-783.
22. Srinivasan A., Dvorak R., Rohrer S., et. al.: Initial experience of 3-tesla apparent diffusion coefficient values in characterizing squamous cell carcinomas of the head and neck. Acta Radiol 2008; 49: pp. 1079-1084.
23. Erdem G., Erdem T., Muammer H., et. al.: Diffusion-weighted images differentiate benign from malignant thyroid nodules. J Magn Reson Imaging 2010; 31: pp. 94-100.
24. Mutlu H., Sivrioglu A.K., Sonmez G., et. al.: Role of apparent diffusion coefficient values and diffusion-weighted magnetic resonance imaging in differentiation between benign and malignant thyroid nodules. Clin Imaging 2012; 36: pp. 1-7.
25. Nakahira M., Saito N., Murata S.I., et. al.: Quantitative diffusion-weighted magnetic resonance imaging as a powerful adjunct to fine needle aspiration cytology for assessment of thyroid nodules. Am J Otolaryngol 2011;
26. Schueller-Weidekamm C., Schueller G., Kaserer K., et. al.: Diagnostic value of sonography, ultrasound-guided fine-needle aspiration cytology, and diffusion-weighted MRI in the characterization of cold thyroid nodules. Eur J Radiol 2010; 73: pp. 538-544.
27. Ren S., Liu C.H., Bai R.J.: Value of diffusion weighted imaging in diagnosis of nodular lesions of thyroid: a preliminary study. Zhonghua Yi Xue Za Zhi 2010; 90: pp. 3351-3354.
28. Li R.K., Qian J.W., Liu W., et. al.: Application of MR diffusion weighted imaging in the differentiation of malignant from benign thyroid focal lesions. Radiol Practice 2009; 24: pp. 719-722.
29. Bozgeyik Z., Coskun S., Dagli A.F., et. al.: Diffusion-weighted MR imaging of thyroid nodules. Neuroradiology 2009; 51: pp. 193-198.
30. Petitti D.B.: Approaches to heterogeneity in meta-analysis. Stat Med 2001; 20: pp. 3625-3633.
31. Koh D.M., Collins D.J.: Diffusion-weighted MRI in the body: application and challenges in oncology. Am J Roentgenol 2007; 188: pp. 1622-1635.