
Rationale and Objectives
Low-dose chest computed tomography (LDCT), increasingly being used for screening of lung cancer, may also be used to measure breast density, which is proven as a risk factor for breast cancer. In this study, we developed a segmentation method to measure quantitative breast density on CT images and correlated with magnetic resonance density.
Materials and Methods
Forty healthy women receiving both LDCT and breast magnetic resonance imaging (MRI) were studied. A semiautomatic method was applied to quantify the breast density on LDCT images. The intra- and interoperator reproducibility was evaluated. The volumetric density on MRI was obtained by using a well-established automatic template-based segmentation method. The breast volume (BV), fibroglandular tissue volume (FV), and percent breast density (PD) measured on LDCT and MRI were compared.
Results
The measurements of BV, FV, and PD on LDCT images yield highly consistent results, with the intraclass correlation coefficient of 0.999 for BV, 0.977 for FV, and 0.966 for PD for intraoperator reproducibility, and intraclass correlation coefficient of 0.953 for BV, 0.974 for FV, and 0.973 for PD for interoperator reproducibility. The BV, FV, and PD measured on LDCT and MRI were well correlated (all r ≥ 0.90). Bland-Altman plots showed that a larger BV and FV were measured on LDCT than on MRI.
Conclusions
The preliminary results showed that quantitative breast density can be measured from LDCT, and that our segmentation method could yield a high reproducibility on the measured volume and PD. The results measured on LDCT and MRI were highly correlated. Our results showed that LDCT may provide valuable information about breast density for evaluating breast cancer risk.
Introduction
Mammographic density has been proven as an independent risk factor for breast cancer . Women with dense breast tissue visible on a mammogram have a cancer risk of 1.8–6.0 times that of women with little density . A great research effort has been devoted to incorporate breast density into risk prediction models to better estimate each individual’s cancer risk. Because the two-dimensional mammography-based measurement is subject to tissue overlapping, thus not able to provide true volumetric information, other emerging technologies based on three-dimensional (3D) imaging for assessing breast density are being developed. Among these new modalities, magnetic resonance imaging (MRI) is most well studied . Although breast MRI is suitable for volumetric analysis and segmentation tools are available, not many women can receive breast MRI because of its high cost. Currently, only high-risk women with lifetime breast cancer risks more than 20% will receive breast MRI for screening .
Low-dose chest computed tomography (LDCT) is increasingly being used for the screening of lung cancer and diagnosis of other pulmonary diseases . According to a report from The National Lung Screening Trial, there was a 20% reduction in deaths from lung cancer among current or former heavy smokers who were screened with LDCT compared to those screened by chest X-ray . The overall average effective dose was approximately 2 mSv for LDCT, which was much lower than an average effective dose of 7 mSv for a typical standard-dose chest CT examination . Despite general radiation concern, LDCT is considered a safe screening tool, and its clinical use is anticipated to increase. Among the examinees, more than 40% are women . As its popularity in clinical practice increases, besides lung cancer screening, LDCT has potential to provide additionalinformation about breast density for personalized management of breast cancer screening.
Get Radiology Tree app to read full this article<
Get Radiology Tree app to read full this article<
Materials and Methods
Subjects
Get Radiology Tree app to read full this article<
Imaging Studies
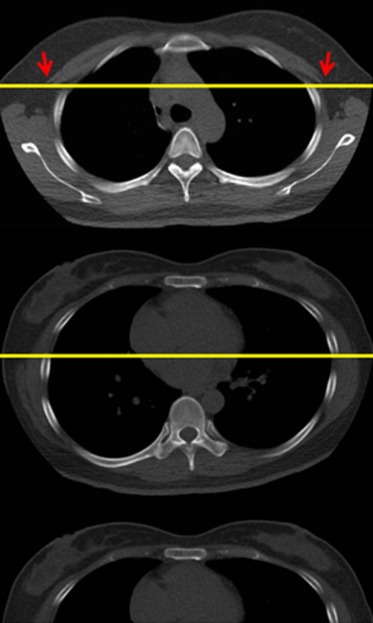
Low-dose Chest Computed Tomography
Get Radiology Tree app to read full this article<
Breast MR Imaging
Get Radiology Tree app to read full this article<
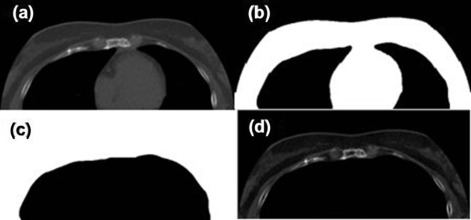
Breast Segmentation and Quantification of Breast Density
Get Radiology Tree app to read full this article<
Breast Density Analyzed From LDCT
Get Radiology Tree app to read full this article<
Get Radiology Tree app to read full this article<
Get Radiology Tree app to read full this article<
Get Radiology Tree app to read full this article<
Get Radiology Tree app to read full this article<
Get Radiology Tree app to read full this article<
Get Radiology Tree app to read full this article<
Breast Density Acquired From MRI
Get Radiology Tree app to read full this article<
Get Radiology Tree app to read full this article<
Statistics
Get Radiology Tree app to read full this article<
Results
Assessment of Measurement Reproducibility Using LDCT
Get Radiology Tree app to read full this article<
Correlation of Breast Density Measured on LDCT and MRI
Get Radiology Tree app to read full this article<
Table 1
Breast Density Values Measured From MR and LDCT
Breast Volume (cm 3 ) Fibroglandular Tissue Volume (cm 3 ) Percent Breast Density (%) Maxima Minimum Mean ± SD Maxima Minimum Mean ± SD Maxima Minimum Mean ± SD MR ( N = 40) 1786.7 223.8 616.9 ± 334.8 316.7 9.7 59.7 ± 57.7 34.6 1.6 11.3 ± 9.3 LDCT ( N = 40) 1620.5 296.4 672.8 ± 239.9 394.4 13.0 69.0 ± 62.3 25.2 2.2 10.4 ± 6.1
LDCT, low-dose chest computed tomography; MR, magnetic resonance; SD, standard deviation.
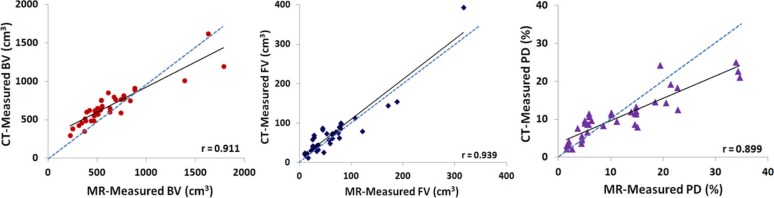
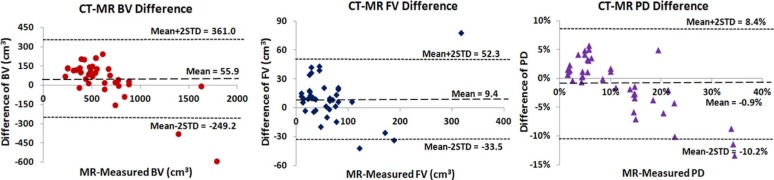
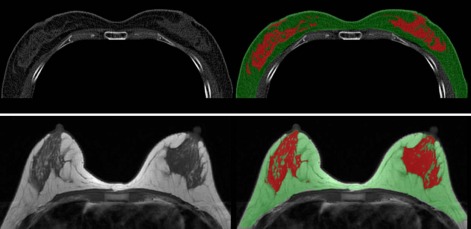
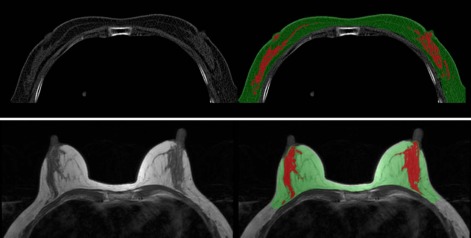
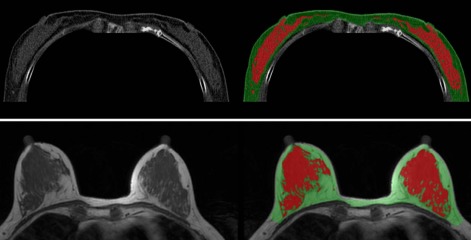
Table 2
Results of Breast Density Measurements in Three Women
BV (Lt/Rt) (cm 3 ) FV (Lt/Rt) (cm 3 ) PD (Lt/Rt) (%) Case 1 ( Fig 5 ) LDCT 646.3/654.5 70.4/76.3 10.9/11.7 MRI 611.4/647.0 61.1/65.9 10.0/10.2 Case 2 ( Fig 6 ) LDCT 479.9/442.9 38.9/38.6 8.1/8.7 MRI 350.7/331.4 30.4/27.9 8.7/8.4 Case 3 ( Fig 7 ) LDCT 517.2/510.5 101.4/97.9 19.6/19.2 MRI 377.3/373.0 88.3/72.6 23.4/19.5
BV, breast volume; FV, fibroglandular tissue volume; LDCT, low-dose chest computed tomography; Lt, left breast; MRI, magnetic resonance imaging; PD, percent breast density; Rt, right breast.
Get Radiology Tree app to read full this article<
Discussion
Get Radiology Tree app to read full this article<
Get Radiology Tree app to read full this article<
Get Radiology Tree app to read full this article<
Get Radiology Tree app to read full this article<
Get Radiology Tree app to read full this article<
Get Radiology Tree app to read full this article<
Get Radiology Tree app to read full this article<
Get Radiology Tree app to read full this article<
Acknowledgment
Get Radiology Tree app to read full this article<
References
1. Boyd N.F., Guo H., Martin L.J., et. al.: Mammographic density and the risk and detection of breast cancer. N Engl J Med 2007; 356: pp. 227-236.
2. Vachon C.M., Brandt K.R., Ghosh K., et. al.: Mammographic breast density as a general marker of breast cancer risk. Cancer Epidemiol Biomarkers Prev 2007; 16: pp. 43-49.
3. Boyd N.F., Dite G.S., Stone J., et. al.: Heritability of mammographic density, a risk factor for breast cancer. N Engl J Med 2002; 347: pp. 886-894.
4. Khazen M., Warren R., Boggis C., et. al.: A pilot study of compositional analysis of the breast and estimation of breast mammographic density using three-dimensional T1-weighted magnetic resonance imaging. Cancer Epidemiol Biomarkers Prev 2008; 17: pp. 2268-2274.
5. Nie K., Chen J.H., Chan S., et. al.: Development of a quantitative method for analysis of breast density based on 3-dimensional breast MRI. Med Phys 2008; 35: pp. 5253-5262.
6. Klifa C., Carballido-Gamio J., Wilmes L., et. al.: Magnetic resonance imaging for secondary assessment of breast density in a high-risk cohort. Magn Reson Imaging 2010; 28: pp. 8-15.
7. Saslow D., Boetes C., Burke W., et. al.: American Cancer Society guidelines for breast screening with MRI as an adjunct to mammography. CA Cancer J Clin 2007; 57: pp. 75-89.
8. Menezes R.J., Roberts H.C., Paul N.S., et. al.: Lung cancer screening using low-dose computed tomography in at-risk individuals: the Toronto experience. Lung Cancer 2010; 67: pp. 177-183.
9. National Lung Screening Trial Research Team, Aberle D.R., Adams A.M., et. al.: Reduced lung-cancer mortality with low-dose computed tomographic screening. N Engl J Med 2011; 365: pp. 395-409.
10. Horeweg N., van Rosmalen J., Heuvelmans M.A., et. al.: Lung cancer probability in patients with CT-detected pulmonary nodules: a prespecified analysis of data from the NELSON trial of low-dose CT screening. Lancet Oncol 2014; 15: pp. 1332-1341.
11. Chiumello D., Langer T., Vecchi V., et. al.: Low-dose chest computed tomography for quantitative and visual anatomical analysis in patients with acute respiratory distress syndrome. Intensive Care Med 2014; 40: pp. 691-699.
12. Carrillo M.C., Alturkistany S., Roberts H., et. al.: Low-dose computed tomography (LDCT) in workers previously exposed to asbestos: detection of parenchymal lung disease. J Comput Assist Tomogr 2013; 37: pp. 626-630.
13. Larke F.J., Kruger R.L., Cagnon C.H., et. al.: Estimated radiation dose associated with low-dose chest CT of average-size participants in the National Lung Screening Trial. AJR Am J Roentgenol 2011; 197: pp. 1165-1169.
14. Padgett J., Biancardi A.M., Henschke C.I., et. al.: Local noise estimation in low-dose chest CT images. Int J CARS 2014; 9: pp. 221-229.
15. Chen Y., Yang Z., Hu Y., et. al.: Thoracic low-dose CT image processing using an artifact suppressed large-scale nonlocal means. Phys Med Biol 2012; 57: pp. 2667-2688.
16. Moon W.K., Lo C.M., Goo J.M., et. al.: Quantitative analysis for breast density estimation in low dose chest CT scans. J Med Syst 2014; 38: pp. 21.
17. Lin M., Chen J.H., Wang X., et. al.: Template-based automatic breast segmentation on MRI by excluding the chest region. Med Phys 2013; 40: pp. 122301.
18. Lin M., Chan S., Chen J.H., et. al.: A new bias field correction method combining N3 and FCM for improved segmentation of breast density on MRI. Med Phys 2011; 38: pp. 5-14.
19. H.R. 1302 : Breast density and mammography reporting act of 2011. U.S. Congress; Available at: https://www.govtrack.us/congress/bills/112/hr3102 Accessed November 15, 2011; Published October
20. Ng K.H., Yip C.H., Taib N.A.: Standardization of clinical breast-density measurement. Lancet Oncol 2012; 13: pp. 334-336.
21. Laidevant A.D., Malkov S., Flowers C.I., et. al.: Compositional breast imaging using a dual-energy mammography protocol. Med Phys 2010; 37: pp. 164-174.
22. Maskarinec G., Morimoto Y., Daida Y., et. al.: Comparison of breast density measured by dual energy X-ray absorptiometry with mammographic density among adult women in Hawaii. Cancer Epidemiol Biomarkers Prev 2011; 35: pp. 188-193.
23. Blackmore K.M., Dick S., Knight J., et. al.: Estimation of mammographic density on an interval scale by transillumination breast spectroscopy. J Biomed Opt 2008; 13: pp. 064030.
24. Blackmore K.M., Knight J.A., Lilge L.: Association between transillumination breast spectroscopy and quantitative mammographic features of the breast. Cancer Epidemiol Biomarkers Prev 2008; 17: pp. 1043-1050.
25. Glide-Hurst C.K., Duric N., Littrup P.: Volumetric breast density evaluation from ultrasound tomography images. Med Phys 2008; 35: pp. 3988-3997.
26. Chen J.H., Huang C.S., Chien K.C., et. al.: Breast density analysis for whole breast ultrasound images. Med Phys 2009; 36: pp. 4933-4943.
27. Salvatore M., Margolies L., Kale M., et. al.: Breast density: comparison of chest CT with mammography. Radiology 2014; 270: pp. 67-73.
28. Moon W.K., Lo C.M., Goo J.M., et. al.: Quantitative analysis for breast density estimation in low dose chest CT scans. J Med Syst 2014; 38: pp. 21.
29. Wang X.Y., Chen J.H., Liao Y.H., et al. Comparative measurement of breast volume and dense tissue volume based on breast MRI and low dose chest CT. Presented at the 21th ISMRM Meeting (2013), Salt Lake City, May 20–26, Program Number: 3366.
30. Han T., Lai C.J., Chen L., et. al.: Breast density measurement: 3D cone beam computed tomography (CBCT) images versus 2D digital mammograms. Proc SPIE 2009; 7258: pp. 72580L-1.
31. Huang S.Y., Boone J.M., Yang K., et. al.: The characterization of breast anatomical metrics using dedicated breast CT. Med Phys 2011; 38: pp. 2180-2191.
32. Vedantham S., Shi L., Karellas A., et. al.: Dedicated breast CT: fibroglandular volume measurements in a diagnostic population. Med Phys 2012; 39: pp. 7317-7328.
33. Shih C.T., Chang S.J., Liu Y.L., et. al.: Noise reduction of low-dose computed tomography using the multiresolution total variation minimization algorithm. Proc SPIE 2013; 8668: pp. 86682H-1.
34. Yu L., Manduca A., Jacobsen M., et. al.: Adaptive modulation of bilateral filtering based on a practical noise model for streaking and noise reduction in multi-slice CT. Proc SPIE 2010; 7622: pp. 762220.
35. Lindenbaum M., Fischer M., Bruckstein A.M.: On Gabor’s contribution to image-enhancement. Pattern Recognit 1994; 27: pp. 1-8.