
Rationale and Objectives
The aim of this article was to study the influence of different adaptive statistical iterative reconstruction (ASIR) percentages on the image quality of dual-energy computed tomography (DECT) portal venography in portal hypertension patients.
Materials and Methods
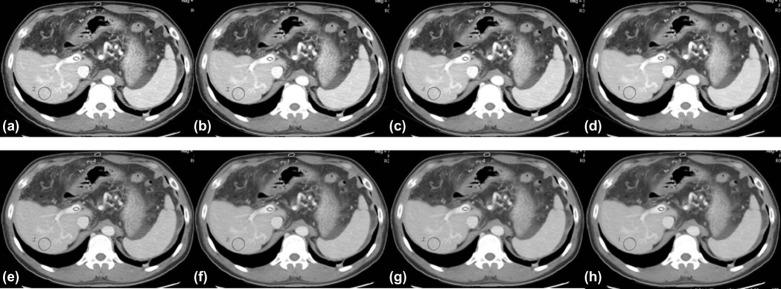
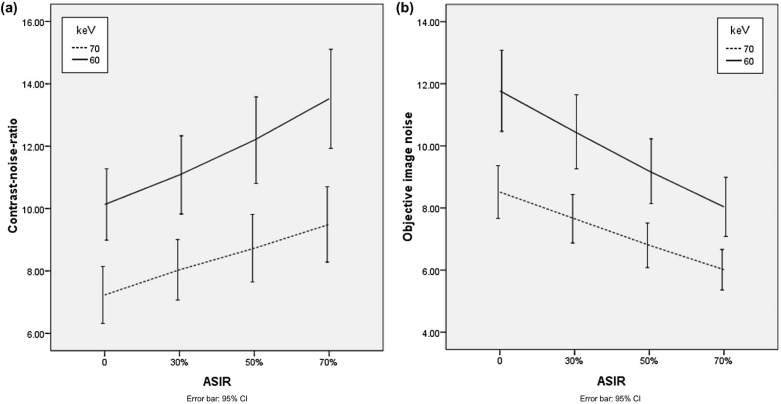
DECT scans of 40 patients with cirrhosis (mean age, 56 years) at the portal venous phase were retrospectively analyzed. Monochromatic images at 60 and 70 keV were reconstructed with four ASIR percentages: 0%, 30%, 50%, and 70%. Computed tomography (CT) numbers of the portal veins (PVs), liver parenchyma, and subcutaneous fat tissue in the abdomen were measured. The standard deviation from the region of interest of the liver parenchyma was interpreted as the objective image noise (IN). The contrast-noise ratio (CNR) between PV and liver parenchyma was calculated. The diagnostic acceptability (DA) and sharpness of PV margins were obtained using a 5-point score. The IN, CNR, DA, and sharpness of PV were compared among the eight groups with different keV + ASIR level combinations.
Results
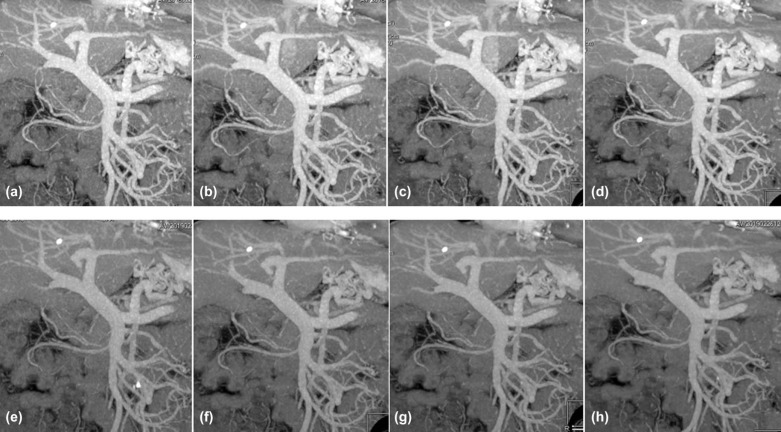
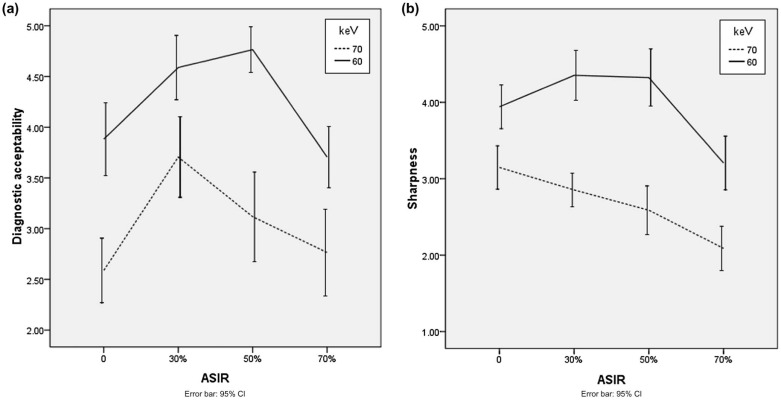
The IN, CNR, DA, and sharpness of PV of different keV + ASIR groups were all statistically different ( P < 0.05). In the eight groups, the best and worst CNR were obtained in the 60 keV + 70% ASIR and 70 keV + 0% ASIR (filtered back-projection [FBP]) combination, respectively, whereas the largest and smallest objective IN were obtained in the 60 keV + 0% ASIR (FBP) and 70 keV + 70% combination. The highest DA and sharpness values of PV were obtained at 50% ASIR for 60 keV.
Conclusions
An optimal ASIR percentage (50%) combined with an appropriate monochromatic energy level (60 keV) provides the highest DA in portal venography imaging, whereas for the higher monochromatic energy (70 keV) images, 30% ASIR provides the highest image quality, with less IN than 60 keV with 50% ASIR.
Introduction
Computed tomography portal venography (CTPV) is used for the evaluation of portal-systemic collateral circulations of patients with liver cirrhosis . It provides therapeutic relevant information, such as portal vein lesions, the status of the portal-systemic collateral circulation, including the diameter, location, and extent of esophageal and gastric varicosis, spleno-renal and para-umbilical veins, as well as the underlying hepatic disease . In addition, CTPV is frequently used for the presurgical vascular evaluation of patients with upcoming liver transplantation .
However, the image quality of CTPV is commonly influenced by several factors. First, beam-hardening artifacts are frequently an obstacle to the image quality of CT angiography . Second, patients who undergo CTPV often suffer from severe hepatic disease accompanied with portal vein thrombosis, which might influence the image quality of CTPV . Furthermore, because renal dysfunction is commonly present in patients with severe hepatic disease, a reduction of contrast agent dosage is frequently required, which may result in decreased imaging conditions . In addition, the portal venous imaging quality may be affected by the cardiac function and the body mass index (BMI) of the patient, making the timing of the optimal contrast enhancement difficult .
Get Radiology Tree app to read full this article<
Get Radiology Tree app to read full this article<
Get Radiology Tree app to read full this article<
Get Radiology Tree app to read full this article<
Get Radiology Tree app to read full this article<
Get Radiology Tree app to read full this article<
Material and Methods
Patient Population
Get Radiology Tree app to read full this article<
Get Radiology Tree app to read full this article<
Imaging Technique
Get Radiology Tree app to read full this article<
Get Radiology Tree app to read full this article<
Data Post-processing
Get Radiology Tree app to read full this article<
Objective Image Quality Assessment (Quantitative Assessment)
Get Radiology Tree app to read full this article<
Get Radiology Tree app to read full this article<
Get Radiology Tree app to read full this article<
Subjective Image Quality Assessment (Qualitative Assessment)
Get Radiology Tree app to read full this article<
Table 1
Grading Scale for Qualitative Image Analysis of Sharpness, Image Noise, and Diagnostic Acceptability of the Portal Vein
Grading Scale Sharpness Diagnostic Acceptability 1 Blurry Unacceptable 2 Poor Suboptimal 3 Average Average 4 Better Above average 5 Sharpest Excellent
Get Radiology Tree app to read full this article<
Get Radiology Tree app to read full this article<
Statistical Analysis
Get Radiology Tree app to read full this article<
Get Radiology Tree app to read full this article<
Get Radiology Tree app to read full this article<
Results
Get Radiology Tree app to read full this article<
Objective Scores (Quantitative Assessment)
Get Radiology Tree app to read full this article<
Table 2
Comparison of objective and subjective assessment of image quality of CT portal venography in different groups
Item_F_ Value_P_ Value CNR 36.000 <0.001 IN 91.274 <0.001 DA 50.552 <0.001 Sharpness 8.510 <0.001
CNR, contrast-to-noise ratio of portal vein to liver parenchyma; CT, computed tomography; DA, diagnostic acceptability; IN, image noise.
Get Radiology Tree app to read full this article<
Subjective Scores (Qualitative Assessment)
Get Radiology Tree app to read full this article<
Get Radiology Tree app to read full this article<
Get Radiology Tree app to read full this article<
Get Radiology Tree app to read full this article<
The Interobserver Agreement Results of Subjective Assessment
Get Radiology Tree app to read full this article<
Get Radiology Tree app to read full this article<
Discussion
Get Radiology Tree app to read full this article<
Get Radiology Tree app to read full this article<
Get Radiology Tree app to read full this article<
Get Radiology Tree app to read full this article<
Get Radiology Tree app to read full this article<
Get Radiology Tree app to read full this article<
Get Radiology Tree app to read full this article<
Conclusion
Get Radiology Tree app to read full this article<
Acknowledgements
Get Radiology Tree app to read full this article<
References
1. Kiyosue H., Ibukuro K., Maruno M., et. al.: Multidetector CT anatomy of drainage routes of gastric varices: a pictorial review. Radiographics 2013; 33: pp. 87-100.
2. Chen T.W., Yang Z.G., Li X., et. al.: Evaluation of entire gastric fundic and esophageal varices secondary to posthepatitic cirrhosis: portal venography using 64-row MDCT. Abdom Imaging 2010; 35: pp. 1-7.
3. Agarwal A., Jain M.: Multidetector CT portal venography in evaluation of portosystemic collateral vessels. J Med Imaging Radiat Oncol 2008; 52: pp. 4-9.
4. Apisarnthanarak P., Raman S.S., Ghobrial R.M., et. al.: Efficacy of CT angiography for preoperative vascular mapping in adult to adult living related liver transplant donors. J Med Assoc Thai 2011; 94: pp. 98-105.
5. Scheske J.A., O’Brien J.M., Earls J.P., et. al.: Coronary artery imaging with single-source rapid kilovolt peak-switching dual-energy CT. Radiology 2013; 268: pp. 702-709.
6. Takaji R., Kiyosue H., Matsumoto S., et. al.: Partial thrombosis of gastric varices after balloon-occluded retrograde transvenous obliteration: CT findings and endoscopic correlation. AJR Am J Roentgenol 2011; 196: pp. 686-691.
7. Davenport M.S., Khalatbari S., Cohan R.H., et. al.: Contrast medium-induced nephrotoxicity risk assessment in adult inpatients: a comparison of serum creatinine level- and estimated glomerular filtration rate-based screening methods. Radiology 2013; 269: pp. 92-100.
8. Moos S.I., van Vemde D.N., Stoker J., et. al.: Contrast induced nephropathy in patients undergoing intravenous (IV) contrast enhanced computed tomography (CECT) and the relationship with risk factors: a meta-analysis. Eur J Radiol 2013; 82: pp. e387-e399.
9. Matsuki M., Murakami T., Juri H., et. al.: Impact of adaptive iterative dose reduction (AIDR) 3D on low-dose abdominal CT: comparison with routine-dose CT using filtered back projection. Acta Radiol 2013; 54: pp. 869-875.
10. Rengo M., Bellini D., De Cecco C.N., et. al.: The optimal contrast media policy in CT of the liver. Part II: clinical protocols. Acta Radiol 2011; 52: pp. 473-480.
11. Wang Q., Shi G., Liu X., et. al.: Optimal contrast of computed tomography portal venography using dual-energy computed tomography. J Comput Assist Tomogr 2013; 37: pp. 142-148.
12. Heye T., Nelson R.C., Ho L.M., et. al.: Dual-energy CT applications in the abdomen. AJR Am J Roentgenol 2012; 199: pp. S64-S70.
13. Matsumoto K., Jinzaki M., Tanami Y., et. al.: Virtual monochromatic spectral imaging with fast kilovoltage switching: improved image quality as compared with that obtained with conventional 120-kVp CT. Radiology 2011; 259: pp. 257-262.
14. Pinho D.F., Kulkarni N.M., Krishnaraj A., et. al.: Initial experience with single-source dual-energy CT abdominal angiography and comparison with single-energy CT angiography: image quality, enhancement, diagnosis and radiation dose. Eur Radiol 2013; 23: pp. 351-359.
15. Yeh B.M., Shepherd J.A., Wang Z.J., et. al.: Dual-energy and low-kVp CT in the abdomen. AJR Am J Roentgenol 2009; 193: pp. 47-54.
16. Sagara Y., Hara A.K., Pavlicek W., et. al.: Abdominal CT: comparison of low-dose CT with adaptive statistical iterative reconstruction and routine-dose CT with filtered back projection in 53 patients. AJR Am J Roentgenol 2010; 195: pp. 713-719.
17. Prakash P., Kalra M.K., Kambadakone A.K., et. al.: Reducing abdominal CT radiation dose with adaptive statistical iterative reconstruction technique. Invest Radiol 2010; 45: pp. 202-210.
18. Cornfeld D., Israel G., Detroy E., et. al.: Impact of adaptive statistical iterative reconstruction (ASIR) on radiation dose and image quality in aortic dissection studies: a qualitative and quantitative analysis. AJR Am J Roentgenol 2011; 196: pp. W336-W340.
19. Singh S., Kalra M.K., Shenoy-Bhangle A.S., et. al.: Radiation dose reduction with hybrid iterative reconstruction for pediatric CT. Radiology 2012; 263: pp. 537-546.
20. Yamada Y., Jinzaki M., Tanami Y., et. al.: Virtual monochromatic spectral imaging for the evaluation of hypovascular hepatic metastases: the optimal monochromatic level with fast kilovoltage switching dual-energy computed tomography. Invest Radiol 2012; 47: pp. 292-298.
21. Daly L., Bourke G.J.: Interpretation and uses of medical statistics.5th ed.2007.Blackwell Science LtdLondonpp. p410.
22. Meyers C.R., Blesh T.E.: Measurement in physical education.1962.Ronald Press Co.New York
23. Zhao L.Q., He W., Li J.Y., et. al.: Improving image quality in portal venography with spectral CT imaging. Eur J Radiol 2012; 81: pp. 1677-1681.
24. Kulkarni N.M., Sahani D.V., Desai G.S., et. al.: Indirect computed tomography venography of the lower extremities using single-source dual-energy computed tomography: advantage of low-kiloelectron volt monochromatic images. J Vasc Interv Radiol 2012; 23: pp. 879-886.
25. Fuchs T.A., Stehli J., Fiechter M., et. al.: First experience with monochromatic coronary computed tomography angiography from a 64-slice CT scanner with gemstone spectral imaging (GSI). J Cardiovasc Comput Tomogr 2013; 7: pp. 25-31.