
Rationale and Objectives
The use of breast computed tomography (CT) has been limited by radiation hazard and image quality. The objective of this study was to compare radiation doses and image quality for different 64-channel multidetector row CT (MDCT) parameters, and to potentially provide optimal CT parameters for breast imaging.
Materials and Methods
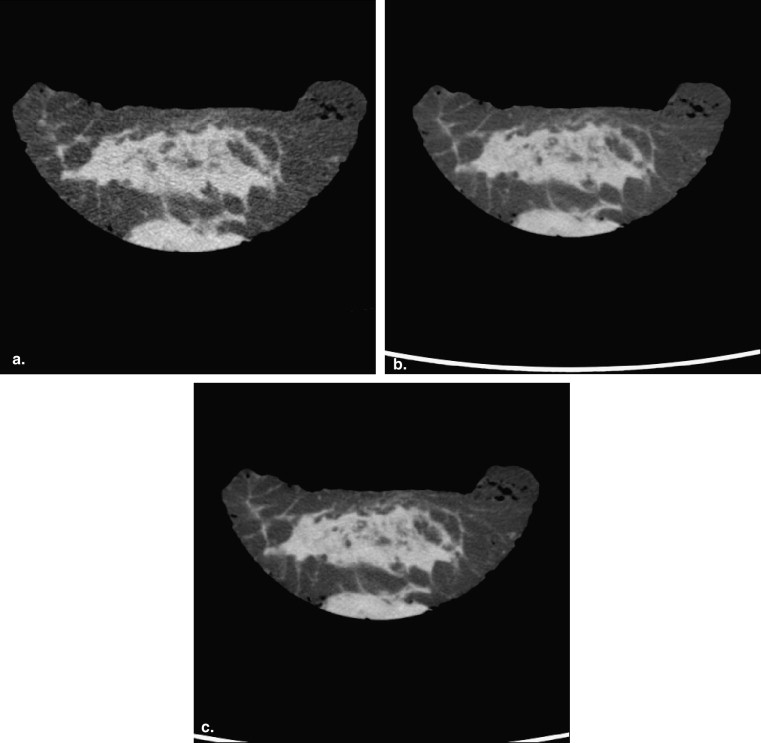
For assessment of radiation doses, CT dose index (CTDI 100 ) values were obtained at various x-ray tube voltages (80, 120, 140 kVp) and currents (30, 50, 100, 150, 200 mAs) using a standard CT body dose phantom. To evaluate image quality, four fresh mastectomy specimens were scanned and three radiologists graded images for overall image quality, glandular tissue-fat conspicuity, and Cooper’s ligament sharpness. Statistically, linear regression analyses and multiple comparisons were used for investigation of the relationship between radiation dose, image qualities, and CT parameters.
Results
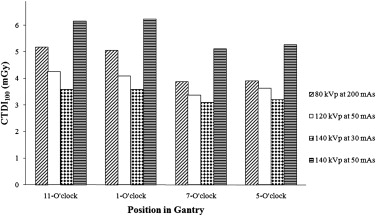
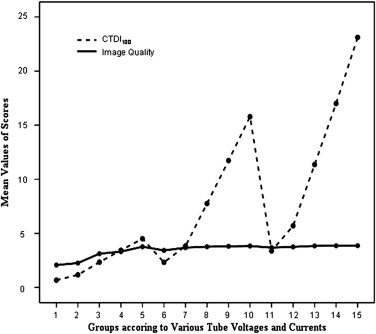
CTDI 100 values of ≤6 mGy were obtained at 80 kVp and any mAs, 120 kVp and 30 or 50 mAs, and 140 kVp and 30 or 50 mAs. Image quality at 80 kVp and 200 mAs, 120 kV and 50, 100, 150, or 200 mAs, and 140 kVp and all mAs values tested were significantly superior to those at 80 kVp and 30, 50, 100, or 150 mAs and 120 kV and 30 mAs ( P < .05).
Conclusions
Based on our results, 80 kVp and 200 mAs, 120 kVp and 50 mAs, 140 kVp and 30 mAs, or 140 kVp and 50 mAs can be used for breast MDCT scanning to reduce radiation dose and preserve image quality and 140 kVp at 30 mAs is the optimal setting.
Computed tomography (CT) has been reported to be useful for distinguishing benign breast lesions from cancers , for initial breast cancer staging , and for detecting tumor recurrence after treatment , and recently, multidetector row CT (MDCT) scanners have been purchased by many institutions. MDCT can obtain multiple CT datasets with each x-ray tube rotation, and thus scan times are faster than for conventional spiral CT scanners. Furthermore, MDCT has greater temporal and spatial image resolutions. However, the use of MDCT as a diagnostic tool in the breast is limited by lack of optimum acquisition parameters that yield superior diagnostic image quality at dose levels comparable to two-view mammography.
Breast is one of the radiosensitive organs. The International Commission of Radiological Protection recommended the concept of dose constraints, with the main implication in diagnostic radiology . The potential radiation risks in patients undergoing CT are due to stochastic effects. The probability of stochastic effects depends on the amount of absorbed radiation. The radiation doses used in CT often approach or exceed those levels known to increase the probability of nonfatal and fatal cancers . Risk of breast cancer may correlate with doses less than 100 mGy . The radiation dose values for the female breast in chest CT examinations range from 20 to 31 mGy . The majority of studies of breast CT have been performed using standard doses such as those used for conventional chest CT scans at 120–140 kVp and 200–300 mAs . There are a few studies of breast CT using lower radiation doses, 2.6–4.5 mAs, at 100 kVp and 100 mAs or 120 kVP at 50 mAs .
Get Radiology Tree app to read full this article<
Get Radiology Tree app to read full this article<
Materials and methods
Get Radiology Tree app to read full this article<
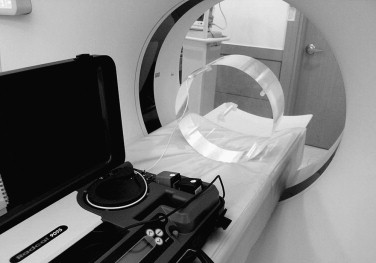
Phantom Study
Get Radiology Tree app to read full this article<
Get Radiology Tree app to read full this article<
Get Radiology Tree app to read full this article<
CTDI100=1RPW∫+50−50D(z)dz, C
T
D
I
100
=
1
R
P
W
∫
−
50
+
50
D
(
z
)
d
z
,
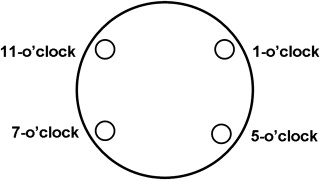
where and D( z ) is the absorbed dose at a point z on a line parallel to the rotation axis, and the limits of integration are ±50 mm . The radiation profile width (RPW) is the nominal x-ray beam width (millimeters). In the present study, dependencies between CTDI 100 and tube voltage (kilovoltage peak) and tube current (tube current-time product) were investigated. The dependency of CTDI 100 on tube voltage was assessed by performing measurements at various tube voltage values, namely, 80, 120, and 140 kVp. Milliampere-second values (milliampere second = milliampere × rotation time) were changed by altering tube currents. CTDI 100 values were measured at 30, 50, 100, 150, and 200 mAs. Other scan parameters were kept constant, namely: 512 × 512-image matrix, 16 × 0.625-mm collimation, 3-mm slice thickness, and 34-cm field of view for a single pass. CTDI 100 values were measured three times at each peripheral hole and mean values and standard deviations were calculated.
Get Radiology Tree app to read full this article<
Specimen Study
Get Radiology Tree app to read full this article<
Get Radiology Tree app to read full this article<
Get Radiology Tree app to read full this article<
Table 1
Criteria Used to Grade Image Quality
Grade Overall Image Quality Glandular Tissue-fat Conspicuity Cooper’s Ligament Sharpness 1 Poor Indistinguishable between glandular tissue and fat Indistinguishable ligaments 2 Moderate Distinguishable between glandular tissue and fat Distinguishable but not continuous and not sharp ligaments 3 Satisfactory Clear conspicuity between glandular tissue and fat within abundant fatty portion and unclear conspicuity within abundant glandular portion Continuous but not sharp ligaments 4 Excellent Clear conspicuity between glandular tissue and fat within both abundant glandular and fatty portions Continuous and sharp ligaments
Get Radiology Tree app to read full this article<
Statistical Analysis
Get Radiology Tree app to read full this article<
Results
Phantom Study
Get Radiology Tree app to read full this article<
Table 2
The Radiation Doses According to Tube Voltages and Currents at the Four Peripheral Holes in the CT Body Dose Phantom
CTDI 100 ∗ at Four Holes of the CT Body Dose Phantom
(mGy) Tube Voltage (kVp) Tube Current
(mAs) 11 o’clock † 1 o’clock † 7 o’clock † 5 o’clock † 80 30 0.79 ± 0.09 0.73 ± 0.01 0.58 ± 0.04 0.60 ± 0.07 80 50 1.31 ± 0.04 1.35 ± 0.13 0.99 ± 0.09 1.01 ± 0.11 80 100 2.52 ± 0.01 2.65 ± 0.20 2.02 ± 0.15 2.16 ± 0.18 80 150 3.88 ± 0.09 3.93 ± 0.27 3.00 ± 0.26 2.93 ± 0.03 80 200 5.19 ± 0.21 5.05 ± 0.17 3.88 ± 0.07 3.91 ± 0.06 120 30 2.57 ± 0.09 2.62 ± 0.29 2.09 ± 0.11 2.00 ± 0.02 120 50 4.26 ± 0.07 4.08 ± 0.01 3.36 ± 0.03 3.62 ± 0.30 120 100 8.75 ± 0.47 8.69 ± 0.88 6.72 ± 0.06 6.85 ± 0.18 120 150 12.63 ± 0.20 13.86 ± 1.26 10.14 ± 0.12 10.27 ± 0.21 120 200 19.44 ± 0.06 16.55 ± 0.12 13.56 ± 0.12 13.59 ± 0.04 140 30 3.59 ± 0.03 3.59 ± 0.09 3.10 ± 0.08 3.20 ± 0.26 140 50 6.16 ± 0.07 6.24 ± 0.18 5.12 ± 0.26 5.27 ± 0.42 140 100 12.21 ± 0.09 12.06 ± 0.05 10.58 ± 0.33 10.57 ± 0.95 140 150 19.08 ± 1.23 18.98 ± 1.15 14.94 ± 0.02 15.03 ± 0.03 140 200 25.91 ± 2.26 24.24 ± 0.10 20.78 ± 1.50 21.54 ± 1.65
CT, computed tomography; CTDI 100 , CT dose index.
Get Radiology Tree app to read full this article<
Get Radiology Tree app to read full this article<
Specimen Study
Get Radiology Tree app to read full this article<
Table 3
Image Quality Means as Assessed by the Three Radiologists
Image Quality ∗ Tube Voltage (kVp) Tube Current
(mAs) Overall Image Quality Glandular Tissue-fat Conspicuity Cooper’s Ligament Sharpness 80 30 2.0694 2.5556 1.5833 80 50 2.2361 2.7361 1.7917 80 100 3.2639 3.3750 2.7222 80 150 3.4306 3.4583 3.0417 80 200 3.8333 3.8333 3.6250 120 30 3.5417 3.6528 3.0694 120 50 3.8333 3.7500 3.4444 120 100 3.9306 3.7500 3.6111 120 150 3.9583 3.8056 3.6389 120 200 3.9722 3.8750 3.6667 140 30 3.7500 3.7639 3.5278 140 50 3.8889 3.7639 3.5972 140 100 3.9722 3.8750 3.6667 140 150 3.9722 3.8611 3.7222 140 200 3.9722 3.8889 3.7222
Get Radiology Tree app to read full this article<
Get Radiology Tree app to read full this article<
Discussion
Get Radiology Tree app to read full this article<
Get Radiology Tree app to read full this article<
Get Radiology Tree app to read full this article<
Get Radiology Tree app to read full this article<
Get Radiology Tree app to read full this article<
Get Radiology Tree app to read full this article<
Get Radiology Tree app to read full this article<
Conclusion
Get Radiology Tree app to read full this article<
References
1. Inoue M., Sano T., Watai R., et. al.: Dynamic multidetector CT of breast tumors: diagnostic features and comparison with conventional techniques. AJR Am J Roentgenol 2003; 181: pp. 679-686.
2. Akashi-Tanaka S., Fukutomi T., Miyakawa K., et. al.: Diagnostic value of contrast-enhanced computed tomography for diagnosing the intraductal component of breast cancer. Breast Cancer Res Treat 1998; 49: pp. 79-86.
3. Uematsu T., Sano M., Homma K., et. al.: Staging of palpable T1–2 invasive breast cancer with helical CT. Breast Cancer 2001; 8: pp. 125-130.
4. Seo B.K., Pisano E.D., Cho K.R., et. al.: Low-dose multidetector dynamic CT in the breast: preliminary study. Clin Imaging 2005; 29: pp. 172-178.
5. Inoue T., Tamaki Y., Hamada S., et. al.: Usefulness of three-dimensional multidetector-row CT images for preoperative evaluation of tumor extension in primary breast cancer patients. Breast Cancer Res Treat 2005; 89: pp. 119-125.
6. Hagay C., Cherel P.J., de Maulmont C.E., et. al.: Contrast-enhanced CT: value for diagnosing local breast cancer recurrence after conservative treatment. Radiology 1996; 200: pp. 631-638.
7. Cheng J.C., Cheng S.H., Lin K.J., et. al.: Diagnostic thoracic-computed tomography in radiotherapy for loco-regional recurrent breast carcinoma. Int J Radiat Oncol Biol Phys 1998; 41: pp. 607-613.
8. ICRP 60 : 1990 Recommendations of the International Commission on Radiological Protection. ICRP Publication 60. Ann ICRP 1991; 21: pp. 1-3.
9. Rehani M.M., Bongartz G., Kalender W., et. al.: Managing X-ray dose in computed tomography: ICRP Special Task Force report. Ann ICRP 2000; 30: pp. 7-45.
10. ICRP : The 2007 recommendations of the International Commission on Radiological Protection. ICRP Publication 103. Ann ICRP 2007; 37: pp. 1-332.
11. Hurwitz L.M., Yoshizumi T.T., Reiman R.E., et. al.: Radiation dose to the female breast from 16-MDCT body protocols. AJR Am J Roentgenol 2006; 186: pp. 1718-1722.
12. Parker M.S., Hui F.K., Camacho M.A., et. al.: Female breast radiation exposure during CT pulmonary angiography. AJR Am J Roentgenol 2005; 185: pp. 1228-1233.
13. Nickoloff E.L.: A comparative study of thoracic radiation doses from 64-slice cardiac CT. Br J Radiol 2007; 80: pp. 537-544.
14. Angel E., Yaghmai N., Jude C.M., et. al.: Dose to radiosensitive organs during routine chest CT: effects of tube current modulation. AJR Am J Roentgenol 2009; 193: pp. 1340-1345.
15. Shope T.B., Gagne R.M., Johnson G.C.: A method for describing the doses delivered by transmission x-ray computed tomography. Med Phys 1981; 8: pp. 488-495.
16. Kang D.K., Kim E.J., Kim H.S., et. al.: Correlation of whole-breast vascularity with ipsilateral breast cancer using contrast-enhanced MDCT. AJR Am J Roentgenol 2008; 190: pp. 496-504.
17. Nagel H.D., Radiation exposure in computed tomography: fundamentals, influencing parameters, dose assessment, optimization, scanner data, terminology: Fundamentals of CT dosimetry.Nagel H.D.European Coordination Committee of the Radiological and Electromedical Industries.2000.COCIRFrankfurt, Germany:pp. 5-11.
18. Kalender W.: Computed tomography: fundamentals, system technology, image quality, applications.2000.MCD VerlagMunich, UK
19. Hamberg L.M., Rhea J.T., Hunter G.J., et. al.: Multi-detector row CT: radiation dose characteristics. Radiology 2003; 226: pp. 762-772.
20. Greene F.L.: American Joint Committee on Cancer, American Cancer Society.6th ed.2002.SpringerNew York
21. Montgomery D.C.: Design and analysis of experiments.4th ed.1997.WileyNew York
22. American College of Radiology : ACR practice guideline for the performance of screening mammography.2006.American College of RadiologyReston, VA 217–225
23. Mendel J.B., Long M., Slanetz P.J.: CT-guided core needle biopsy of breast lesions visible only on MRI. AJR Am J Roentgenol 2007; 189: pp. 152-154.
24. Perrone A., Lo Mele L., Sassi S., et. al.: MDCT of the breast. AJR Am J Roentgenol 2008; 190: pp. 1644-1651.
25. Boone J.M., Nelson T.R., Lindfors K.K., et. al.: Dedicated breast CT: radiation dose and image quality evaluation. Radiology 2001; 221: pp. 657-667.
26. Coche E.C., Vynckier S., Octave-Prignot M.: Pulmonary embolism: radiation dose with multi-detector row CT and digital angiography for diagnosis. Radiology 2006; 240: pp. 690-697.
27. Li J., Udayasankar U.K., Toth T.L., et. al.: Automatic patient centering for MDCT: effect on radiation dose. AJR Am J Roentgenol 2007; 188: pp. 547-552.
28. Gong X., Vedula A.A., Glick S.J.: Microcalcification detection using cone-beam CT mammography with a flat-panel imager. Phy Med Biol 2004; 49: pp. 2183-2195.
29. Lai C.J., Shaw C.C., Chen L., et. al.: Visibility of microcalcification in cone beam breast CT: effects of X-ray tube voltage and radiation dose. Med Phys 2007; 34: pp. 2995-3004.