
Rationale and Objectives
To assess the optimal pancreatic phase delay in terms of parenchymal enhancement and tumor-to-pancreas contrast with a bolus-tracking method.
Materials and Methods
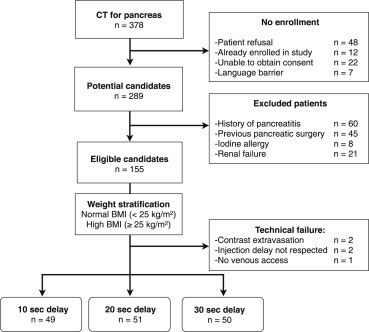
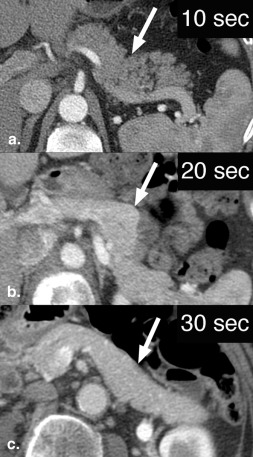
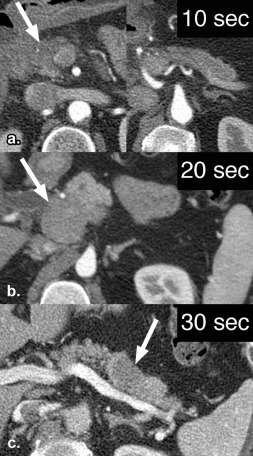
Patients referred for suspicion of pancreatic tumor and undergoing 64-detector computed tomography scanner were randomized to an individualized scan delay of 10, 20, or 30 seconds of nonionic contrast material (370 mg I/mL) after aortic enhancement above 150 Hounsfield units. The volume of contrast was adjusted to patient weight. Pancreatic and tumor enhancements were measured. Statistical analysis included analysis of variance and post hoc Tukey tests.
Results
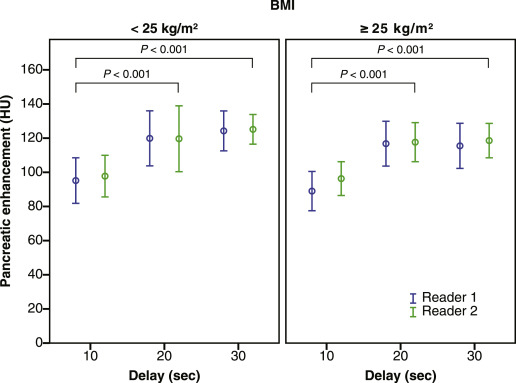
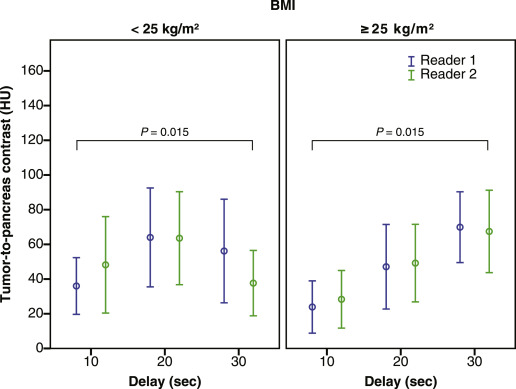
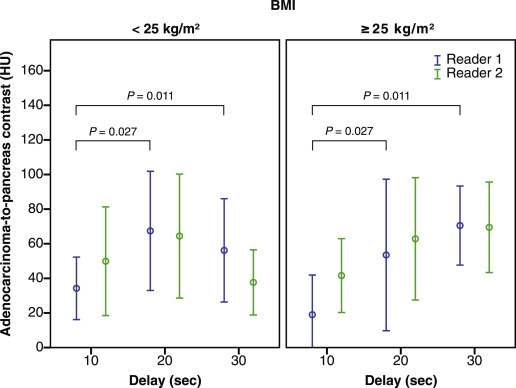
One hundred and fifty patients were randomized to individualized scan delays of 10, 20, or 30 seconds. Pancreatic parenchymal enhancement in all patients ( n = 150) was significantly higher with a delay of 20 or 30 seconds than that with 10 seconds ( P < .001 for both). Tumor-to-pancreas contrast for solid tumors ( n = 59) was significantly higher with a delay of 30 seconds than that with 10 seconds ( P = .015). Adenocarcinoma-to-pancreas contrast during pancreatic phase was significantly higher for a 20- or 30-second delay than for a 10-second delay ( P = .027 and .011, respectively) for one reader.
Conclusions
With a flow rate of 4 mL/s and weight-adjusted contrast volume, an individualized scan delay of 30 seconds after aortic transit time revealed higher pancreatic enhancement and tumor-to-pancreas contrast than that with a delay of 10 seconds.
Key Points:
1. Pancreatic parenchymal enhancement is higher with an individualized scan delay of 20 or 30 seconds than a 10-second delay.
Get Radiology Tree app to read full this article<
Get Radiology Tree app to read full this article<
Get Radiology Tree app to read full this article<
Get Radiology Tree app to read full this article<
Get Radiology Tree app to read full this article<
Materials and methods
Study Design and Subjects
Get Radiology Tree app to read full this article<
Get Radiology Tree app to read full this article<
CT Technique
Get Radiology Tree app to read full this article<
Get Radiology Tree app to read full this article<
Get Radiology Tree app to read full this article<
Image Analysis
Get Radiology Tree app to read full this article<
Get Radiology Tree app to read full this article<
Statistical Analysis
Get Radiology Tree app to read full this article<
Results
Subjects
Get Radiology Tree app to read full this article<
Get Radiology Tree app to read full this article<
Demographic Data and Tumor Characteristics
Get Radiology Tree app to read full this article<
Table 1
Demographic Data and Tumor Characteristics
Characteristic Overall Individualized Scan Delay 10 seconds 20 seconds 30 seconds_n_ 150 49 51 50 Age (mean ± SD) 61.3 ± 11.6 60.8 ± 11.5 61.4 ± 12.2 61.7 ± 11.5 Gender (male, %) 77 (51.3) 27 (55.1) 25 (49.0) 25 (50.0) BMI ≤25 kg/m 2 75 (50.0) 25 (51.0) 25 (49.0) 25 (50.0) >25 kg/m 2 75 (50.0) 24 (49.0) 26 (51.0) 25 (50.0) Contrast volume per body-weight categories <60 kg: 95 mL 39 (26.0) 12 (24.5) 13 (25.5) 14 (28.0) 60–79 kg: 125 mL 65 (43.3) 22 (44.9) 23 (45.1) 20 (40.0) 80–105 kg: 175 mL 41 (27.3) 15 (30.6) 12 (23.5) 14 (28.0) >105 kg: 200 mL 5 (3.3) 0 (0.0) 3 (5.9) 2 (4.0) Tumor size (cm, mean ± SD) 3.0 ± 3.1 3.0 ± 3.3 2.7 ± 2.2 3.4 ± 3.8 Tumor location ∗ Head 44 (29.3) 12 (24.5) 19 (37.3) 13 (26.0) Uncinate 18 (12.0) 5 (10.2) 7 (13.7) 6 (12.0) Isthmus 13 (8.7) 6 (12.2) 5 (9.8) 2 (4.0) Body 19 (12.7) 9 (18.4) 3 (5.9) 7 (14.0) Tail 17 (11.3) 5 (10.2) 7 (13.7) 5 (10.0) Final diagnosis Adenocarcinoma 46 (30.7) 16 (32.7) 13 (25.5) 17 (34.0) Neuroendocrine tumor 13 (8.7) 5 (10.2) 6(11.8) 2 (4.0) Mucinous tumor 3 (2.0) 0 (0.0) 1 (2.0) 2 (4.0) Serous tumor 7 (4.7) 2 (4.1) 2 (3.9) 3 (6.0) IPMN 10 (6.7) 3 (6.1) 1 (2.0) 6 (12.0) Pseudocyst 13 (8.7) 6 (12.2) 5 (9.8) 2 (4.0) Ampulloma 1 (0.7) 0 (0.0) 0 (0.0) 1 (2.0) Gastric cancer 1 (0.7) 0 (0.0) 1 (2.0) 0 (0.0) Lymphoma 1 (0.7) 1 (2.0) 0 (0.0) 0 (0.0) Pancreatitis 7 (4.7) 1 (2.0) 2 (3.9) 4 (8.0) Normal pancreas 48 (32.0) 15 (30.6) 20 (39.2) 13 (26.0) Lesion category † Solid pancreatic 59 (39.3) 21 (42.9) 19 (37.3) 19 (38.0) Cystic pancreatic 33 (22.0) 11 (22.4) 9 (17.6) 13 (26.0) Other 3 (2.0) 1 (2.0) 1 (2.0) 1 (2.0) None 55 (36.7) 16 (32.7) 22 (43.1) 17 (34.0)
BMI, body mass index; IPMN, intraductal papillary mucinous neoplasm; SD, standard deviation.
Data are numbers of patients. Numbers in parentheses are percentages, except were indicated.
Get Radiology Tree app to read full this article<
Get Radiology Tree app to read full this article<
Get Radiology Tree app to read full this article<
Get Radiology Tree app to read full this article<
Get Radiology Tree app to read full this article<
Get Radiology Tree app to read full this article<
Pancreatic Enhancement during Pancreatic Phase
Get Radiology Tree app to read full this article<
Table 2
Parenchymal Enhancement in Pancreatic Phase
Reader Overall Individualized Scan Delay 10 seconds 20 seconds 30 seconds Pancreatic Parenchyma ( n ) 150 49 51 50 Reader 1 110.3 ± 34.0 92.2 ± 29.6 118.3 ± 35.3 119.8 ± 30.0 Reader 2 112.6 ± 31.6 97.1 ± 26.3 118.6 ± 38.0 121.8 ± 22.6
Values are mean attenuation (measured in Hounsfield units) ± standard deviation.
Get Radiology Tree app to read full this article<
Get Radiology Tree app to read full this article<
Get Radiology Tree app to read full this article<
Get Radiology Tree app to read full this article<
Tumor-to-Pancreas Contrast during Pancreatic Phase
Get Radiology Tree app to read full this article<
Table 3
Tumor-to-Pancreas Contrast of Solid Tumors and Adenocarcinomas in Pancreatic Phase
Reader Overall Individualized Scan Delay 10 seconds 20 seconds 30 seconds Solid tumors ( n ) 59 21 19 19 Reader 1 49.6 ± 32.5 30.3 ± 21.7 55.1 ± 33.6 65.1 ± 29.6 Reader 2 50.3 ± 33.4 38.8 ± 32.7 56.0 ± 32.9 56.9 ± 33.1 Adenocarcinomas ( n ) 46 16 13 17 Reader 1 52.0 ± 34.3 28.8 ± 22.4 61.0 ± 38.4 65.1 ± 30.6 Reader 2 55.9 ± 34.1 46.9 ± 33.7 63.7 ± 35.0 57.6 ± 34.1
Values are mean attenuation (measured in Hounsfield units) ± standard deviation.
Get Radiology Tree app to read full this article<
Get Radiology Tree app to read full this article<
Get Radiology Tree app to read full this article<
Get Radiology Tree app to read full this article<
Adenocarcinoma-to-Pancreas Contrast during Pancreatic Phase
Get Radiology Tree app to read full this article<
Get Radiology Tree app to read full this article<
Get Radiology Tree app to read full this article<
Discussion
Get Radiology Tree app to read full this article<
Get Radiology Tree app to read full this article<
Get Radiology Tree app to read full this article<
Get Radiology Tree app to read full this article<
Get Radiology Tree app to read full this article<
Get Radiology Tree app to read full this article<
Get Radiology Tree app to read full this article<
Get Radiology Tree app to read full this article<
Get Radiology Tree app to read full this article<
Get Radiology Tree app to read full this article<
Get Radiology Tree app to read full this article<
Get Radiology Tree app to read full this article<
Get Radiology Tree app to read full this article<
Acknowledgments
Get Radiology Tree app to read full this article<
References
1. Jemal A., Siegel R., Ward E., et. al.: Cancer statistics, 2008. CA Cancer J Clin 2008; 58: pp. 71-96.
2. Li D., Xie K., Wolff R., et. al.: Pancreatic cancer. The Lancet 2004; 363: pp. 1049-1057.
3. Shaib Y., Davila J., Naumann C., et. al.: The impact of curative intent surgery on the survival of pancreatic cancer patients: a U.S. Population-based study. Am J Gastroenterol 2007; 102: pp. 1377-1382.
4. Hidalgo M.: Pancreatic cancer. N Engl J Med 2010; 362: pp. 1605-1617.
5. Miura F., Takada T., Amano H., et. al.: Diagnosis of pancreatic cancer. HPB 2006; 8: pp. 337-342.
6. Wong J.C., Lu D.S.: Staging of pancreatic adenocarcinoma by imaging studies. Clinical Gastroenterology and Hepatology 2008; 6: pp. 1301-1308.
7. Fleischmann D., Kamaya A.: Optimal vascular and parenchymal contrast enhancement: the current state of the art. Radiologic Clinics of North America 2009; 47: pp. 13-26.
8. Schueller G., Schima W., Schueller-Weidekamm C., et. al.: Multidetector CT of pancreas: effects of contrast material flow rate and individualized scan delay on enhancement of pancreas and tumor contrast. Radiology 2006; 241: pp. 441-448.
9. Hollett M.D., Jorgensen M.J., Jeffrey R.B.: Quantitative evaluation of pancreatic enhancement during dual-phase helical CT. Radiology 1995; 195: pp. 359-361.
10. Lu D.S., Vedantham S., Krasny R.M., et. al.: Two-phase helical CT for pancreatic tumors: pancreatic versus hepatic phase enhancement of tumor, pancreas, and vascular structures. Radiology 1996; 199: pp. 697-701.
11. Graf O., Boland G.W., Warshaw A.L., et. al.: Arterial versus portal venous helical CT for revealing pancreatic adenocarcinoma: conspicuity of tumor and critical vascular anatomy. AJR 1997; 169: pp. 119-123.
12. Keogan M.T., McDermott V.G., Paulson E.K., et. al.: Pancreatic malignancy: effect of dual-phase helical CT in tumor detection and vascular opacification. Radiology 1997; 205: pp. 513-518.
13. Boland G.W., O’Malley M.E., Saez M., et. al.: Pancreatic-phase versus portal vein-phase helical CT of the pancreas: optimal temporal window for evaluation of pancreatic adenocarcinoma. AJR 1999; 172: pp. 605-608.
14. McNulty N.J., Francis I.R., Platt J.F., et. al.: Multi–detector row helical CT of the pancreas: effect of contrast-enhanced multiphasic imaging on enhancement of the pancreas, peripancreatic vasculature, and pancreatic adenocarcinoma. Radiology 2001; 220: pp. 97-102.
15. Fletcher J.G., Wiersema M.J., Farrell M.A., et. al.: Pancreatic malignancy: value of arterial, pancreatic, and hepatic phase imaging with multi-detector row CT. Radiology 2003; 229: pp. 81-90.
16. Ichikawa T., Erturk S.M., Sou H., et. al.: MDCT of pancreatic adenocarcinoma: optimal imaging phases and multiplanar reformatted imaging. AJR 2006; 187: pp. 1513-1520.
17. Goshima S., Kanematsu M., Kondo H., et. al.: Pancreas: optimal scan delay for contrast-enhanced multi-detector row CT. Radiology 2006; 241: pp. 167-174.
18. Fukukura Y., Takumi K., Kamiyama T., et. al.: Pancreatic adenocarcinoma: a comparison of automatic bolus tracking and empirical scan delay. Abdom Imaging 2010; 35: pp. 548-555.
19. Brennan D.D., Zamboni G.A., Raptopoulos V.D., et. al.: Comprehensive preoperative assessment of pancreatic adenocarcinoma with 64-section volumetric CT. Radiographics 2007; 27: pp. 1653-1666.
20. Zamboni G.A., Kruskal J.B., Vollmer C.M., et. al.: Pancreatic adenocarcinoma: value of multidetector CT angiography in preoperative evaluation. Radiology 2007; 245: pp. 770-778.
21. Kondo H., Kanematsu M., Goshima S., et. al.: MDCT of the pancreas: optimizing scanning delay with a bolus-tracking technique for pancreatic, peripancreatic vascular, and hepatic contrast enhancement. AJR 2007; 188: pp. 751-756.
22. Ho L.M., Nelson R.C., Delong D.M.: Determining contrast medium dose and rate on basis of lean body weight: does this strategy improve patient-to-patient uniformity of hepatic enhancement during multi-detector row CT?. Radiology 2007; 243: pp. 431-437.
23. Yanaga Y., Awai K., Nakayama Y., et. al.: Pancreas: patient body weight tailored contrast material injection protocol versus fixed dose protocol at dynamic CT. Radiology 2007; 245: pp. 475-482.
24. Kondo H., Kanematsu M., Goshima S., et. al.: Abdominal multidetector CT in patients with varying body fat percentages: estimation of optimal contrast material dose. Radiology 2008; 249: pp. 872-877.
25. Stuber T., Brambs H.J., Freund W., et. al.: Sixty-four MDCT achieves higher contrast in pancreas with optimization of scan time delay. World Journal of Radiology 2012; 4: pp. 324-327.
26. Holalkere N.S., Matthes K., Kalva S.P., et. al.: 64-Slice multidetector row CT angiography of the abdomen: comparison of low versus high concentration iodinated contrast media in a porcine model. The British Journal of Radiology 2011; 84: pp. 221-228.
27. Macari M., Spieler B., Kim D., et. al.: Dual-source dual-energy MDCT of pancreatic adenocarcinoma: initial observations with data generated at 80 kVp and at simulated weighted-average 120 kVp. AJR 2010; 194: pp. W27-W32.
28. Chu A.J., Lee J.M., Lee Y.J., et. al.: Dual-source, dual-energy multidetector CT for the evaluation of pancreatic tumours. The British Journal of Radiology 2012; 85: pp. e891-e898.
29. Marin D., Nelson R.C., Guerrisi A., et. al.: 64-section multidetector CT of the upper abdomen: optimization of a saline chaser injection protocol for improved vascular and parenchymal contrast enhancement. European Radiology 2011; 21: pp. 1938-1947.
30. Kim Y.E., Park M.S., Hong H.S., et. al.: Effects of neoadjuvant combined chemotherapy and radiation therapy on the CT evaluation of resectability and staging in patients with pancreatic head cancer. Radiology 2009; 250: pp. 758-765.