
Rationale and Objectives
To evaluate clinical and imaging features associated with adequacy of the hepatocyte phase (HP) in gadoxetate disodium–enhanced liver magnetic resonance imaging (MRI) in patients without chronic liver disease (CLD).
Materials and Methods
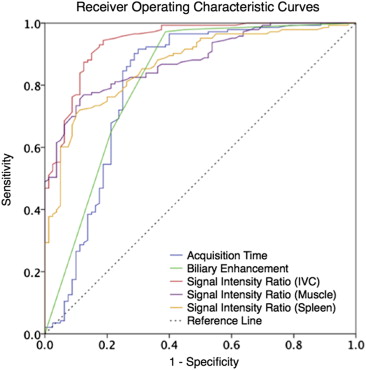
This was a retrospective institutional review board–approved study of 97 patients who underwent liver MRI examinations with gadoxetate disodium and had no history of CLD. Available late dynamic and HP sequences (3–20 minutes postinjection) were independently analyzed by four radiologists for perceived image adequacy and level of biliary enhancement. Signal intensity ratios (SIRs) of liver/inferior vena cava (IVC), liver/spleen, and liver/muscle were measured. The Spearman ρ and receiver operating characteristic analyses were performed correlating various factors with HP adequacy. A rule for predicting HP adequacy was also derived and tested to determine whether overall examination time could be shortened.
Results
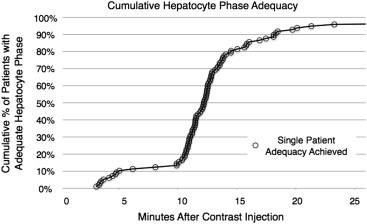
A visually adequate HP was observed in 12% of subjects by 10 minutes, 80% by 15 minutes, and 93% by 20 minutes. An SIR liver/IVC > 1.8 was the imaging feature that had the strongest correlation with an adequate HP (ρ = 0.813, P < .001), and was more predictive of adequacy of the HP than the time postinjection (ρ = 0.5, P < .001). The time at which an adequate HP was first observed did not correlate with any tested demographic or laboratory values. Stopping imaging when an SIR liver/IVC > 1.8 would have successfully reduced mean postcontrast time to 15:39 ± 4:02 from 20:00 ( P < .001), although maintaining HP adequacy.
Conclusions
Most patients without CLD undergoing gadoxetate-enhanced liver MRI achieve adequate HP at 20 minutes. However, a shorter postcontrast stopping time can be used in most patients.
Gadoxetate disodium is becoming a well-established contrast agent for contrast-enhanced magnetic resonance imaging (MRI) of the noncirrhotic liver for the detection of metastatic disease and the evaluation of focal lesions . In particular, hepatocyte phase (HP) imaging with this agent along with an optimized imaging protocol has been shown to provide high-resolution imaging with strong liver-to-lesion contrast and lesion conspicuity . At many centers, gadoxetate-enhanced MRI has become the study of choice for the detection of hepatic metastases from a variety of primary tumors.
Although most publications describe the performance of the HP performed at 20 minutes postinjection, there remains debate as to whether shorter imaging times can be used for the delayed phase without compromising image quality . In particular, the use of 10-minute postinjection HP image sets has been described, with excellent performance for the detection of focal lesions . Thus the ideal timing of the HP is unclear.
Get Radiology Tree app to read full this article<
Get Radiology Tree app to read full this article<
Materials and methods
Get Radiology Tree app to read full this article<
Get Radiology Tree app to read full this article<
Get Radiology Tree app to read full this article<
Get Radiology Tree app to read full this article<
Get Radiology Tree app to read full this article<
Get Radiology Tree app to read full this article<
Statistical Analysis
Get Radiology Tree app to read full this article<
Get Radiology Tree app to read full this article<
Get Radiology Tree app to read full this article<
Get Radiology Tree app to read full this article<
Results
Get Radiology Tree app to read full this article<
Table 1
Descriptive Statistics for the Patient Cohort
Value Mean ± SD Range Number of Patients with Value Available within 4 weeks of MRI Age (years) 53.7 ± 14.0 28–85 Gender 31 M; 66 F Total bilirubin (mg/dL) 0.8 ± 0.3 0.3–1.7 N = 91 Albumin (g/dL) 3.5 ± 0.7 1.8–4.4 N = 91 Serum creatinine (mg/dL) 0.9 ± 0.3 0.5–2.3 N = 95 Estimated liver fat fraction (%) 6 ± 1 0–51 N = 97 Presence of liver lesions No lesions ( n = 25); hypointense lesion(s) ( n = 62); isointense lesion(s) ( n = 2); hyperintense lesion(s) ( n = 3); combination of lesion types ( n = 5)
MRI, magnetic resonance imaging; SD, standard deviation.
Get Radiology Tree app to read full this article<
Get Radiology Tree app to read full this article<
Get Radiology Tree app to read full this article<
Get Radiology Tree app to read full this article<
Get Radiology Tree app to read full this article<
Get Radiology Tree app to read full this article<
Get Radiology Tree app to read full this article<
Get Radiology Tree app to read full this article<
Get Radiology Tree app to read full this article<
Get Radiology Tree app to read full this article<
Get Radiology Tree app to read full this article<
Discussion
Get Radiology Tree app to read full this article<
Get Radiology Tree app to read full this article<
Get Radiology Tree app to read full this article<
Get Radiology Tree app to read full this article<
Get Radiology Tree app to read full this article<
Get Radiology Tree app to read full this article<
Conclusions
Get Radiology Tree app to read full this article<
Get Radiology Tree app to read full this article<
References
1. Muhi A., Ichikawa T., Motosugi U., et. al.: Diagnosis of colorectal hepatic metastases: comparison of contrast-enhanced CT, contrast-enhanced US, superparamagnetic iron oxide-enhanced MRI, and gadoxetic acid-enhanced MRI. J Magn Reson Imaging 2011; 34: pp. 326-335.
2. Chung W.S., Kim M.J., Chung Y.E., et. al.: Comparison of gadoxetic acid-enhanced dynamic imaging and diffusion-weighted imaging for the preoperative evaluation of colorectal liver metastases. J Magn Reson Imaging 2011; 34: pp. 345-353.
3. Chen L., Zhang J., Zhang L., et. al.: Meta-analysis of gadoxetic acid disodium (Gd-EOB-DTPA)-enhanced magnetic resonance imaging for the detection of liver metastases. PLoS One 2012; 7: pp. e48681.
4. Mohajer K., Frydrychowicz A., Robbins J.B., et. al.: Characterization of hepatic adenoma and focal nodular hyperplasia with gadoxetic acid. J Magn Reson Imaging 2012; 36: pp. 686-696.
5. Grazioli L., Bondioni M.P., Haradome H., et. al.: Hepatocellular adenoma and focal nodular hyperplasia: value of gadoxetic acid-enhanced MR imaging in differential diagnosis. Radiology 2012; 262: pp. 520-529.
6. Hyodo T., Murakami T., Imai Y., et. al.: Hypovascular nodules in patients with chronic liver disease: risk factors for development of hypervascular hepatocellular carcinoma. Radiology 2013; 266: pp. 480-490.
7. Bashir M.R., Gupta R.T., Davenport M.S., et. al.: Hepatocellular carcinoma in a North American population: does hepatobiliary MR imaging with Gd-EOB-DTPA improve sensitivity and confidence for diagnosis?. J Magn Reson Imaging 2013; 37: pp. 398-406.
8. Motosugi U., Ichikawa T., Morisaka H., et. al.: Detection of pancreatic carcinoma and liver metastases with gadoxetic acid-enhanced MR imaging: comparison with contrast-enhanced multi-detector row CT. Radiology 2011; 260: pp. 446-453.
9. Nagle S.K., Busse R.F., Brau A.C., et. al.: High resolution navigated three-dimensional T(1)-weighted hepatobiliary MRI using gadoxetic acid optimized for 1.5 Tesla. J Magn Reson Imaging 2012; 36: pp. 890-899.
10. Bashir M.R., Husarik D.B., Ziemlewicz T.J., et. al.: Liver MRI in the hepatocyte phase with gadolinium-EOB-DTPA: does increasing the flip angle improve conspicuity and detection rate of hypointense lesions?. J Magn Reson Imaging 2012; 35: pp. 611-616.
11. Bashir M.R., Merkle E.M.: Improved liver lesion conspicuity by increasing the flip angle during hepatocyte phase MR imaging. Eur Radiol 2011; 21: pp. 291-294.
12. Haradome H., Grazioli L., Al manea K., et. al.: Gadoxetic acid disodium-enhanced hepatocyte phase MRI: can increasing the flip angle improve focal liver lesion detection?. J Magn Reson Imaging 2012; 35: pp. 132-139.
13. Goodwin M.D., Dobson J.E., Sirlin C.B., et. al.: Diagnostic challenges and pitfalls in MR imaging with hepatocyte-specific contrast agents. Radiographics 2011; 31: pp. 1547-1568.
14. Sofue K., Tsurusaki M., Tokue H., et. al.: Gd-EOB-DTPA-enhanced 3.0 T MR imaging: quantitative and qualitative comparison of hepatocyte-phase images obtained 10 min and 20 min after injection for the detection of liver metastases from colorectal carcinoma. Eur Radiol 2011; 21: pp. 2336-2343.
15. Ringe K.I., Husarik D.B., Sirlin C.B., et. al.: Gadoxetate disodium-enhanced MRI of the liver: part 1, protocol optimization and lesion appearance in the noncirrhotic liver. AJR Am J Roentgenol 2010; 195: pp. 13-28.
16. Jeong H.T., Kim M.J., Park M.S., et. al.: Detection of liver metastases using gadoxetic-enhanced dynamic and 10- and 20-minute delayed phase MR imaging. J Magn Reson Imaging 2012; 35: pp. 635-643.
17. Dixon W.T.: Simple proton spectroscopic imaging. Radiology 1984; 153: pp. 189-194.
18. Ma J.: Breath-hold water and fat imaging using a dual-echo two-point Dixon technique with an efficient and robust phase-correction algorithm. Magn Reson Med 2004; 52: pp. 415-419.
19. Feuerlein S., Boll D.T., Gupta R.T., et. al.: Gadoxetate disodium-enhanced hepatic MRI: dose-dependent contrast dynamics of hepatic parenchyma and portal vein. AJR Am J Roentgenol 2011; 196: pp. W18-W24.
20. Reeder S.B., Robson P.M., Yu H., et. al.: Quantification of hepatic steatosis with MRI: the effects of accurate fat spectral modeling. J Magn Reson Imaging 2009; 29: pp. 1332-1339.
21. Cruite I., Schroeder M., Merkle E.M., et. al.: Gadoxetate disodium-enhanced MRI of the liver: part 2, protocol optimization and lesion appearance in the cirrhotic liver. AJR Am J Roentgenol 2010; 195: pp. 29-41.
22. Frydrychowicz A., Lubner M.G., Brown J.J., et. al.: Hepatobiliary MR imaging with gadolinium-based contrast agents. J Magn Reson Imaging 2012; 35: pp. 492-511.
23. Muhi A., Ichikawa T., Motosugi U., et. al.: Diffusion- and T(2)-weighted MR imaging of the liver: effect of intravenous administration of gadoxetic acid disodium. Magn Reson Med Sci 2012; 11: pp. 185-191.
24. Ahn S.J., Kim M.J., Hong H.S., et. al.: Distinguishing hemangiomas from malignant solid hepatic lesions: a comparison of heavily T2-weighted images obtained before and after administration of gadoxetic acid. J Magn Reson Imaging 2011; 34: pp. 310-317.
25. Kim Y.K., Kwak H.S., Kim C.S., et. al.: Detection and characterization of focal hepatic tumors: a comparison of T2-weighted MR images before and after the administration of gadoxectic acid. J Magn Reson Imaging 2009; 30: pp. 437-443.
26. Motosugi U., Ichikawa T., Tominaga L., et. al.: Delay before the hepatocyte phase of Gd-EOB-DTPA-enhanced MR imaging: is it possible to shorten the examination time?. Eur Radiol 2009; 19: pp. 2623-2629.
27. Corwin M.T., Karam A.R., Baker S.P., et. al.: Determination of cystic duct patency using hepatobiliary MRI with gadoxetate disodium: is T1 precontrast imaging necessary?. J Magn Reson Imaging 2012; 35: pp. 601-606.
28. Lee N.K., Kim S., Lee J.W., et. al.: Biliary MR imaging with Gd-EOB-DTPA and its clinical applications. Radiographics 2009; 29: pp. 1707-1724.
29. Ringe K.I., Husarik D.B., Gupta R.T., et. al.: Hepatobiliary transit times of gadoxetate disodium (Primovist(R)) for protocol optimization of comprehensive MR imaging of the biliary system—what is normal?. Eur J Radiol 2011; 79: pp. 201-205.
30. Tschirch F.T., Struwe A., Petrowsky H., et. al.: Contrast-enhanced MR cholangiography with Gd-EOB-DTPA in patients with liver cirrhosis: visualization of the biliary ducts in comparison with patients with normal liver parenchyma. Eur Radiol 2008; 18: pp. 1577-1586.
31. Frydrychowicz A., Jedynak A.R., Kelcz F., et. al.: Gadoxetic acid-enhanced T1-weighted MR cholangiography in primary sclerosing cholangitis. J Magn Reson Imaging 2012; 36: pp. 632-640.
32. Davenport M.S., Viglianti B.L., Al-Hawary M.M., et. al.: Comparison of acute transient dyspnea after intravenous administration of gadoxetate disodium and gadobenate dimeglumine: effect on arterial phase image quality. Radiology 2013; 266: pp. 452-461.
33. Kim M.J., Rhee H.J., Jeong H.T.: Hyperintense lesions on gadoxetate disodium-enhanced hepatobiliary phase imaging. AJR Am J Roentgenol 2012; 199: pp. W575-W586.
34. Nassif A., Jia J., Keiser M., et. al.: Visualization of hepatic uptake transporter function in healthy subjects by using gadoxetic acid-enhanced MR imaging. Radiology 2012; 264: pp. 741-750.
35. Noren B., Forsgren M.F., Dahlqvist Leinhard O., et. al.: Separation of advanced from mild hepatic fibrosis by quantification of the hepatobiliary uptake of Gd-EOB-DTPA. Eur Radiol 2013; 23: pp. 174-181.
36. Sourbron S., Sommer W.H., Reiser M.F., et. al.: Combined quantification of liver perfusion and function with dynamic gadoxetic acid-enhanced MR imaging. Radiology 2012; 263: pp. 874-883.