
Rationale and Objectives
Our aim was to evaluate the correlation of test bolus (TB) curve parameters with main bolus (MB) contrast density for cardiac 16-slice computed tomography, and to correlate observed enhancement with patient body weight.
Materials and Methods
Sixty patients with known or suspected coronary artery disease were included in a prospective double-blind study. Contrast material containing 300 mg iodine/mL (Iomeprol 300; Imeron 300, Bracco Imaging SpA, Milan, Italy) and 400 mg iodine/mL (Iomeprol 400; Imeron 400) was injected at a rate of 1 g of iodine/second. Contrast densities (Hounsfield units) of the MB were determined in the left cardiac system. The peak density (PD) of maximum attenuation and the area under the curve (AUC) of the TB curve were calculated for each patient. The dependency of MB contrast attenuation on these parameters and on patient body weight was evaluated.
Results
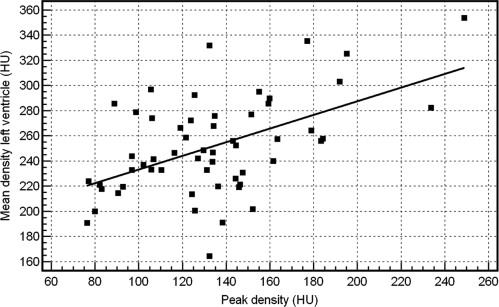
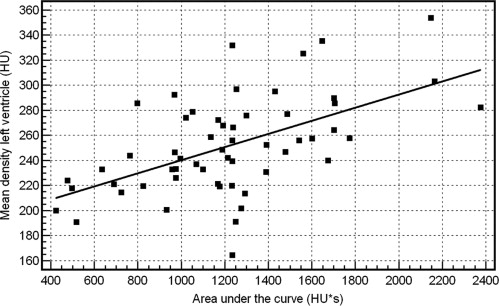
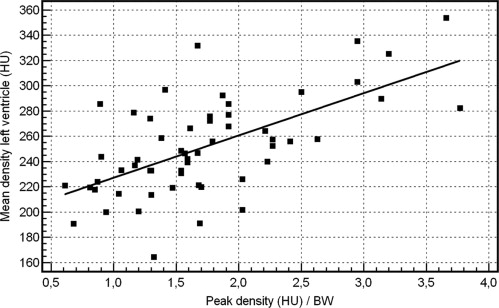
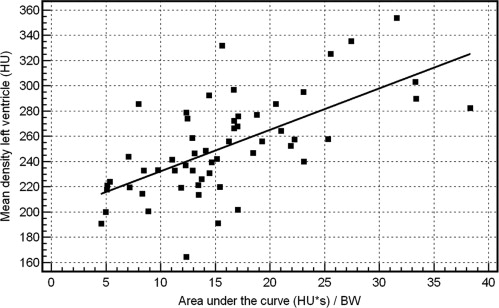
Positive correlations ( r = 0.52 and r = 0.56, respectively; P < .0001) were obtained between the PD and AUC of the TB curve with the mean density of the MB. Stronger correlations ( r = 0.63 and r = 0.64, respectively; P < .0001) between PD and AUC of the TB curve and MB attenuation were found when patient body weight was included in the analysis.
Conclusions
Strong correlation of the PD and AUC of the TB curve with the mean density of the MB is observed when patient body weight is considered. Contrast injection protocols may be optimized, and variations of MB contrast density in the left ventricle and main coronary arteries reduced, by taking these TB parameters and the weight of the patient into account.
The introduction of multislice computed tomography (MSCT) coronary angiography has led to markedly reduced overall scan times and thus to a greater need for accurate timing of the contrast bolus injection relative to the start of data acquisition ( ). Overall homogeneous vessel lumen attenuation of approximately 250–300 Hounsfield units (HU) is essential for cardiac CT, requiring injection of contrast material at a rate of about 1 g of iodine/second ( ). Approaches to obtaining this target attenuation include injecting contrast media (CM) containing a standard concentration of iodine (approximately 300 mg iodine/mL) at a moderate flow rate or, alternatively, injecting a smaller volume of a CM with a higher iodine content at a reduced injection rate ( ). The possibility to obtain excellent artifact-free contrast enhancement on MSCT coronary angiography with high-contrast resolution permits not only the improved identification of small coronary vessels, but also, if the vessel lumen is opacified adequately, the differentiation of low-density coronary artery atherosclerotic lesions from intermediate fibrous plaques and calcified lesions ( ).
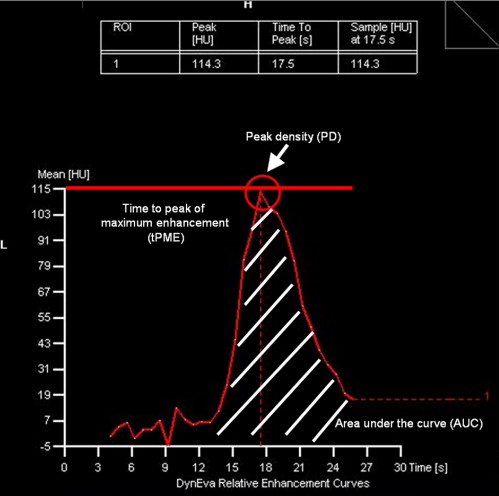
Typically, precise timing of the contrast bolus in MSCT angiography is achieved by means of an automated bolus tracking technique or by using a test bolus (TB) that permits accurate determination of the arrival time of the main contrast bolus in the vasculature close to the region to be examined ( ). Test bolus approaches use a defined small bolus of contrast material that is injected at the same injection flow rate as the main bolus (MB). Subsequently, a series of stationary low-dose scans is acquired that provides information on TB geometry, allowing calculation of a time-attenuation curve from which the exact circulation time and optimal time point for initiation of the CT scan after injection of the MB can be determined.
Get Radiology Tree app to read full this article<
Methods and materials
Legal and Ethical Conduct of the Study
Get Radiology Tree app to read full this article<
Subjects
Get Radiology Tree app to read full this article<
MSCT Angiography
Get Radiology Tree app to read full this article<
Contrast Injection Protocol
Get Radiology Tree app to read full this article<
Acquisition of Test Bolus Curve
Get Radiology Tree app to read full this article<
Get Radiology Tree app to read full this article<
Get Radiology Tree app to read full this article<
Density Measurements
Get Radiology Tree app to read full this article<
Get Radiology Tree app to read full this article<
Correlation Between Test Bolus Curve and Main Bolus
Get Radiology Tree app to read full this article<
Statistical Analysis
Get Radiology Tree app to read full this article<
Results
Get Radiology Tree app to read full this article<
Get Radiology Tree app to read full this article<
Contrast Attenuation of the Main Bolus and PD and AUC of the Test Bolus
Get Radiology Tree app to read full this article<
Correlations Between PD and AUC of the Test Bolus Curve and Mean Density in the Left Ventricle
Get Radiology Tree app to read full this article<
Table 1
Correlations of TB Parameters with MB Density Measurement in the Left Ventricle
TB Parameter Not Body Weight–Adapted Body Weight–Adapted PD 133.71 ± 36.7 HU (minimum 76.4; maximum 248.9)r = 0.52; r 2 = 0.27 1.73 ± 0.72 HU/kg (minimum 0.61; maximum 3.77)r = 0.63; r 2 = 0.40P < .0001P < .0001 AUC 1217.3 ± 411 HU*s (minimum 424; maximum 2377)r = 0.56; r 2 = 0.31 15.83 ± 7.51 HU*s/kg (minimum 4.58; maximum 38.34)r = 0.64; r 2 = 0.41P < .0001P < .0001
TB: test bolus; MB: main bolus; PD: peak density; HU: Hounsfield unit.
Get Radiology Tree app to read full this article<
Get Radiology Tree app to read full this article<
Get Radiology Tree app to read full this article<
Prediction of Main Bolus Densities in the Left Ventricle from Test Bolus Parameters and Patients’ Body Weight
Get Radiology Tree app to read full this article<
LV=1.51*BW+0.107*AUC LV
=
1.51
*
BW
+
0.107
*
AUC
LV=1.25*BW+1.13*PD LV
=
1.25
*
BW
+
1.13
*
PD
where LV is the estimated attenuation in the left ventricle (HU) and BW is the patients’ body weight (kg).
Get Radiology Tree app to read full this article<
Get Radiology Tree app to read full this article<
Discussion
Get Radiology Tree app to read full this article<
Get Radiology Tree app to read full this article<
Get Radiology Tree app to read full this article<
Get Radiology Tree app to read full this article<
Get Radiology Tree app to read full this article<
Get Radiology Tree app to read full this article<
Get Radiology Tree app to read full this article<
Get Radiology Tree app to read full this article<
Get Radiology Tree app to read full this article<
Get Radiology Tree app to read full this article<
References
1. Cademartiri F., van der Lugt A., Luccichenti G., et. al.: Parameters affecting bolus geometry in CTA: a review. J Comput Assist Tomogr 2002; 26: pp. 598-607.
2. Becker C.R., Hong C., Knez A., et. al.: Optimal contrast application for cardiac 4-detector-row computed tomography. Invest Radiol 2003; 38: pp. 690-694.
3. Rist C., Nikolaou K., Kirchin M.A., et. al.: Contrast bolus optimization for cardiac 16-slice computed tomography: comparison of contrast medium formulations containing 300 and 400 milligrams of iodine per milliliter. Invest Radiol 2006; 41: pp. 460-467.
4. Nikolaou K., Sagmeister S., Knez A., et. al.: Multidetector-row computed tomography of the coronary arteries: predictive value and quantitative assessment of non-calcified vessel-wall changes. Eur Radiol 2003; 13: pp. 2505-2512.
5. Schroeder S., Kopp A.F., Baumbach A., et. al.: Noninvasive detection and evaluation of atherosclerotic coronary plaques with multislice computed tomography. J Am Coll Cardiol 2001; 37: pp. 1430-1435.
6. Cademartiri F., Nieman K., van der Lugt A., et. al.: Intravenous contrast material administration at 16-detector row helical CT coronary angiography: test bolus versus bolus-tracking technique. Radiology 2004; 233: pp. 817-823.
7. Bae K.T., Heiken J.P., Brink J.A.: Aortic and hepatic contrast medium enhancement at CT. Radiology 1998; 207: pp. 647-655.
8. Fleischmann D., Rubin G.D., Bankier A.A., et. al.: Improved uniformity of aortic enhancement with customized contrast medium injection protocols at CT angiography. Radiology 2000; 214: pp. 363-371.
9. Hittmair K., Wunderbaldinger P., Fleischmann D.: [Contrast optimization in CT angiography]. Radiologe 1999; 39: pp. 93-99.
10. Hittmair K., Fleischmann D.: Accuracy of predicting and controlling time-dependent aortic enhancement from a test bolus injection. J Comput Assist Tomogr 2001; 25: pp. 287-294.
11. Fleischmann D., Hittmair K.: Mathematical analysis of arterial enhancement and optimization of bolus geometry for CT angiography using the discrete Fourier transform. J Comput Assist Tomogr 1999; 23: pp. 474-484.
12. Bae K.T., Heiken J.P., Brink J.A.: Aortic and hepatic contrast medium enhancement at CT. Radiology 1998; 207: pp. 657-662.
13. Bae K.T., Heiken J.P., Brink J.A.: Aortic and hepatic peak enhancement at CT: effect of contrast medium injection rate—pharmacokinetic analysis and experimental porcine model. Radiology 1998; 206: pp. 455-464.
14. Wintersperger B.J., Nikolaou K., Jakobs T.F., et. al.: Cardiac multidetector-row computed tomography: initial experience using 16 detector-row systems. Crit Rev Comput Tomogr 2003; 44: pp. 27-45.
15. Ludman P.F., Coats A.J., Poole-Wilson P.A., et. al.: Measurement accuracy of cardiac output in humans: indicator-dilution technique versus geometric analysis by ultrafast computed tomography. J Am Coll Cardiol 1993; 21: pp. 1482-1489.
16. Kaatee R., Van Leeuwen M.S., De Lange E.E., et. al.: Spiral CT angiography of the renal arteries: should a scan delay based on a test bolus injection or a fixed scan delay be used to obtain maximum enhancement of the vessels?. J Comput Assist Tomogr 1998; 22: pp. 541-547.
17. van Hoe L., Marchal G., Baert A.L., et. al.: Determination of scan delay time in spiral CT-angiography: utility of a test bolus injection. J Comput Assist Tomogr 1995; 19: pp. 216-220.
18. Platt J.F., Reige K.A., Ellis J.H.: Aortic enhancement during abdominal CT angiography: correlation with test injections, flow rates, and patient demographics. AJR Am J Roentgenol 1999; 172: pp. 53-56.
19. Sheiman R.G., Raptopoulos V., Caruso P., et. al.: Comparison of tailored and empiric scan delays for CT angiography of the abdomen. AJR Am J Roentgenol 1996; 167: pp. 725-729.
20. Cademartiri F., Mollet N.R., Lemos P.A., et. al.: Higher intracoronary attenuation improves diagnostic accuracy in MDCT coronary angiography. AJR Am J Roentgenol 2006; 187: pp. W430-W433.
21. Nikolaou K., Becker C.R., Muders M., et. al.: Multidetector-row computed tomography and magnetic resonance imaging of atherosclerotic lesions in human ex vivo coronary arteries. Atherosclerosis 2004; 174: pp. 243-252.
22. Johnson T.R., Nikolaou K., Wintersperger B.J., et. al.: Dual-source CT cardiac imaging: initial experience. Eur Radiol 2006; 16: pp. 1409-1415.
23. Nikolaou K., Rist C., Wintersperger B.J., et. al.: Clinical value of MDCT in the diagnosis of coronary artery disease in patients with a low pretest likelihood of significant disease. AJR Am J Roentgenol 2006; 186: pp. 1659-1668.
24. Pugliese F., Mollet N.R., Runza G., et. al.: Diagnostic accuracy of non-invasive 64-slice CT coronary angiography in patients with stable angina pectoris. Eur Radiol 2006; 16: pp. 575-582.
25. Mahnken A.H., Muhlenbruch G., Gunther R.W., et. al.: Cardiac CT: coronary arteries and beyond. Eur Radiol 2007; 17: pp. 994-1008.
26. Johnson T.R., Nikolaou K., Wintersperger B.J., et. al.: Optimization of contrast material administration for electrocardiogram-gated computed tomographic angiography of the chest. J Comput Assist Tomogr 2007; 31: pp. 265-271.
27. Mahnken A.H., Henzler D., Klotz E., et. al.: Determination of cardiac output with multislice spiral computed tomography: a validation study. Invest Radiol 2004; 39: pp. 451-454.
28. Bae K.T., Tran H.Q., Heiken J.P.: Multiphasic injection method for uniform prolonged vascular enhancement at CT angiography: pharmacokinetic analysis and experimental porcine model. Radiology 2000; 216: pp. 872-880.
29. Mahnken A.H., Rauscher A., Klotz E., et. al.: Quantitative prediction of contrast enhancement from test bolus data in cardiac MSCT. Eur Radiol 2007; 17: pp. 1310-1319.
30. Cademartiri F., de Monye C., Pugliese F., et. al.: High iodine concentration contrast material for noninvasive multislice computed tomography coronary angiography: iopromide 370 versus iomeprol 400. Invest Radiol 2006; 41: pp. 349-353.