
Rationale and Objectives
To determine optimum spatial resolution when imaging peripheral arteries with magnetic resonance angiography (MRA).
Materials and Methods
Eight vessel diameters ranging from 1.0 to 8.0 mm were simulated in a vascular phantom. A total of 40 three-dimensional flash MRA sequences were acquired with incremental variations of fields of view, matrix size, and slice thickness. The accurately known eight diameters were combined pairwise to generate 22 “exact” degrees of stenosis ranging from 42% to 87%. Then, the diameters were measured in the MRA images by three independent observers and with quantitative angiography (QA) software and used to compute the degrees of stenosis corresponding to the 22 “exact” ones. The accuracy and reproducibility of vessel diameter measurements and stenosis calculations were assessed for vessel size ranging from 6 to 8 mm (iliac artery), 4 to 5 mm (femoro-popliteal arteries), and 1 to 3 mm (infrapopliteal arteries). Maximum pixel dimension and slice thickness to obtain a mean error in stenosis evaluation of less than 10% were determined by linear regression analysis.
Results
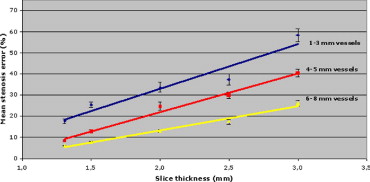
Mean errors on stenosis quantification were 8.8% ± 6.3% for 6- to 8-mm vessels, 15.5% ± 8.2% for 4- to 5-mm vessels, and 18.9% ± 7.5% for 1- to 3-mm vessels. Mean errors on stenosis calculation were 12.3% ± 8.2% for observers and 11.4% ± 15.1% for QA software ( P = .0342). To evaluate stenosis with a mean error of less than 10%, maximum pixel surface, the pixel size in the phase direction, and the slice thickness should be less than 1.56 mm 2 , 1.34 mm, 1.70 mm, respectively (voxel size 2.65 mm 3 ) for 6- to 8-mm vessels; 1.31 mm 2 , 1.10 mm, 1.34 mm (voxel size 1.76 mm 3 ), for 4- to 5-mm vessels; and 1.17 mm 2 , 0.90 mm, 0.9 mm (voxel size 1.05 mm 3 ) for 1- to 3-mm vessels.
Conclusion
Higher spatial resolution than currently used should be selected for imaging peripheral vessels.
Magnetic resonance angiography (MRA) has gained widespread clinical acceptance for imaging the aorta and its major branches ( ). Technical advances in contrast-enhanced bolus chase three-dimensional (3D)-MRA with fast-gradient echo-recalled sequences, moving table, and time-resolved imaging have improved diagnostic accuracy ( ).
However, suboptimal correlations with Digital subtraction angiography (DSA) have often been reported because of limited spatial resolution and frequent venous contamination observed with the sequence used for bolus-chasing MRA ( ). For infrapopliteal vessels, better results have been obtained when the examination was performed in two steps: a first injection combined with high-resolution acquisition on the distal leg and foot followed by a second injection to image proximal vessels ( ). However, this approach requires two consecutive injections and acquisitions to image the entire runoff.
Get Radiology Tree app to read full this article<
Get Radiology Tree app to read full this article<
Materials and methods
Vascular Phantoms
Get Radiology Tree app to read full this article<
Get Radiology Tree app to read full this article<
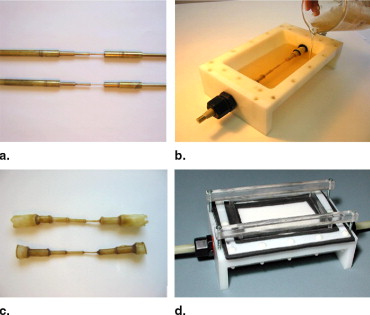
Table 1
Pairs of Vessels and Corresponding Exact Degrees of Stenosis for the Stations “Infrapopliteal,” “Femoropopliteal,” and “Iliac”
Level Pairs of Vessels (mm/mm) Stenosis Percentage (%) Infrapopliteal 1.87/3.21 41.74 (1- to 3-mm vessels) 0.99/1.87 47.06 0.99/2.39 58.58 0.99/3.21 69.16 Femoropopliteal 3.21/5.10 37.06 (4- to 5-mm vessels) 2.39/4.39 45.56 2.39/5.10 53.14 1.87/4.39 57.40 1.87/5.10 63.33 0.99/4.39 77.45 0.99/5.10 80.59 Iliac 4.39/6.29 30.21 (6- to 8-mm vessels) 5.10/7.91 35.52 4.39/7.91 44.50 3.21/6.29 48.97 3.21/7.91 59.42 2.39/6.29 62.00 2.39/7.91 69.79 1.87/6.29 70.27 1.87/7.91 76.36 0.99/6.29 84.26 0.99/7.91 87.48
Get Radiology Tree app to read full this article<
Get Radiology Tree app to read full this article<
Get Radiology Tree app to read full this article<
Description of the System and Acquisition Protocols
Get Radiology Tree app to read full this article<
Table 2
Pixel Dimensions for All Magnetic Resonance Angiography Acquisition Parameters
Acquisition # Field of View (mm) Matrix Size Pixel Size (mm × mm) Slice Thickness (mm) Voxel Size (mm 3 ) 1 390 × 390 512 × 410 0.76 × 0.95 1.31 0.95 2 390 × 390 512 × 410 0.76 × 0.95 1.50 1.08 3 390 × 390 512 × 410 0.76 × 0.95 2.00 1.44 4 390 × 390 512 × 410 0.76 × 0.95 2.50 1.81 5 390 × 390 512 × 410 0.76 × 0.95 3.00 2.17 6 390 × 390 512 × 320 0.76 × 1.22 1.31 1.21 7 390 × 390 512 × 320 0.76 × 1.22 1.50 1.39 8 390 × 390 512 × 320 0.76 × 1.22 2.00 1.85 9 390 × 390 512 × 320 0.76 × 1.22 2.50 2.31 10 390 × 390 512 × 320 0.76 × 1.22 3.00 2.78 11 390 × 390 512 × 260 0.76 × 1.50 1.31 1.49 12 390 × 390 512 × 260 0.76 × 1.50 1.50 1.71 13 390 × 390 512 × 260 0.76 × 1.50 2.00 2.28 14 390 × 390 512 × 260 0.76 × 1.50 2.50 2.85 15 390 × 390 512 × 260 0.76 × 1.50 3.00 3.42 16 390 × 390 256 × 190 1.52 × 2.05 1.31 4.08 17 390 × 390 256 × 190 1.52 × 2.05 1.50 4.67 18 390 × 390 256 × 190 1.52 × 2.05 2.00 6.23 19 390 × 390 256 × 190 1.52 × 2.05 2.50 7.79 20 390 × 390 256 × 190 1.52 × 2.05 3.00 9.35 21 490 × 490 512 × 410 0.96 × 1.20 1.31 1.51 22 490 × 490 512 × 410 0.96 × 1.20 1.50 1.73 23 490 × 490 512 × 410 0.96 × 1.20 2.00 2.30 24 490 × 490 512 × 410 0.96 × 1.20 2.50 2.88 25 490 × 490 512 × 410 0.96 × 1.20 3.00 3.46 26 490 × 490 512 × 320 0.96 × 1.53 1.31 1.92 27 490 × 490 512 × 320 0.96 × 1.53 1.50 2.20 28 490 × 490 512 × 320 0.96 × 1.53 2.00 2.93 29 490 × 490 512 × 320 0.96 × 1.53 2.50 3.67 30 490 × 490 512 × 320 0.96 × 1.53 3.00 4.41 31 490 × 490 512 × 260 0.96 × 1.88 1.31 2.36 32 490 × 490 512 × 260 0.96 × 1.88 1.50 2.71 33 490 × 490 512 × 260 0.96 × 1.88 2.00 3.61 34 490 × 490 512 × 260 0.96 × 1.88 2.50 4.51 35 490 × 490 512 × 260 0.96 × 1.88 3.00 5.41 36 490 × 490 256 × 190 1.91 × 2.58 1.31 6.46 37 490 × 490 256 × 190 1.91 × 2.58 1.50 7.39 38 490 × 490 256 × 190 1.91 × 2.58 2.00 9.86 39 490 × 490 256 × 190 1.91 × 2.58 2.50 12.32 40 490 × 490 256 × 190 1.91 × 2.58 3.00 14.78
Note: All other acquisition parameters remained constant: time of repetition 4.6/time of echo 1.8/flip angle 30°/number of excitation 1.
Get Radiology Tree app to read full this article<
Description of the Measurement Protocols
Get Radiology Tree app to read full this article<
Get Radiology Tree app to read full this article<
Get Radiology Tree app to read full this article<
Statistical Analyses of Phantom Study
Get Radiology Tree app to read full this article<
Get Radiology Tree app to read full this article<
Get Radiology Tree app to read full this article<
Get Radiology Tree app to read full this article<
Get Radiology Tree app to read full this article<
Get Radiology Tree app to read full this article<
Get Radiology Tree app to read full this article<
Results
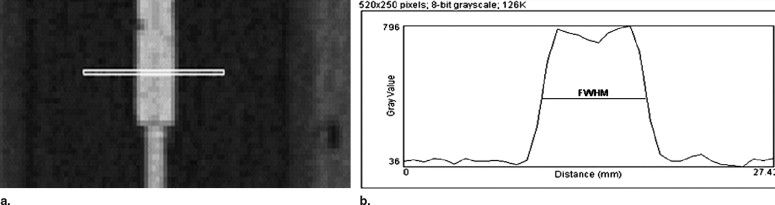
Diameter Measurements
Get Radiology Tree app to read full this article<
Table 3
Mean Error and Precision of Diameter Measurements and Stenosis Estimation for All Sequences
Observers Diameters Stenoses Mean Error (mm) Precision (1 SD) Confidence Interval Mean Error (%) Precision (1 SD) Confidence Interval QA software −0.083 ±0.827 −0.138/−0.030 11.4 ±15.1 10.3/12.5 Average 3 radiologists +1.130 ±0.764 +1.081/+1.180 12.3 ±8.2 11.7/12.9 ICC for 4 observers 0.8304 0.7632 Difference between software and radiologists Mean = 1.21 ± 0.89 mm Mean = 0.9 ± 0.12%P <.0001P = .034
SD: standard deviation; QA: quantitative angiography; ICC: intra-class correlation coefficient.
Get Radiology Tree app to read full this article<
Stenosis Calculations
Get Radiology Tree app to read full this article<
Get Radiology Tree app to read full this article<
Get Radiology Tree app to read full this article<
Table 4
Stenosis Quantification by Radiologists/by Vessel Size for All Acquisitions
Vessel Size Stenoses Mean Error (%) Precision (1 SD) Confidence Interval 1–3 mm 19.0 ± 7.6 17.5/20.5 4–5 mm 15.6 ± 8.2 14.5/16.6 6–8 mm 8.8 ± 6.3 8.1/9.4 ICC for stenoses measurements 1–3 mm = 0.5761 4–5 mm = 0.6697 6–8 mm = 0.7755
SD: standard deviation; ICC: intraclass correlation coefficient.
Get Radiology Tree app to read full this article<
Effect of Spatial Resolution in the Phase Direction
Get Radiology Tree app to read full this article<

Get Radiology Tree app to read full this article<
Effect of Pixel Size
Get Radiology Tree app to read full this article<
Effect of Slice Thickness
Get Radiology Tree app to read full this article<
Get Radiology Tree app to read full this article<
Get Radiology Tree app to read full this article<
Get Radiology Tree app to read full this article<
Table 5
Stenosis Quantification by Radiologists/by Vessel Size After Sequence Selection
Vessel size Stenoses Mean Error (%) Precision (1 SD) Confidence Interval 1–3 mm 8.7 ± 4.0 2.3/15.0 4–5 mm 8.4 ± 5.6 5.9/10.9 6–8 mm 6.2 ± 4.1 5.3/7.1 ICC for stenoses 1–3 mm = 0.7241 4–5 mm = 0.7721 6–8 mm = 0.8584
SD: standard deviation; ICC: intraclass correlation coefficient.
Get Radiology Tree app to read full this article<
Discussion
Get Radiology Tree app to read full this article<
Get Radiology Tree app to read full this article<
Get Radiology Tree app to read full this article<
Get Radiology Tree app to read full this article<
Get Radiology Tree app to read full this article<
Get Radiology Tree app to read full this article<
Get Radiology Tree app to read full this article<
Study Limitations
Get Radiology Tree app to read full this article<
Get Radiology Tree app to read full this article<
Get Radiology Tree app to read full this article<
References
1. Meaney J.F., Ridgway J.P., Chakraverty S.: Stepping-table gadolinium-enhanced digital subtraction MR angiography of the aorta and lower extremity arteries: preliminary experience. Radiology 1999; 211: pp. 59-67.
2. Rofsky N.M., Adelman M.A.: MR angiography in the evaluation of atherosclerotic peripheral vascular disease. Radiology 2000; 214: pp. 325-338.
3. Nelemans P., Leiner T., de Vet H.C.W., et. al.: Peripheral arterial disease: meta-analysis of the diagnostic performance of MR angiography. Radiology 2000; 217: pp. 105-114.
4. Koelemay M.J., Lijmer J.G., Stoker J., et. al.: Magnetic resonance angiography for the evaluation of lower extremity arterial disease: a meta-analysis. JAMA 2001; 285: pp. 1338-1345.
5. Steffens J.C., Schafer F.K., Oberscheid B., et. al.: Bolus-chasing contrast-enhanced 3D MRA of the lower extremity. Acta Radiol 2003; 44: pp. 185-192.
6. Vavrik J., Rohrmoser G.M., Madani B., et. al.: Comparison of MR angiography versus digital subtraction angiography as a basis for planning treatment of lower limb occlusive disease. J Endovasc Ther 2004; 11: pp. 294-301.
7. Loewe C., Schoder M., Rand T., et. al.: Peripheral vascular occlusive disease: evaluation with contrast-enhanced moving-bed MR angiography versus digital subtraction angiography in 106 patients. AJR Am J Roentgenol 2002; 179: pp. 1013-1021.
8. Bezooijen R., van den Bosch H.C., Tielbeek A.V., et. al.: Peripheral arterial disease: sensitivity-encoded multiposition MR angiography compared with intraarterial angiography and conventional multiposition MR angiography. Radiology 2004; 231: pp. 263-271.
9. de Vries M., Nijenhuis R.J., Hoogeveen R.M., et. al.: Contrast-enhanced peripheral MR angiography using SENSE in multiple stations: feasibility study. J Magn Reson Imaging 2005; 21: pp. 37-45.
10. Leiner T., Kessels A.G., Schurink G.W., et. al.: Comparison of contrast-enhanced magnetic resonance angiography and digital subtraction angiography in patients with chronic critical ischemia and tissue loss. Invest Radiol 2004; 39: pp. 435-444.
11. Hentsch A., Aschauer M.A., Balzer J.O., et. al.: Gadobutrol-enhanced moving-table magnetic resonance angiography in patients with peripheral vascular disease: a prospective, multi-centre blinded comparison with digital subtraction angiography. Eur Radiol 2003; 13: pp. 2103-2114.
12. Klein W.M., Schlejen P.M., Eikelboom B.C., et. al.: MR angiography of the lower extremities with a moving-bed infusion-tracking technique. Cardiovasc Intervent Radiol 2003; 26: pp. 1-8.
13. Prince M.R., Chabra S.G., Watts R., et. al.: Contrast material travel times in patients undergoing peripheral MR angiography. Radiology 2002; 224: pp. 55-61.
14. Cronberg C.N., Sjoberg S., Albrechtsson U., et. al.: Peripheral arterial disease. Acta Radiol 2003; 44: pp. 59-66.
15. Leiner T., Ho K.Y., Nelemans P.J., et. al.: Three-dimensional contrast-enhanced moving-bed infusion-tracking (MoBI-track) peripheral MR angiography with flexible choice of imaging parameters for each field of view. J Magn Reson Imaging 2002; 11: pp. 368-377.
16. Fenlon H.M., Yucel E.K.: Advances in abdominal, aortic, and peripheral contrast-enhanced MR angiography. Magn Reson Imaging Clin N Am 1999; 7: pp. 319-336.
17. Cloutier G., Soulez G., Qanadli S.D., et. al.: A multimodality vascular imaging phantom with fiducial markers visible in DSA, CTA, MRA, and ultrasound. Med Phys 2004; 31: pp. 1424-1433.
18. Frayne R., Gowman L.M., Rickey D.W.: A geometrically accurate vascular phantom for comparative studies of x-ray, ultrasound, and magnetic resonance vascular imaging: construction and geometrical verification. Med Phys 1993; 20: pp. 415-425.
19. Smith R.F., Frayne R., Moreau M., Rutt B.K., Fenster A., Holdsworth D.W.: Stenosed anthropomorphic vascular phantoms for digital subtraction angiography, magnetic resonance and Doppler ultrasound investigations. SPIE Phys Med Imaging 1994; 2163: pp. 235-242.
20. Fritz-Hansen T., Rostrup E., Larsson H.B.W., et. al.: Measurement of the arterial concentration of Gd-DTPA using MRI: a step toward quantitative perfusion imaging. Magn Reson Med 1996; 36: pp. 225-231.
21. Westenberg J.J., Wasser M.N., van der Geest R.J., et. al.: Gadolinium contrast-enhanced three-dimensional MRA of peripheral arteries with multiple bolus injection: scan optimization in vitro and in vivo. Int J Cardiac Imaging 1999; 15: pp. 161-173.
22. Hernandez-Hoyos M., Orkisz M., Puech P., et. al.: Computer-assisted analysis of three-dimensional MR angiograms. Radiographics 2002; 22: pp. 421-436.
23. Westenberg J.J., van der Geest R.J., Wasser M.N., et. al.: Vessel diameter measurements in gadolinium contrast-enhanced three-dimensional MRA of peripheral arteries. Magn Reson Imaging 2000; 18: pp. 13-22.
24. Boussion N., Soulez G., De Guise J.A., et. al.: Geometrical accuracy and fusion of multimodal vascular images: a phantom study. Med Phys 2004; 31: pp. 1434-1443.
25. Foo T.K., Ho V.B., Hood M.N., et. al.: High-spatial-resolution multistation MR imaging of lower-extremity peripheral vasculature with segmented volume acquisition: feasibility study. Radiology 2001; 219: pp. 835-841.
26. Madore B., Pelc N.J.: SMASH and SENSE: experimental and numerical comparisons. Magn Reson Med 2001; 45: pp. 1103-1111.
27. Maki J.H., Wilson G.J., Eubank W.B., et. al.: Utilizing SENSE to achieve lower station sub-millimeter isotropic resolution and minimal venous enhancement in peripheral MR angiography. J Magn Reson Imaging 2002; 15: pp. 484-491.