
Rationale and Objectives
The aim of this study was to investigate the feasibility of applying measures sensitive to time-to-peak ( T peak ) heterogeneity as indicators for malignancy on breast dynamic contrast-enhanced magnetic resonance imaging.
Materials and Methods
The study included 39 benign and 97 malignant breast lesions from 103 patients. Lesions were automatically segmented by k-means clustering. Voxel-by-voxel T peak values were extracted using an empirical model. The p th percentile values ( p = 10, 20…) of the T peak distribution within each lesion and the fractional and absolute hot spot volumes were determined, where the hot spot volume is the volume of tissue with T peak less than a threshold value. Using the area under the receiver-operating characteristic curve (AUC), these measures were tested as indicators for differentiating fibroadenomas from invasive lesions and from ductal carcinoma in situ, as well as for differentiating nonfibroadenoma benign lesions from these malignant lesions. Region of interest–based T peak measurements were also tested. Finally, the relationship between hot spot volume and lesion volume was investigated.
Results
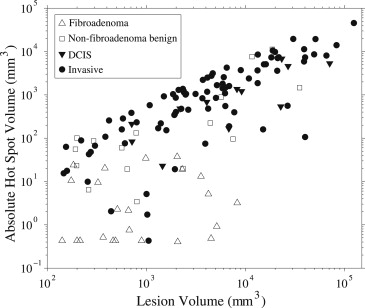
For differentiating fibroadenomas from malignant lesions, AUC values increased with decreasing values of p . At the optimal threshold (3 minutes), the hot spot volume provided high diagnostic performance (AUC ≥0.96 ± 0.02 for absolute hot spot volume). However, for differentiating nonfibroadenoma benign lesions from malignant lesions, AUC values were low. A significant correlation between absolute hot spot volume and lesion volume was found for malignant lesions and nonfibroadenoma benign lesions.
Conclusion
Quantitative analysis of the T peak distribution can be optimized for diagnostic performance, providing indicators sensitive to intralesion T peak heterogeneity.
Dynamic contrast-enhanced (DCE) magnetic resonance imaging (MRI) is used extensively for the diagnosis of breast lesions . Clinical DCE MRI analysis typically involves visual inspection of the time evolution of the signal enhancement and morphology of the enhanced region . However, there is growing interest in the development and assessment of quantitative methods to provide objective and improved diagnostic indicators .
Quantitative analysis applied to the time evolution (kinetics) of breast DCE MRI includes both empirical measures as well as pharmacokinetic models . Although the latter have the advantage of providing physiologic parameters, these models can be challenging to apply. There is ongoing research to deal with complex issues involved in their application, such as how to obtain accurate and robust arterial input functions as well as the level of model complexity and time resolution required . Empirical measures, on the other hand, are much simpler to apply. They can be applied to images that have been acquired in clinical scans using imaging parameters (eg., high spatial resolution, full breast coverage) that are preferred for radiologic assessment but may not be ideal for pharmacokinetic model analysis.
Get Radiology Tree app to read full this article<
Get Radiology Tree app to read full this article<
Materials and methods
Patients and Lesions
Get Radiology Tree app to read full this article<
Get Radiology Tree app to read full this article<
Get Radiology Tree app to read full this article<
Table 1
Histopathologic Diagnoses for the 136 Breast Lesions
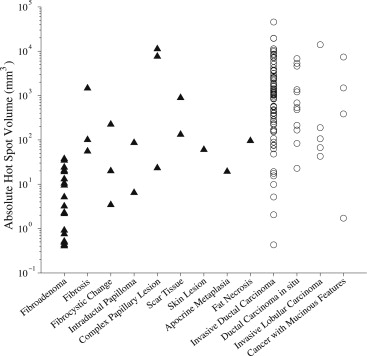
Diagnosis_n_Benign lesions 39 Fibroadenoma 23 Fibrosis 3 Fibrocystic change 3 Intraductal papilloma 2 Complex papillary lesion 3 Scar tissue 2 Skin lesion 1 Apocrine metaplasia 1 Fat necrosis 1Malignant lesions 97 Invasive ductal carcinoma 76 Ductal carcinoma in situ 12 Invasive lobular carcinoma 5 Invasive cancer with mucinous features 4All lesions 136
Get Radiology Tree app to read full this article<
Image Acquisition
Get Radiology Tree app to read full this article<
Whole-lesion Image Analysis
Lesion segmentation
Get Radiology Tree app to read full this article<
T peak analysis
Get Radiology Tree app to read full this article<
ΔS(t)=a∗t∗exp(−tc/b), Δ
S
(
t
)
=
a
∗
t
∗
exp
(
−
t
c
/
b
)
,
ΔS(t)=S(t)−S0, Δ
S
(
t
)
=
S
(
t
)
−
S
0
,
where t is the time elapsed after the beginning of contrast agent administration; S ( t ) is signal intensity at time t ; S 0 is signal intensity before contrast agent administration; and a , b , and c are free parameters that can vary from voxel to voxel. The trust-region algorithm was applied for nonlinear curve fitting. The T peak of each curve was calculated using the following relationship :
Tpeak=(b/c)1c. T
peak
=
(
b
/
c
)
1
c
.
Get Radiology Tree app to read full this article<
Get Radiology Tree app to read full this article<
ROI Image Analysis
Get Radiology Tree app to read full this article<
Receiver-operating Characteristic (ROC) Analysis
Get Radiology Tree app to read full this article<
Get Radiology Tree app to read full this article<
Get Radiology Tree app to read full this article<
Results
Get Radiology Tree app to read full this article<
![Figure 1, Median percentile time-to-peak ( T peak ) values and region of interest (ROI)–based T peak values (a) as well as areas under the receiver-operating characteristic curve (AUCs) corresponding to percentile T peak values (b) . (a) The median and interquartile ranges (error bars) of the p th percentile T peak values ( p = 10, 20,…, 50) and ROI-based T peak values are shown for each of the four groups of lesions (fibroadenoma, nonfibroadenoma benign, ductal carcinoma in situ [DCIS], and invasive). The 10th percentile T peak shows similar median values as does the ROI-based measure. (b) The AUC values for fibroadenoma versus invasive lesions (thick solid), fibroadenoma versus DCIS (thick dash-dot), and nonfibroadenoma benign lesions versus invasive lesions (thick dashed) are displayed as a function of p . The two curves with the narrow line widths above and below each thick curve represent the AUC plus and minus one standard error, respectively.](https://storage.googleapis.com/dl.dentistrykey.com/clinical/OptimizationofTimetopeakAnalysisforDifferentiatingMalignantandBenignBreastLesionswithDynamicContrastEnhancedMRI/0_1s20S107663321100047X.jpg)
Get Radiology Tree app to read full this article<
Get Radiology Tree app to read full this article<
Get Radiology Tree app to read full this article<
![Figure 2, Median fractional hot spot volumes (a) and corresponding areas under the receiver-operating characteristic curve (AUCs) (b) . The fractional hot spot volume is the fractional volume of tissue within the lesion having time-to-peak ( T peak ) values less than a threshold value. (a) The median and interquartile ranges (error bars) of the fractional hot spot volumes are shown for each of the four groups of lesions (fibroadenoma, nonfibroadenoma benign, ductal carcinoma in situ [DCIS], and invasive). (b) The AUC values for fibroadenoma versus invasive lesions (thick solid), fibroadenoma versus DCIS (thick dash-dot), and nonfibroadenoma benign lesions versus invasive lesions (thick dashed) are displayed as a function of the T peak threshold. The two curves with the narrow line widths above and below each thick curve represent the AUC plus and minus one standard error, respectively. The maximal AUC values are achieved at the threshold of approximately 3 to 4 minutes for fibroadenoma versus invasive lesions and 3 minutes for fibroadenoma versus DCIS.](https://storage.googleapis.com/dl.dentistrykey.com/clinical/OptimizationofTimetopeakAnalysisforDifferentiatingMalignantandBenignBreastLesionswithDynamicContrastEnhancedMRI/1_1s20S107663321100047X.jpg)
![Figure 3, Median absolute hot spot volumes (a) and corresponding areas under the receiver-operating characteristic curve (AUCs) (b) . The absolute hot spot volume is the volume of tissue within the lesion having time-to-peak ( T peak ) values less than a threshold value. (a) The median and interquartile ranges (error bars) of the fractional hot spot volumes are shown for each of the four groups of lesions (fibroadenoma, nonfibroadenoma benign, ductal carcinoma in situ [DCIS], and invasive). (b) The AUC values for fibroadenoma versus invasive lesions (thick solid), fibroadenoma versus DCIS (thick dash-dot), and nonfibroadenoma benign lesions versus invasive lesions (thick dashed) are displayed as a function of the T peak threshold. The two curves with the narrow line widths above and below each thick curve represent the AUC plus and minus one standard error, respectively. The maximal AUC values are achieved at the threshold of approximately 3 to 4 minutes for fibroadenoma versus invasive lesions and for fibroadenoma versus DCIS.](https://storage.googleapis.com/dl.dentistrykey.com/clinical/OptimizationofTimetopeakAnalysisforDifferentiatingMalignantandBenignBreastLesionswithDynamicContrastEnhancedMRI/2_1s20S107663321100047X.jpg)
Get Radiology Tree app to read full this article<
Get Radiology Tree app to read full this article<
Table 2
AUC Values for Five Measures in Differentiating Four Groups of Breast Lesions
Comparison AUC ± Standard Error Manual ROI 10th Percentile 50th Percentile Fractional (3 minutes) Absolute (3 minutes) Fibroadenoma vs invasive 0.87 ± 0.05 c 0.93 ± 0.03 a,b 0.88 ± 0.03 b,c 0.95 ± 0.02 a 0.96 ± 0.02 a Fibroadenoma vs DCIS 0.94 ± 0.04 a,b 0.87 ± 0.06 b 0.63 ± 0.11 c 0.94 ± 0.04 a,b 0.99 ± 0.01 a Nonfibroadenoma benign vs invasive 0.58 ± 0.09 c 0.66 ± 0.09 c 0.66 ± 0.09 c 0.67 ± 0.08 c 0.72 ± 0.08 c Nonfibroadenoma benign vs DCIS 0.63 ± 0.11 c 0.52 ± 0.11 c 0.41 ± 0.11 c 0.53 ± 0.11 c 0.71 ± 0.10 c
Absolute, absolute hot spot volume; AUC, area under the receiver-operating characteristic curve; DCIS, ductal carcinoma in situ; Fractional, fractional hot spot volume; ROI, region of interest.
In the same row, measures with different subscript letters are significantly different (receiver-operating characteristic comparison test, P < .05), and measures with the same subscript letters are not significantly different (receiver-operating characteristic comparison test, P ≥ .05).
![Figure 4, Receiver-operating characteristic (ROC) curves for differentiating fibroadenoma versus invasive lesions and fibroadenoma versus ductal carcinoma in situ [DCIS] using region of interest (ROI)–based analysis and absolute hot spot volume at a time-to-peak ( T peak ) threshold of 3 minutes. The areas under the curves (AUCs) for each test are given in Table 2. Pairwise ROC curve comparison showed that for differentiating fibroadenoma from invasive lesions, the absolute hot spot measure performed significantly better than the ROI-based measure. However, for differentiating fibroadenoma from DCIS, no significant difference was found.](https://storage.googleapis.com/dl.dentistrykey.com/clinical/OptimizationofTimetopeakAnalysisforDifferentiatingMalignantandBenignBreastLesionswithDynamicContrastEnhancedMRI/3_1s20S107663321100047X.jpg)
Get Radiology Tree app to read full this article<
Get Radiology Tree app to read full this article<
Get Radiology Tree app to read full this article<
Table 3
Linear Regression Analysis for Absolute Hot Spot Volume at a Threshold of 3 Minutes Versus Lesion Volume
Lesion Coefficient_F_ Statistics Slope Intercept (mm 3 )R 2 F__P Nonfibroadenoma benign 0.17 ± 0.08 400 ± 900 0.26 4.9 .04 Ductal carcinoma in situ 0.09 ± 0.03 500 ± 700 0.53 11 .007 Invasive 0.27 ± 0.02 50 ± 400 0.74 243 <.001
Get Radiology Tree app to read full this article<
Get Radiology Tree app to read full this article<
Get Radiology Tree app to read full this article<
Discussion
Get Radiology Tree app to read full this article<
Get Radiology Tree app to read full this article<
Get Radiology Tree app to read full this article<
Get Radiology Tree app to read full this article<
Get Radiology Tree app to read full this article<
Get Radiology Tree app to read full this article<
Get Radiology Tree app to read full this article<
Get Radiology Tree app to read full this article<
Get Radiology Tree app to read full this article<

Get Radiology Tree app to read full this article<
Conclusions
Get Radiology Tree app to read full this article<
Appendix
Get Radiology Tree app to read full this article<
C(t)=D⋅Ktrans⋅∑2i=1ai⋅e−kep⋅t−e−mi⋅tmi−kep, C
(
t
)
=
D
⋅
K
trans
⋅
∑
i
=
1
2
a
i
⋅
e
−
k
ep
⋅
t
−
e
−
m
i
⋅
t
m
i
−
k
ep
,
where D is the dose of contrast agent (gadopentetate dimeglumine) normalized by body weight (millimoles per kilogram), K trans is the endothelial transfer constant for transporting contrast agent from plasma to interstitial space, and k ep is the rate constant for transport from interstitial space to plasma. Also, a i and m i are the amplitudes and rate constants describing the two exponential components of the arterial input function.
Get Radiology Tree app to read full this article<
Get Radiology Tree app to read full this article<
0=∑2i=1ai⋅mi⋅e−mi⋅Tpeak−kep⋅e−kep⋅Tpeakmi−kep. 0
=
∑
i
=
1
2
a
i
⋅
m
i
⋅
e
−
m
i
⋅
T
peak
−
k
ep
⋅
e
−
k
ep
⋅
T
peak
m
i
−
k
ep
.
Get Radiology Tree app to read full this article<
Get Radiology Tree app to read full this article<
References
1. Turnbull L.W.: Dynamic contrast-enhanced MRI in the diagnosis and management of breast cancer. NMR Biomed 2009; 22: pp. 28-39.
2. Peters N.H., Borel Rinkes I.H., Zuithoff N.P., et. al.: Meta-analysis of MR imaging in the diagnosis of breast lesions. Radiology 2008; 246: pp. 116-124.
3. Ikeda D.M., Hylton N.M., Kinkel K., et. al.: Development, standardization, and testing of a lexicon for reporting contrast-enhanced breast magnetic resonance imaging studies. J Magn Reson Imaging 2001; 13: pp. 889-895.
4. Schnall M.D., Blume J., Bluemke D.A., et. al.: Diagnostic architectural and dynamic features at breast MR imaging: multicenter study. Radiology 2006; 238: pp. 42-53.
5. Kelcz F., Santyr G.E., Cron G.O., et. al.: Application of a quantitative model to differentiate benign from malignant breast lesions detected by dynamic, gadolinium-enhanced MRI. J Magn Reson Imaging 1996; 6: pp. 743-752.
6. Buckley D.L., Kerslake R.W., Blackband S.J., et. al.: Quantitative analysis of multi-slice Gd-DTPA enhanced dynamic MR images using an automated simplex minimization procedure. Magn Reson Med 1994; 32: pp. 646-651.
7. Ikeda O., Yamashita Y., Morishita S., et. al.: Characterization of breast masses by dynamic enhanced MR imaging. A logistic regression analysis. Acta Radiol 1999; 40: pp. 585-592.
8. Szabo B.K., Aspelin P., Wiberg M.K., et. al.: Dynamic MR imaging of the breast. Analysis of kinetic and morphologic diagnostic criteria. Acta Radiol 2003; 44: pp. 379-386.
9. Szabo B.K., Wiberg M.K., Bone B., et. al.: Application of artificial neural networks to the analysis of dynamic MR imaging features of the breast. Eur Radiol 2004; 14: pp. 1217-1225.
10. Liney G.P., Sreenivas M., Gibbs P., et. al.: Breast lesion analysis of shape technique: semiautomated vs. manual morphological description. J Magn Reson Imaging 2006; 23: pp. 493-498.
11. Ertas G., Gulcur H.O., Tunaci M.: Normalized maximum intensity time ratio maps and morphological descriptors for assessment of malignancy in MR mammography. Med Phys 2008; 35: pp. 1893-1900.
12. Nie K., Chen J.H., Yu H.J., et. al.: Quantitative analysis of lesion morphology and texture features for diagnostic prediction in breast MRI. Acad Radiol 2008; 15: pp. 1513-1525.
13. Chen W., Giger M.L., Bick U., et. al.: Automatic identification and classification of characteristic kinetic curves of breast lesions on DCE-MRI. Med Phys 2006; 33: pp. 2878-2887.
14. Jansen S.A., Fan X., Karczmar G.S., et. al.: DCEMRI of breast lesions: is kinetic analysis equally effective for both mass and nonmass-like enhancement?. Med Phys 2008; 35: pp. 3102-3109.
15. Larsson H.B., Stubgaard M., Frederiksen J.L., et. al.: Quantitation of blood-brain barrier defect by magnetic resonance imaging and gadolinium-DTPA in patients with multiple sclerosis and brain tumors. Magn Reson Med 1990; 16: pp. 117-131.
16. Brix G., Semmler W., Port R., et. al.: Pharmacokinetic parameters in CNS Gd-DTPA enhanced MR imaging. J Comput Assist Tomogr 1991; 15: pp. 621-628.
17. Tofts P.S., Berkowitz B., Schnall M.D.: Quantitative analysis of dynamic Gd-DTPA enhancement in breast tumors using a permeability model. Magn Reson Med 1995; 33: pp. 564-568.
18. Hayton P., Brady M., Tarassenko L., et. al.: Analysis of dynamic MR breast images using a model of contrast enhancement. Med Image Anal 1997; 1: pp. 207-224.
19. Port R.E., Knopp M.V., Brix G.: Dynamic contrast-enhanced MRI using Gd-DTPA: interindividual variability of the arterial input function and consequences for the assessment of kinetics in tumors. Magn Reson Med 2001; 45: pp. 1030-1038.
20. Behrens S., Laue H., Althaus M., et. al.: Computer assistance for MR based diagnosis of breast cancer: present and future challenges. Comput Med Imaging Graph 2007; 31: pp. 236-247.
21. Issa B., Buckley D.L., Turnbull L.W.: Heterogeneity analysis of Gd-DTPA uptake: improvement in breast lesion differentiation. J Comput Assist Tomogr 1999; 23: pp. 615-621.
22. Furman-Haran E., Schechtman E., Kelcz F., et. al.: Magnetic resonance imaging reveals functional diversity of the vasculature in benign and malignant breast lesions. Cancer 2005; 104: pp. 708-718.
23. Ertas G., Gulcur H.O., Tunaci M.: Improved lesion detection in MR mammography: three-dimensional segmentation, moving voxel sampling, and normalized maximum intensity-time ratio entropy. Acad Radiol 2007; 14: pp. 151-161.
24. Karahaliou A., Vassiou K., Arikidis N.S., et. al.: Assessing heterogeneity of lesion enhancement kinetics in dynamic contrast-enhanced MRI for breast cancer diagnosis. Br J Radiol 2010; 83: pp. 296-309.
25. Carmeliet P., Jain R.K.: Angiogenesis in cancer and other diseases. Nature 2000; 407: pp. 249-257.
26. Jackson A., O’Connor J.P., Parker G.J., et. al.: Imaging tumor vascular heterogeneity and angiogenesis using dynamic contrast-enhanced magnetic resonance imaging. Clin Cancer Res 2007; 13: pp. 3449-3459.
27. Tofts P.S., Kermode A.G.: Measurement of the blood-brain barrier permeability and leakage space using dynamic MR imaging. 1. Fundamental concepts. Magn Reson Med 1991; 17: pp. 357-367.
28. Lee S.H., Kim J.H., Kim K.G., et. al.: Optimal clustering of kinetic patterns on malignant breast lesions: comparison between K-means clustering and three-time-points method in dynamic contrast-enhanced MRI. Conf Proc IEEE Eng Med Biol Soc 2007; 2007: pp. 2089-2093.
29. Gal Y., Mehnert A., Bradley A., et. al.: An evaluation of four parametric models of contrast enhancement for dynamic magnetic resonance imaging of the breast. Conf Proc IEEE Eng Med Biol Soc 2007; 2007: pp. 71-74.
30. Parker C.B., DeLong E.R.: ROC methodology within a monitoring framework. Stat Med 2003; 22: pp. 3473-3488.
31. Chen J.H., Liu H., Baek H.M., et. al.: Magnetic resonance imaging features of fibrocystic change of the breast. Magn Reson Imaging 2008; 26: pp. 1207-1214.
32. Daly C.P., Jaeger B., Sill D.S.: Variable appearances of fat necrosis on breast MRI. AJR Am J Roentgenol 2008; 191: pp. 1374-1380.
33. Iglesias A., Arias M., Santiago P., et. al.: Benign breast lesions that simulate malignancy: magnetic resonance imaging with radiologic-pathologic correlation. Curr Probl Diagn Radiol 2007; 36: pp. 66-82.
34. Kurz K.D., Roy S., Modder U., et. al.: Typical atypical findings on dynamic MRI of the breast. Eur J Radiol 2010; 76: pp. 195-210.
35. Mussurakis S., Buckley D.L., Coady A.M., et. al.: Observer variability in the interpretation of contrast enhanced MRI of the breast. Br J Radiol 1996; 69: pp. 1009-1016.
36. Mussurakis S., Buckley D.L., Horsman A.: Dynamic MR imaging of invasive breast cancer: correlation with tumour grade and other histological factors. Br J Radiol 1997; 70: pp. 446-451.
37. Mussurakis S., Buckley D.L., Horsman A.: Dynamic MRI of invasive breast cancer: assessment of three region-of-interest analysis methods. J Comput Assist Tomogr 1997; 21: pp. 431-438.
38. Liney G.P., Gibbs P., Hayes C., et. al.: Dynamic contrast-enhanced MRI in the differentiation of breast tumors: user-defined versus semi-automated region-of-interest analysis. J Magn Reson Imaging 1999; 10: pp. 945-949.
39. Weinmann H.J., Laniado M., Mutzel W.: Pharmacokinetics of GdDTPA/dimeglumine after intravenous injection into healthy volunteers. Physiol Chem Phys Med NMR 1984; 16: pp. 167-172.